Share your thoughts
placeholder
Article
Smart money is quietly stacking UNI while everyone else is still sleeping on this setup.

$UNI /USDT - LONG

Trade Plan:
Entry: 8.461 – 8.561
SL: 8.035
TP1: 8.868
TP2: 9.106
TP3: 9.464

Why this setup?
Why now? The daily trend is bullish and the 1h price sits at 8.513, sitting right at the entry zone of 8.511. The 15m RSI at 29.57 shows the asset is deeply oversold on the short term, which often precedes a snap-back move higher. The 1h ATR of 0.19845 tells us the current hourly volatility is modest, meaning a breakout from this zone could be swift and clean. The target zones are 8.868 for T
UNI-2.31%
#USHouseAdvancesBitcoinReserveBill
BITCOIN RESERVE POLICY IS ENTERING A NEW PHASE
Bitcoin’s relationship with the U.S. government is moving into a different chapter.
On Sep 16, 2026, the U.S. House Financial Services Committee advanced the American Reserve Modernization Act of 2026, H.R. 8957, by a 28–21 vote. The committee action does not make the proposal law, but it moves the legislation forward and puts renewed attention on the possibility of establishing a formal federal framework for Bitcoin reserves.
The bill was introduced on May 21 by Representative Nick Begich, with Representative
BTC+0.14%
GM Folks!! 😎
post-image
It’s SnapBack Saturday!
Touching grass today. 💯
post-image
$ARGUS ARC innovatively uses USDC as GAS. The benefit is that it’s genuinely convenient, since you no longer need ETH—just bridge USDC over and enjoy seamless transactions. But the drawbacks are also obvious: once you approve USDC through a phishing scam, your funds are gone immediately. There are also security issues: I’ve found that many projects directly copy ETH’s code without realizing at all that USDC is the underlying GAS.
The ARC chain has had a truly disastrous launch.
I bought $ARGUS , feeling that I could take a punt on ARC rebounding from the bottom.
post-image
ARGUS+16.73%
Smart money is quietly stacking ONDO while the 1h RSI screams oversold.

$ONDO /USDT - LONG

Trade Plan:
Entry: 0.4135 – 0.4181
SL: 0.3936
TP1: 0.4324
TP2: 0.4435
TP3: 0.4602

Why this setup?
Why now? The daily trend is bullish and the 1h price sits at the entry reference of 0.4158, placing us right at the optimal entry zone between 0.4135 and 0.4181. The 15m RSI at 33.3 confirms a deep oversold bounce is overdue within this trend structure. With the 1h ATR at 0.009248, a single candle holds enough volatility to carry the price from the entry toward the first target of 0.4324 and beyond to
ONDO+6.02%
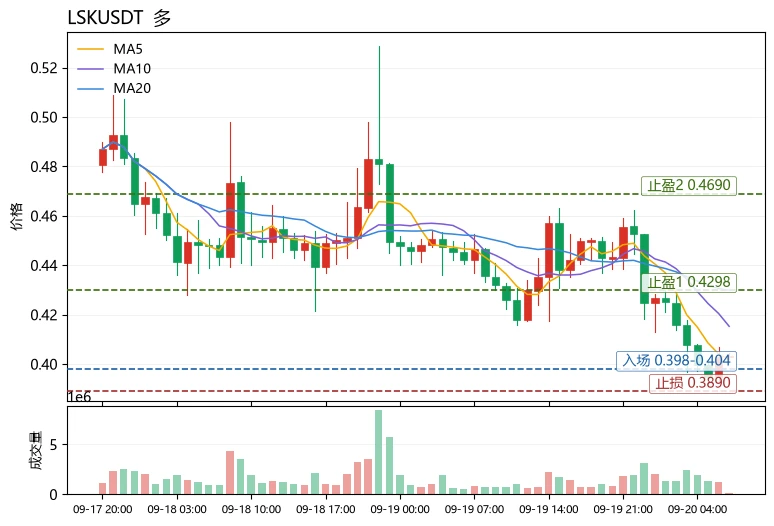
$LSK Short-term bullish, but this is a contrarian rebound play, not trend chasing.
From a funding perspective, LSK’s funding rate is -0.1138%, with shorts continuously paying to hold positions, indicating that short crowding is currently high. The price has fallen 9.37% over 24h, RSI has dropped to 36.4, approaching oversold territory, while the current price of 0.4032 remains above MA5 (0.4016). Short-term moving averages are beginning to flatten, signaling a potential bottom after the sharp decline. The MACD histogram remains negative, so the trend has not reversed; this can only be defined
post-image
LSK-9.17%
BCH-0.34%
PENGU+0.27%
Smart money is quietly stacking shorts on $ADA /USDT while retail chases pumps.

$ADA /USDT - SHORT

Trade Plan:
Entry: 0.2264 – 0.2278
SL: 0.2341
TP1: 0.2218
TP2: 0.2183
TP3: 0.2131

Why this setup?
Why now? The 1h price is holding at 0.2271 inside a tight range, and the 15m RSI at 45.43 shows momentum is already fading into the entry zone between 0.2264 and 0.2278. The 1h ATR of 0.002924 tells us volatility is compressed, which often precedes a sharp directional move. With the daily trend stuck in range, a break below invalidates the setup at 0.2138 and exposes TP1 at 0.2218, TP2 at 0.218
ADA+1.07%
Up 37.975% with the funding rate still negative: SKL shorts are taking a beating this round
Damn, $SKL pumped 37.975% in one day, with volume reaching 10.052 times the 30-day average—the crazy part is that the funding rate is still negative. I’m bullish here and would buy the dip on a pullback.

First, leverage hasn’t chased it. The funding rate is -0.00066861, with shorts paying to stubbornly hold on; the long-short ratio is 1.9586—a move driven by spot buying.

Second, the technicals have just turned. Daily RSI is 60.6 and not overbought, while the MACD golden cross is expanding its red
SKL+19.17%
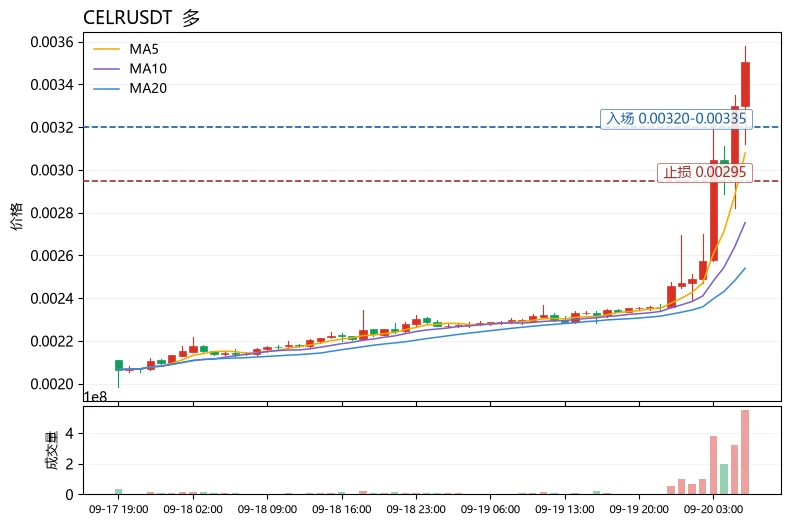
$CELR Current price 0.003503, 24h +53.10%, trading volume 5.7M USDT; Fear & Greed Index 71 (Greed), MA5=0.0030794 crossing above MA20=0.00254045, RSI=92.3 deeply overbought, MACD histogram +0.0001114 indicating continued bullish momentum, Bollinger upper band 0.00324552 has been decisively broken, 30-candle range approximately 37.48%, funding rate -0.0344% indicates shorts are still paying.
Assessment: Overall market sentiment is in the greed zone, while BTC stabilization is driving rotation into highly volatile small-cap sectors, with CELR being a strong catch-up candidate benefiting from th
post-image
CELR+52.08%
PROVE+3.73%
DASH-8.41%
Insiders are quietly pressing SHORT on $SKHYNIX /USDT before the daily range breaks.

$SKHYNIX /USDT - SHORT

Trade Plan:
Entry: 1344.77 – 1347.17
SL: 1357.45
TP1: 1337.36
TP2: 1331.62
TP3: 1323.01

Why this setup?
Why now? The 4h bias is SHORT with 55% confidence, and the 1h price is pinned at 1345.97, right inside the entry zone of 1344.77 to 1347.17. The 15m RSI is 79.37, signaling short-term exhaustion that supports a downside move, while the 1h ATR of 4.784316 shows enough volatility to reach the first target at 1337.36 and the second target at 1331.62. The daily trend is range, so thi
SKHYNIX-0.55%
𝙄𝙨 𝙏𝙝𝙞𝙨 𝙎𝙖𝙛𝙚?
I know what you’re thinking.
“Can I really trust this?”
That’s a fair question when you’re buying things online.
Malltiple says it works with trusted supermarkets and sellers, while giving customers order updates and support throughout the delivery process.
There’s also a return and refund policy for eligible orders.
So you’re not just placing an order and hoping for the best.
There’s a system behind the purchase, from the moment you order until it gets to you.
post-image
btc update
live-cover
LIVE31
Layout for Bitcoin, Ethereum, and Dogecoin
live-cover
LIVE1,232
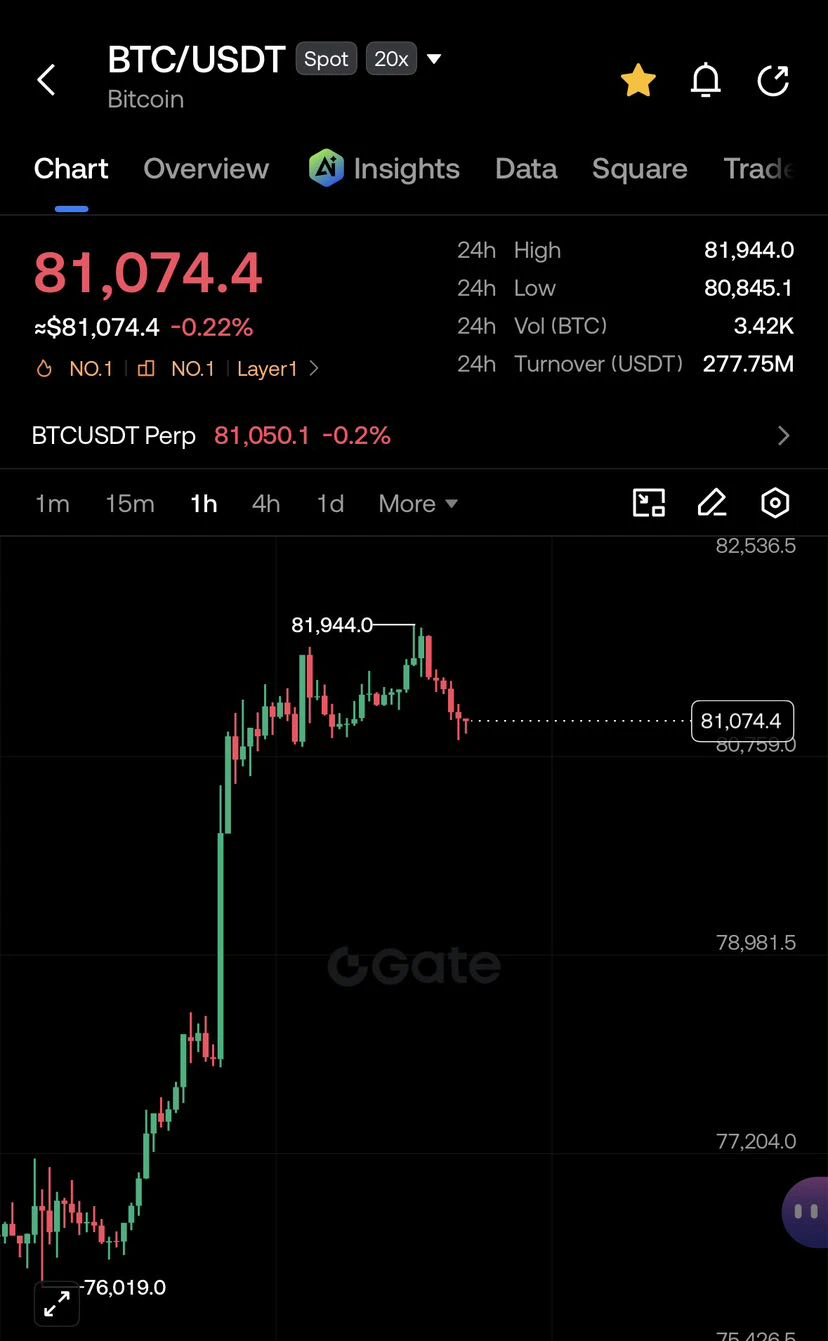
$BTC is looking interesting for a short here.
BTC got rejected from the $81,950 area, and the 15M chart is now showing a series of lower highs. Price is sitting close to $81K support, but the recovery attempts have been weak so far. I’m watching for a small bounce before another potential move lower.
Entry: $81,180–$81,350
Targets:
TP1: $80,960
TP2: $80,700
TP3: $80,400
Stop: $81,570
For me, $81,400 is the key level. As long as BTC stays below it, I’m watching for continuation lower. A clean reclaim above $81,570 would invalidate the short idea.
#BOJHikesTo1.25%31YearHigh #GateTopsStockPerpet
post-image
BTC+0.14%
  • 5
  • 1
Watching the market until I got annoyed, I actually saw things more clearly after turning it off; once my eyes stopped staring at it, my heart stopped panicking too.

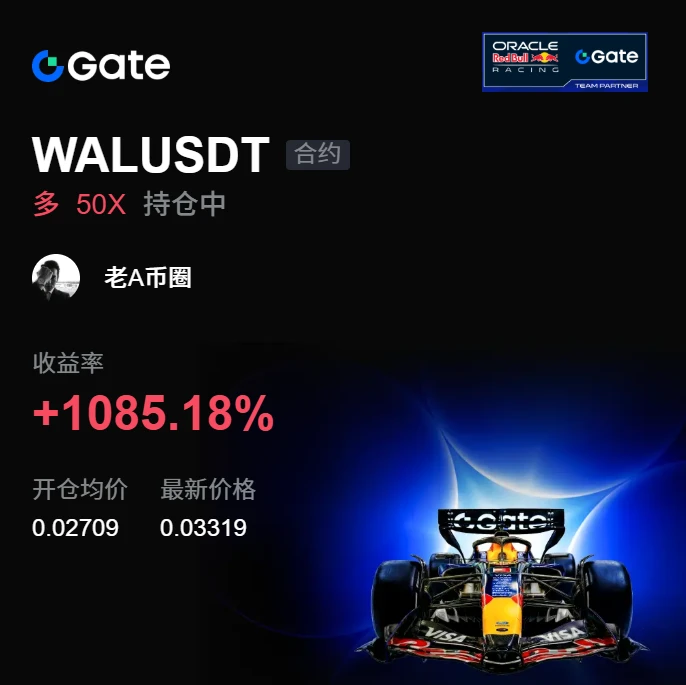
A few days ago, I glanced at $WAL before bed. WAL buying pressure was strengthening and funds were quietly entering. I only gave one reminder at the time: don’t chase; follow after a pullback.

From 0.02709 to 0.03319, an unrealized gain of +1085.18%—feels amazing. Those already on board should have laughed themselves awake.

Put the bulk into my pocket first, cut 70%, and leave 30% set at the cost basis. The market specialize
post-image
WAL+8.01%
BTC+0.16%
ADA+1.07%
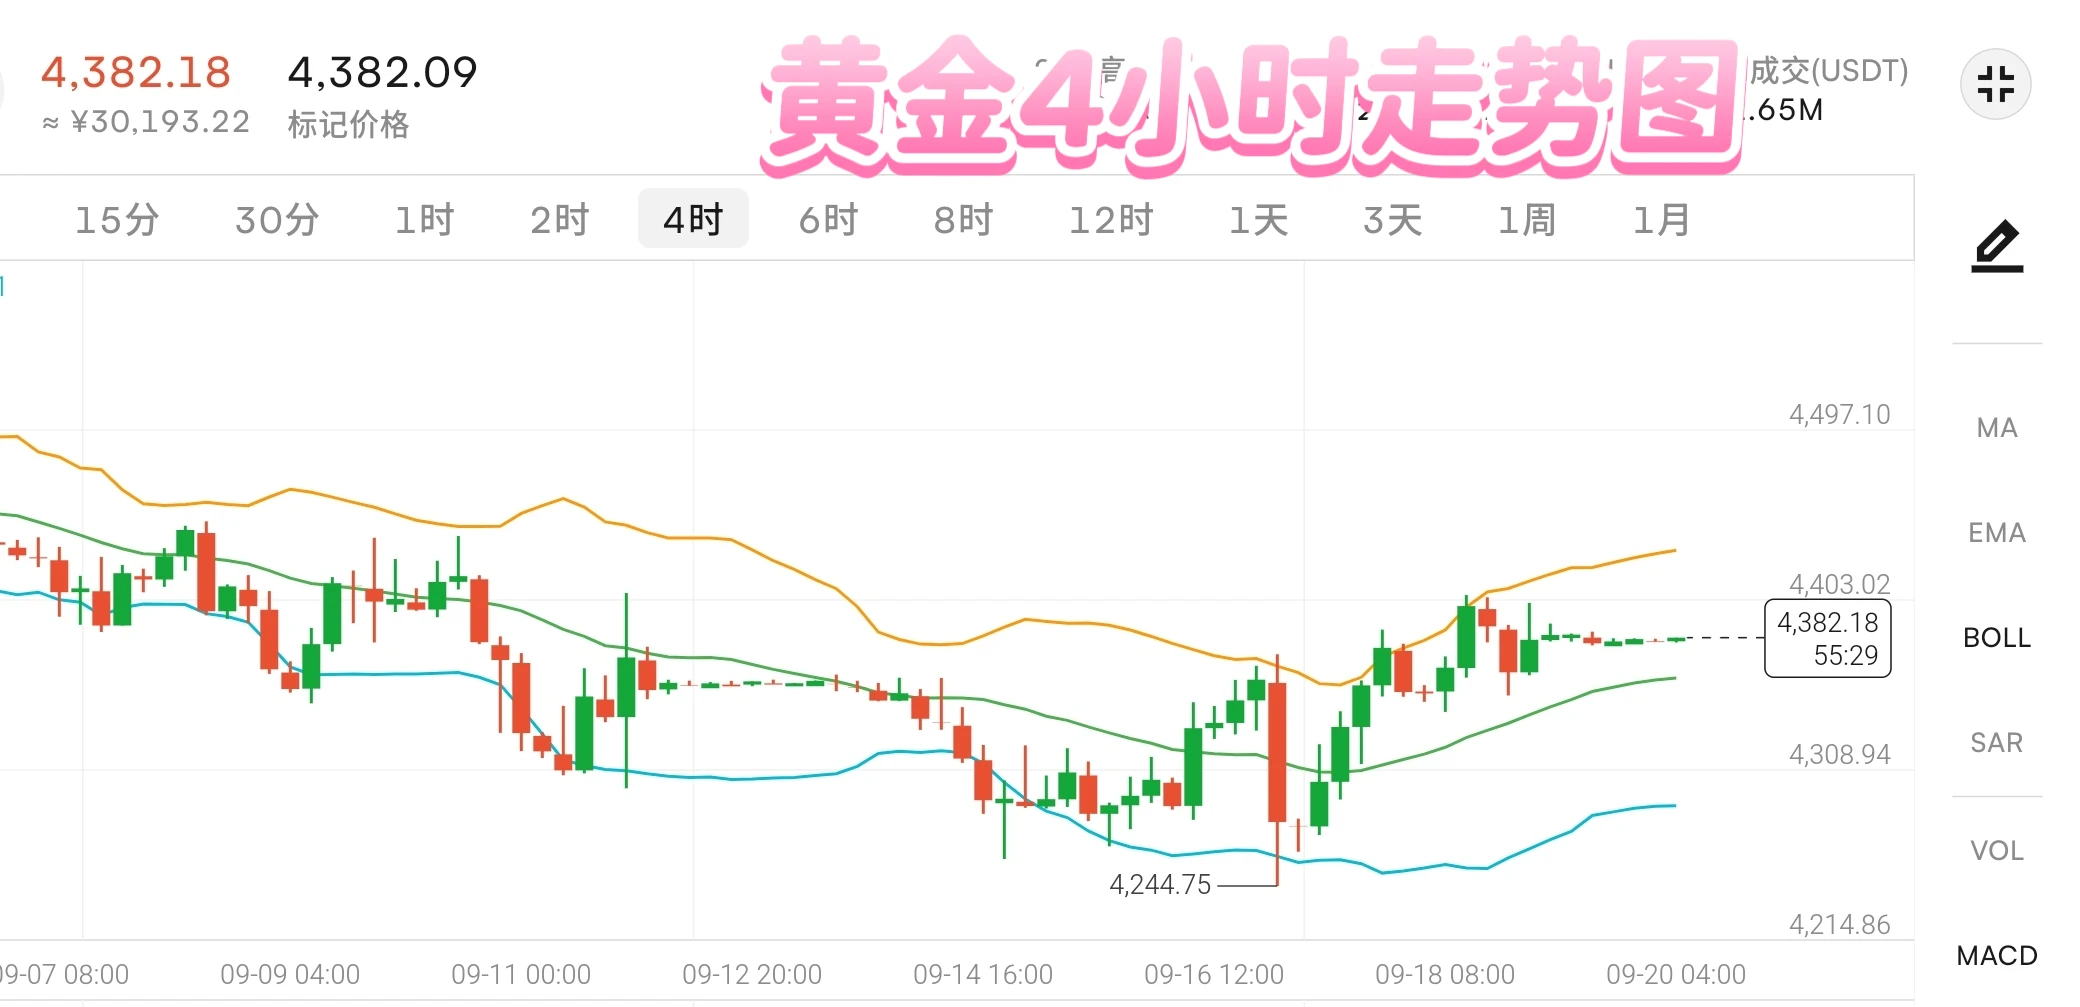
Gold posted a clear decline-then-rebound pattern this week.
  At the beginning of the week, the market priced in expectations of a Federal Reserve rate hike ahead of time, putting gold under continued pressure. Gold fell to around 4279 on Tuesday. After the Fed raised rates by 25 basis points on Wednesday, gold prices dipped further to around 4262, but did not form a sustained breakdown.
  As crude oil prices fell, the dollar weakened, and U.S. Treasury yields declined on Thursday and Friday, gold rebounded rapidly, reaching a high near 4400 before stabilizing around 4378 and ending its previo
post-image
XAU-0.12%
Volume reached 3.36x the monthly average—is this INJ being lifted by market makers or the start of a relay?
$INJ It surged 21% in a day, with volume reaching 3.36x the monthly average—my palms are sweating.

Now at 7.965, with its 30-day range position at 0.981, flying right against the ceiling.

I’m bullish here but won’t chase—hold if it retests and stays above 7.03; exit if it breaks below.

First, the volume-price action isn’t fabricated: the volume ratio is 3.364x, while the funding rate is only 0.0001, so leverage hasn’t entered the picture; second, OI is up 14.62% from yesterday’s re
INJ+24.48%
Smart money is quietly stacking ETH at these exact levels while retail panics.

$ETH /USDT - LONG

Trade Plan:
Entry: 2618.70 – 2626.78
SL: 2583.92
TP1: 2651.85
TP2: 2671.26
TP3: 2700.38

Why this setup?
Why now? The 1h price is sitting at 2622.74, right inside a tight entry zone between 2618.70 and 2626.78, giving us a precise fill. The 15m RSI is 38.48, showing the asset is approaching oversold territory on the short term, which often precedes a bounce. The 1h ATR is 16.17, meaning this move has real volatility behind it and the targets are reachable. We are looking to ride the bullish da
ETH+0.60%
This move surged from around 2480 all the way to 2672, setting sentiment ablaze,
but it has clearly started to lose steam after the spike.
Now around 2631, the price is stuck below the Bollinger midline at 2638,
with 2652 as the first resistance above and 2672 as strong resistance at the previous high.
I’m not in a rush to chase longs.
2623 is the key defense line. As long as it holds, a pullback looks more like a shakeout,
and only a reclaim of 2638 would create an opportunity to continue toward 2652 or even 2672.
But if 2623 breaks on heavy volume, don’t stubbornly hold on; focus on 2610 and
ETH+0.60%
Load More

Join 40 M users in our growing community

⚡️ Join 40 M users in the crypto craze discussion

💬 Engage with your favorite top creators

👍 See what interests you

Trending Topics

JapanRealEstatePowerChipStocksRise

59.8k Views4.55k Discussing

Japan's Nikkei extended gains on Sept 18, with real estate, power, and semiconductor sectors leading. Gate covers over 12,800 global stocks and ETFs, offering one-stop USDT trading across US, HK, Korean, and Japanese markets. [👉 Read more](https://www.odaily.news/en/newsflash/518749)

USAIConceptStocksRally

34.5k Views1.01k Discussing

GateTopsStockPerpetualCoverage

38.9k Views2.61k Discussing

View More