Share your thoughts
placeholder
Article
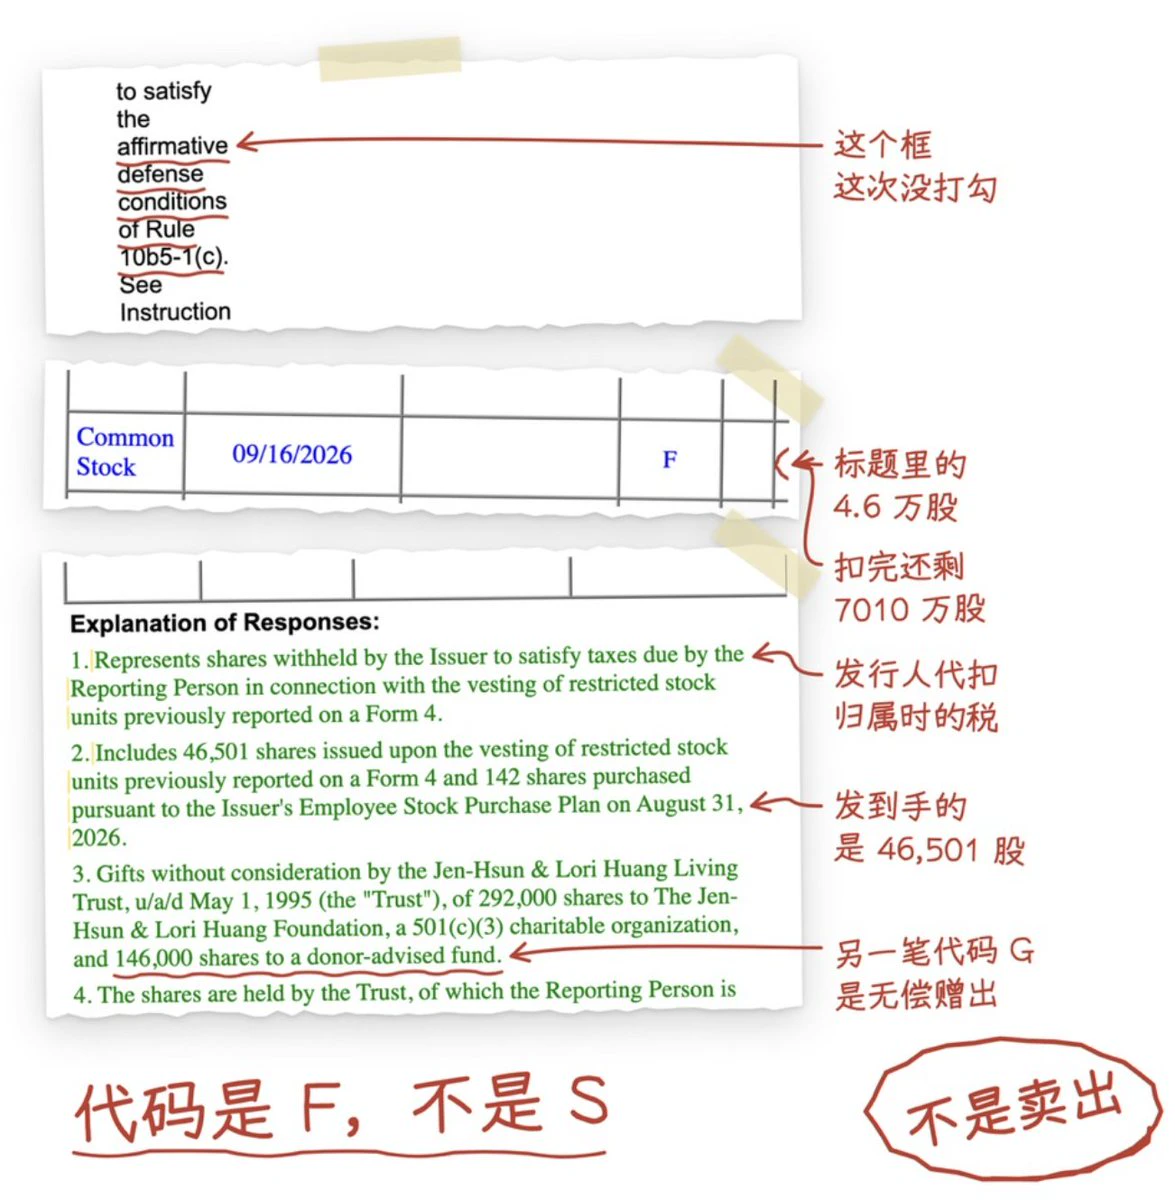
Some people saw that Jensen Huang had just sold 46,000 Nvidia shares at approximately $212 per share and got a little nervous.
The original filing for this transaction was a Form 4 filed with the U.S. Securities and Exchange Commission on September 18. On the first page, Table I, the transaction code in the third column is F, not S.
The codes on Form 4 have fixed meanings.
S means a sale on the open market, P means a purchase, A means a company grant, M means an option exercise, G means a gift, and F means using shares to pay the exercise price or taxes.
Footnote 1 states that the issuer withh
post-image
NVDA+1.23%
I’ve been livestreaming on this platform for almost two years, and I’ve been here all along. I’m Feiyang, also known as the Bull Demon King, and I’ve been doing very well. I’ve seen many people get liquidated, and there are also many long-time followers. Only a few have made it this far, because they couldn’t control themselves and liked high-frequency trading. In trading, you need to avoid rushing into positions and avoid panicking while holding them. Veterans die from overleveraging, while beginners die from high-frequency trading. There are too many “leeks” in this market, and many refuse t
  • 2
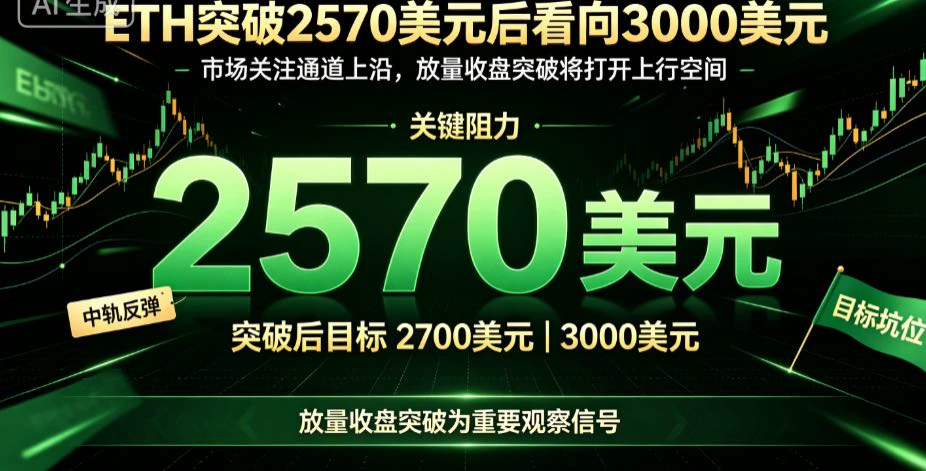
The market is now focusing on whether ETH can rebound to the middle line and further test the upper boundary of the channel near $2,570. If ETH closes above $2,570 on increased volume, it may signal a further breakout, with upside targets of $2,700 and even $3,000.
post-image
ETH+6.05%
$AR is slowly weakening and showing false momentum
Short-term $AR entry: 4.15 – 4.35 Stop-loss: 4.75 Take-profit 1: 3.95 Take-profit 2: 3.80 Take-profit 3: 3.60 Take-profit 4: 3.35 Trade $AR here 👇
post-image
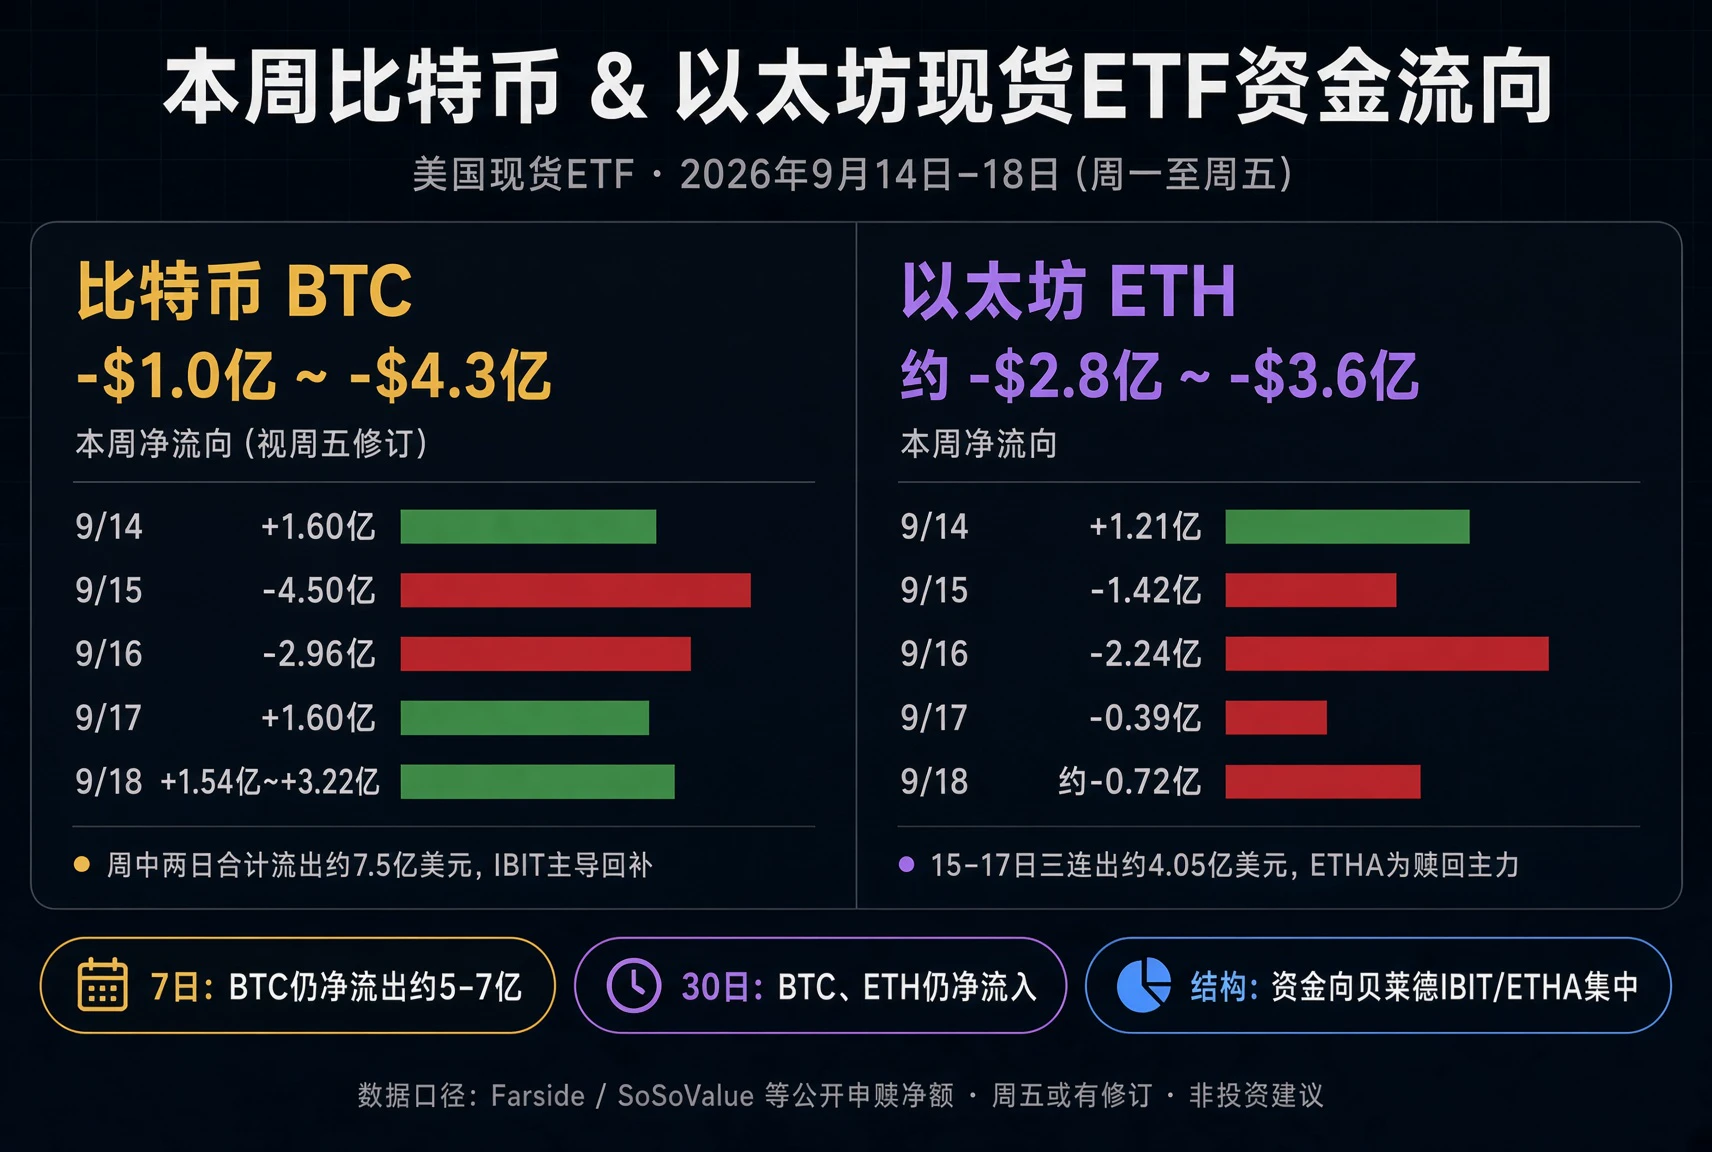
U.S. spot ETFs this week: BTC outflows followed by inflows, ETH sees consecutive redemptions (9/14–9/18)
BTC
· 15th: -$450 million; 16th: -$296 million, with approximately $750 million flowing out over the two days
· 17th: +$160 million; inflows resumed on the 18th (depending on methodology, +$154 million to +$322 million)
· Still saw net outflows for the week; approximately -$500 million to -$700 million on a 7-day basis
ETH
· +$121 million on Monday, followed by consecutive outflows
· Three consecutive outflow days from the 15th to 17th totaling approximately $405 million, followed by anothe
post-image
ETH+6.05%
BTC+4.95%
JUST IN: Meta launches SAM 3.1 API, enabling multi-target visual segmentation (up to 16 targets in one pass) with faster processing on multi-target videos. $META
post-image
META-2.53%
Back then, $1 could buy 1 BTC
Now, $0.08 can buy 1 PI
That opportunity was missed
Will this opportunity be missed too?
$PI
PI+3.63%
JUST IN: Garrett Jin’s ZEC short unrealized loss sits at $33.83M with a liquidation price near $4,790, per TradingBeats. If the market tests that level, risk-on for altcoins could emerge as shorts cover. $ZEC
post-image
ZEC+2.80%
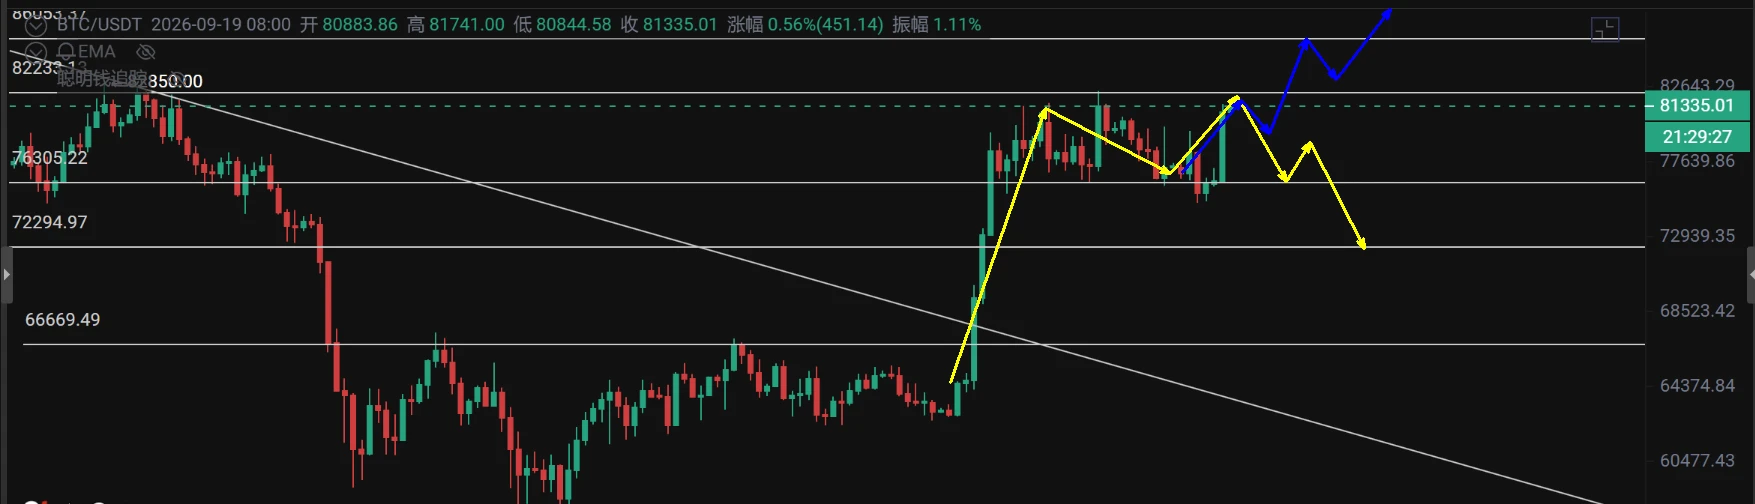
September 19 $BTC Market Analysis
Yesterday, it briefly surged to around 81,700, reaching the upper boundary of the range. It is now facing a critical point between the bulls and bears.
If the fast and slow lines of the weekly MACD cross above the zero axis next, a weekly rebound will truly be underway. They are currently hovering around the zero axis.
The current focus is on the daily chart: whether this rebound is merely a spike or a breakout. If it is a breakout, pay close attention to whether the 82,300 level can be firmly reclaimed. If it cannot hold, watch for a daily-chart pullback. If
post-image
ETH+6.05%
BTC+4.95%
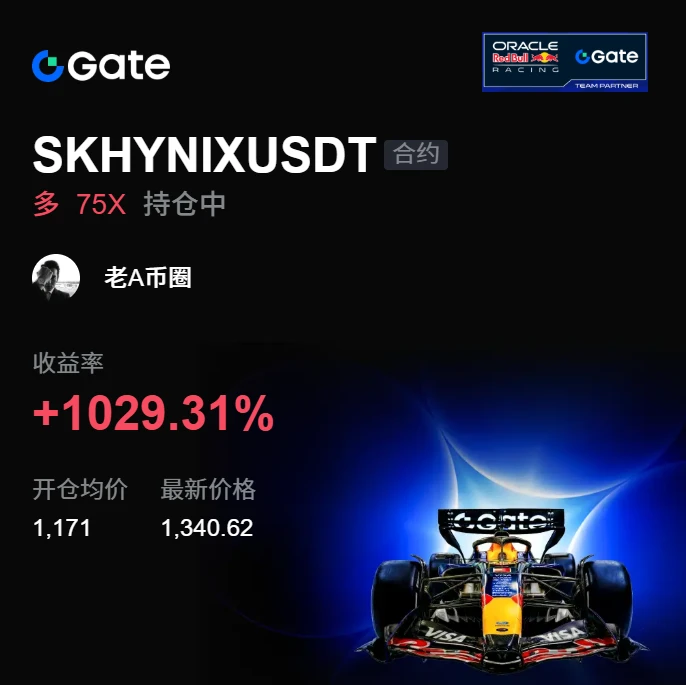
Watching the chart nonstop got annoying; turning it off actually made things clearer. Once my eyes stopped staring at it, my mind stopped panicking too. During the bottoming process, $SKHYNIX kept swinging back and forth. I saw it hold after the pullback and buying pressure strengthen, so I signaled a long position. As long as it stays above 1171.00, there’s a chance.

Then it took off directly, reaching 1340.73, with +1029.61% right before our eyes. Feels great, brothers—the profits are satisfying.

Hold as long as the trend remains intact; run if it breaks down. Don’t fall in love with a
post-image
SKHYNIX+0.80%
SNDK+9.61%
BTC+4.97%
Historically, after BTC holds above the 365D SMA, it often continues to rally,
Latest 365D SMA: $80741
If it remains above the 365D SMA over the next two days, the probability of a continued rally will be very high.
Some slightly stronger ones, such as $SOL , have already started moving ahead. Therefore, any pullback from here will be an opportunity to enter $BTC ‌ ‌
SOL+9.05%
BTC+4.95%
September 19 BTC/ETH Mi Shen Strategy
Yesterday's major long attack was quite impressive. Altcoins led the charge, while most major coins also rose on heavy volume, providing the best response to the earlier negative catalysts—the failure of the CLARITY Act and the rate hike—having materialized. Mi Shen had previously hoped for a “deep dip to release supply,” but that did not happen; the market went straight into a recovery. A failed forecast must be respected, and one must not trade against the market, or only end up battered and bruised. Fortunately, all of Mi Shen's price-level charts were
BTC+4.97%
The aggressive pullback from the local high, combined with strong candlestick bodies, provided a clear technical window to go long on $MYX .
This move successfully delivered a 44% return, as momentum remained stable above the breakout level. Those who managed to catch this specific trend are truly impressive. Hot names: $AK : Current price 0.042363 - 24-hour change: +98.93%
$SO : Current price 113.69 - 24-hour change: +10.79%.
post-image
MYX+45.19%
Financial News, Crypto Market Updates, Real-World Strategies
live-cover
LIVE912
Up 11% in a single day! $SNDK surged to 1780—chasing the rally is just giving your money away.
Brothers, if you sold at a loss at 1500, you can turn off the screen and have a cigarette now.
The US stock storage sector exploded across the board, with SanDisk up 10.99%, Micron up 3.92%, and SK Hynix up 2.46%. AI storage demand, combined with tight supply, is driving a flood of capital into this sector.
Looking at the candlestick chart: 1778 is hugging the Bollinger upper band at 1854; the MACD has formed a death cross, but the green bars are shortening. The RSI is overbought in the short term,
post-image
SNDK+9.61%
Financial News, Crypto Market Updates, Real-World Strategies
live-cover
LIVE701
$AKE Doubled in a single day, but the upper wick at 0.0484 is today’s most critical technical signal. Currently at 0.0421, with a 128% 24h range and 474 million in trading volume—this level of volume is not something retail traders can generate.
Looking at the candlestick structure: it started from the 0.0212 low and rose straight to 0.0484, a typical vertical rally. The issue is that clear selling pressure emerged near 0.0484, with the upper wick approaching 15% of the gain, indicating that some funds were taking profits near the top. The price has now pulled back to 0.0421, near the 0.618 re
AKE+98.46%
$SNDK #美国众院推动比特币储备立法 It currently feels like any pullback could be a long opportunity. Set your stop losses—you can enter now!!!
post-image
SNDK+11.05%
BTC+4.95%
A little-known fact:
hyperliquid:native will surpass coin:native with another 15-point rise.
post-image
HYPE+8.50%
Load More

Join 40 M users in our growing community

⚡️ Join 40 M users in the crypto craze discussion

💬 Engage with your favorite top creators

👍 See what interests you

Trending Topics

JapanRealEstatePowerChipStocksRise

58.97k Views3.88k Discussing

Japan's Nikkei extended gains on Sept 18, with real estate, power, and semiconductor sectors leading. Gate covers over 12,800 global stocks and ETFs, offering one-stop USDT trading across US, HK, Korean, and Japanese markets. [👉 Read more](https://www.odaily.news/en/newsflash/518749)

USAIConceptStocksRally

33.72k Views658 Discussing

GateTopsStockPerpetualCoverage

37.87k Views2.39k Discussing

View More