Share crypto content and earn up to 60% commissions through content mining.
placeholder
gatefun
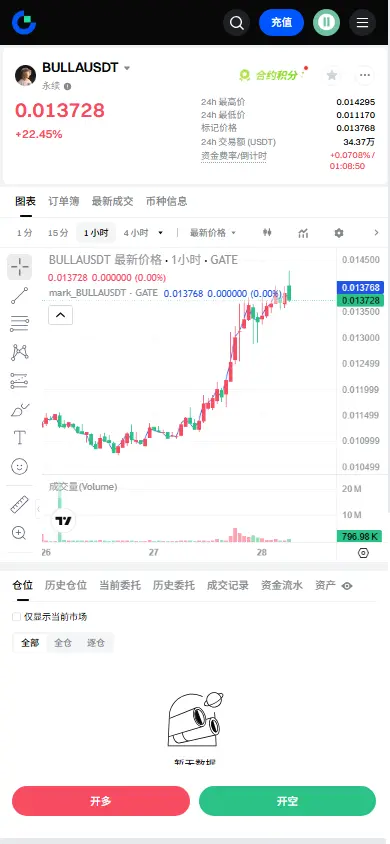
$BULLA Signal】Went long, broke out after 1H adjustment
$BULLA RSI 73 is in the overbought zone; the 1H MACD histogram narrows, and the 4H Bollinger upper band at 0.0136 faces pressure. The depth ratio is 0.77, with sell orders clustered; however, the intention to support buy orders around 0.01368 is clear. The funding rate at 0.07% is neutral, and OI shows no abnormality. The current price is ranging to digest sell pressure; within the order-placed range, staging entries have a sufficient margin of safety.
🎯Direction: Go long
⚡Entry/Placed orders: 0.0136788 - 0.0137200
🛑Stop loss: 0.01358
BULLA23.31%
BTC-2.47%
ETH-3.19%
SOL-3.38%
View Original
post-image
  • Reward
  • Comment
  • Repost
  • Share
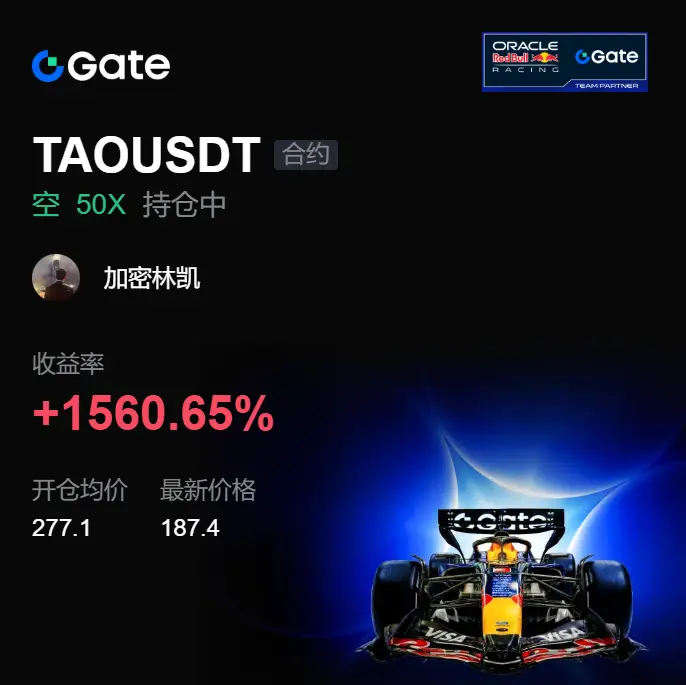
When I first set my sights on this short position, the market was still creating a strong impression; several consecutive pump moves made people hesitate to place an order. Back then, I didn’t rush to catch the falling knife, and I didn’t jump in just because I saw a single bearish candle. Instead, I waited for the price to keep probing repeatedly at the high level to confirm that sell pressure above was always there.
In the pull-down from 277.1 to 187.5, what became truly clear wasn’t just how fast it fell, but that the rebounds were losing strength more and more. The feedback from my last tr
BTC-2.42%
ETH-3.12%
View Original
post-image
  • Reward
  • Comment
  • Repost
  • Share
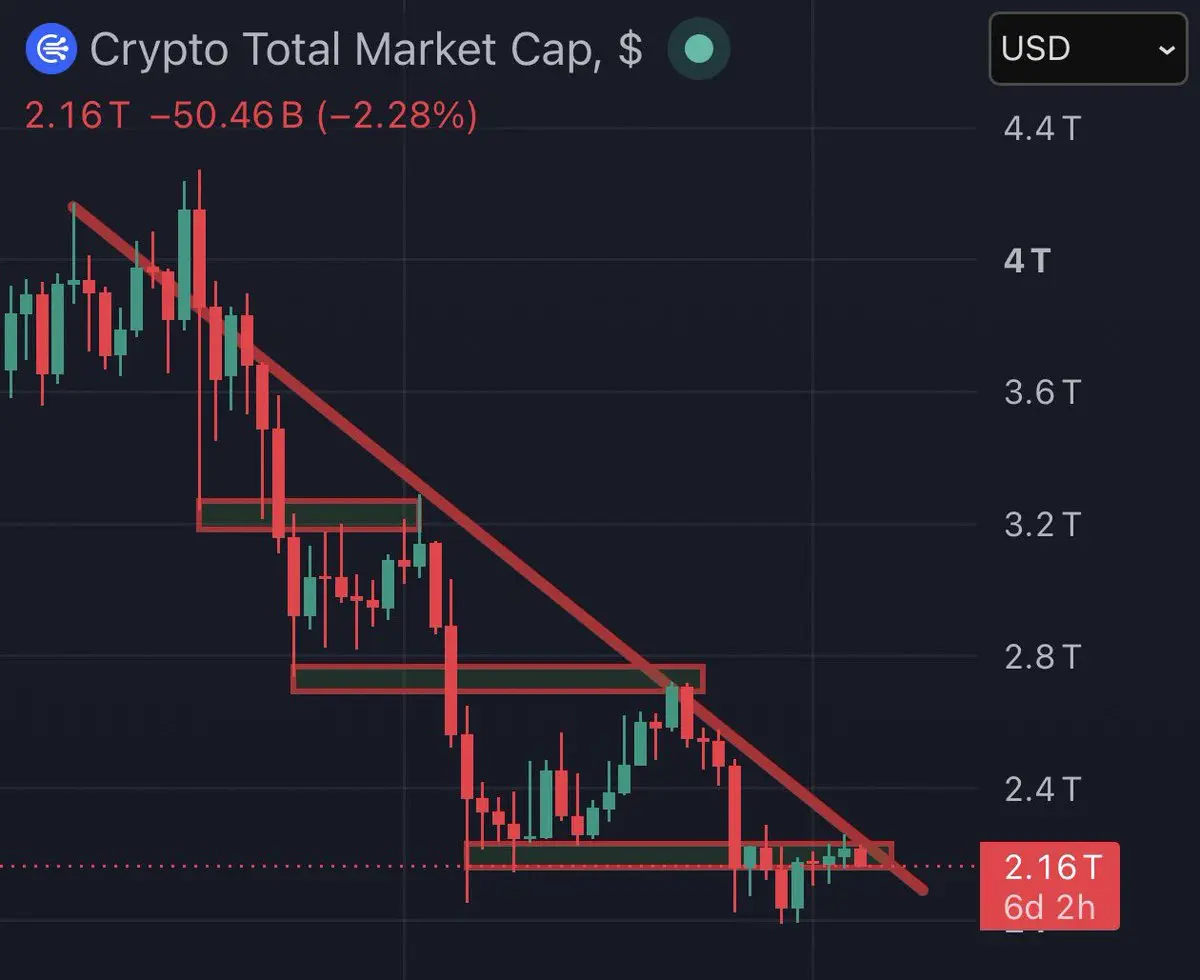
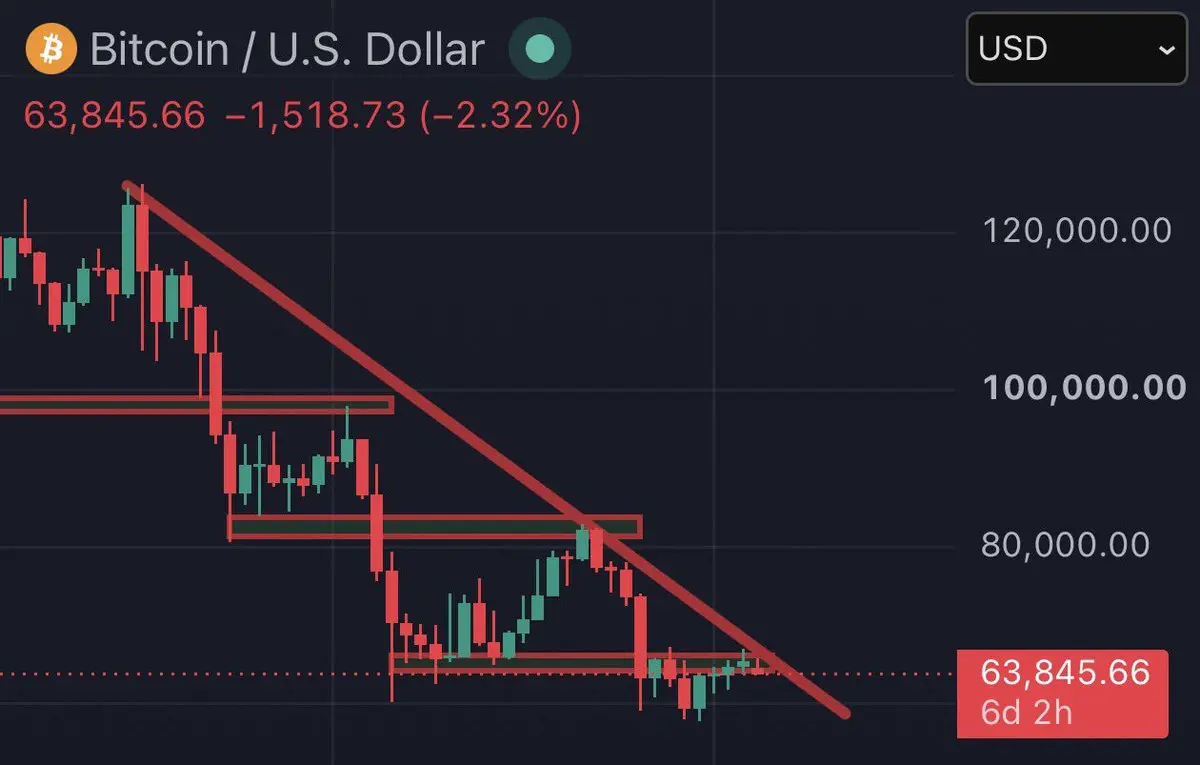
Crypto is still not bullish.
The downtrend remains intact for now.
post-image
post-image
  • Reward
  • Comment
  • Repost
  • Share
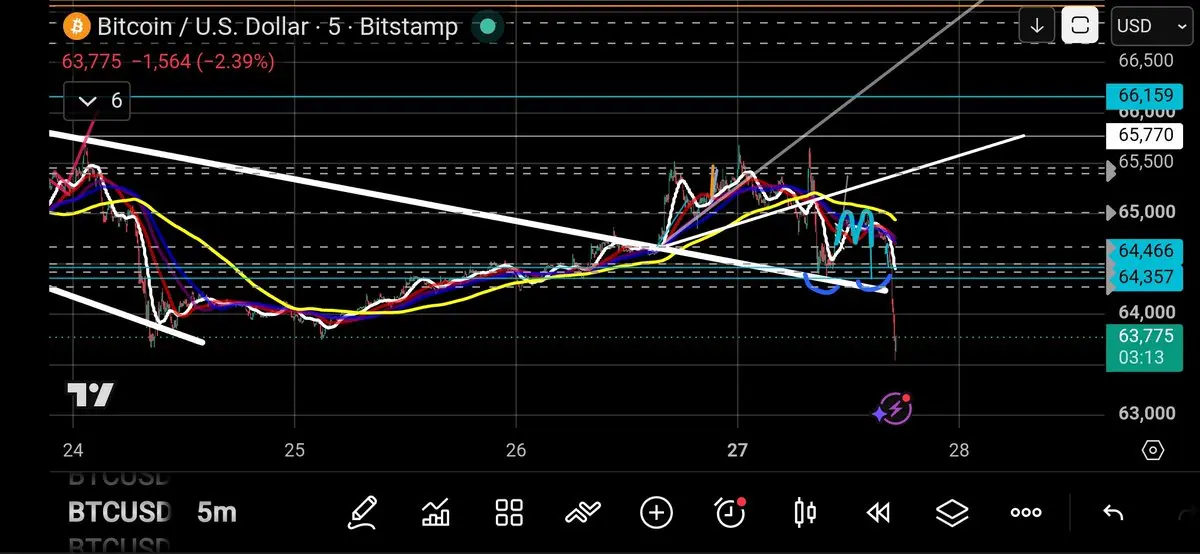
Monday Volatility ⚠️
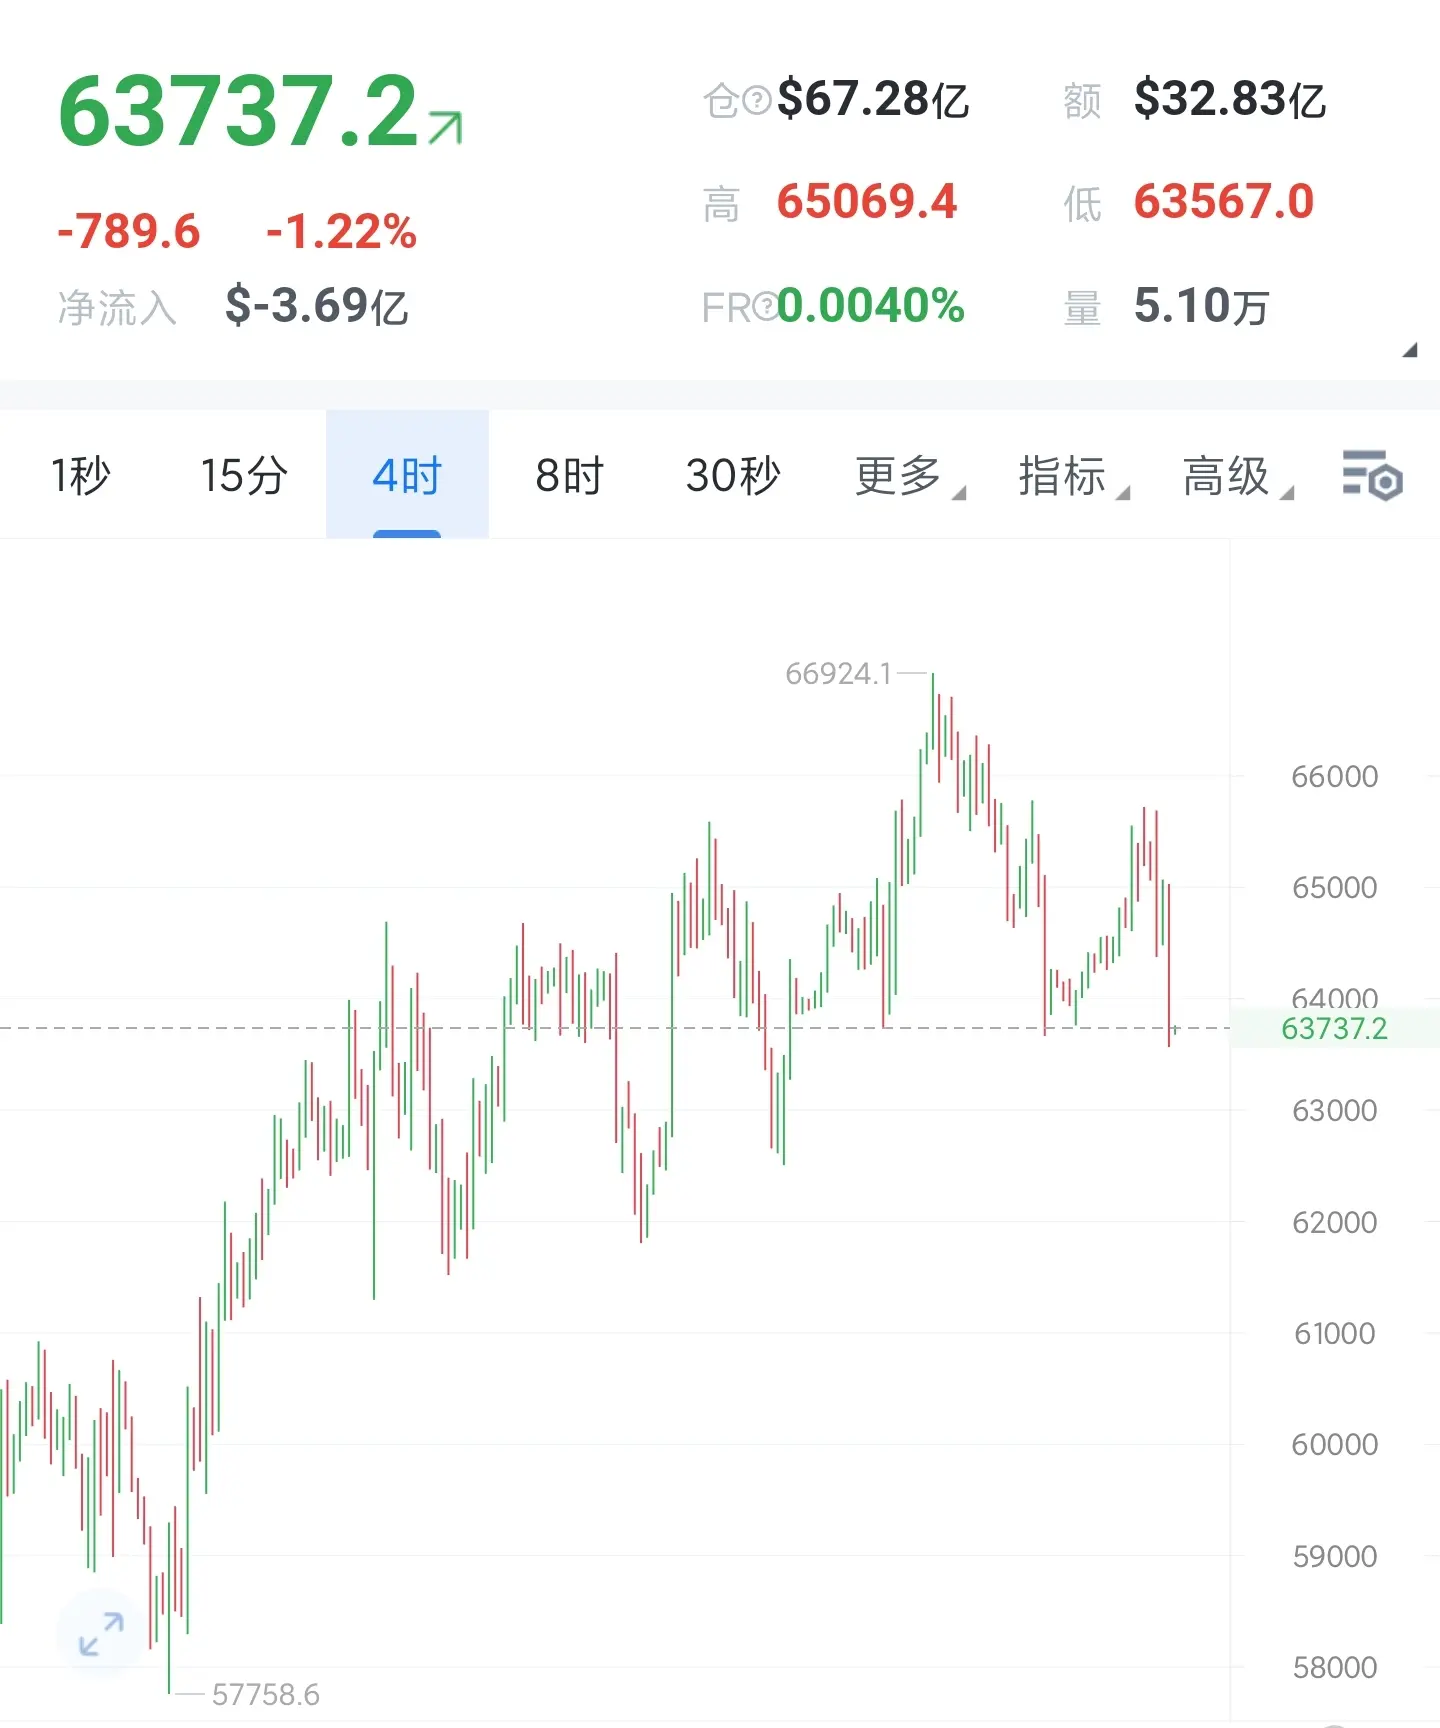
$BTC Dump 🔥
If this support is broken price will fall to test the 4hr 200MA at $63K.
However price action is far away from the 5 and 15 min 21MA's.
The retest of the yellow 200MA could be a great opportunity to put in a long.
This is hinting at consolidation and a potential reversal.
Lets wait and watch. 👀
Back to the drawing board.
NFA, DYOR ⚠️
#Crypto #Trading #BTC
BTC-2.47%
post-image
  • Reward
  • 1
  • Repost
  • Share
ybaser:
2026 GOGOGO 👊To The Moon 🌕
#DirectIPOSeason2JerseyMikes jedjdjskdkdkkddkskskdkdkdkdkdkdjdjjddnfjjffjfjdjkdskskdkdkdkdkdmfmmfnffnngnccnclsşwwğwllekffjjffjfjcjfnnfjfkdkdnfnfnccncnfknfndksksskkskdkdkdkdkdkdkk
post-image
post-image
  • Reward
  • Comment
  • Repost
  • Share
a closed-model lab just wrote the memo on open weights. anthropic, the company that has never released claude's weights, published its official position on the exact category it does not build. that framing alone is why it pulled 300 points and 357 comments on hacker news before the two hour mark. the fight is not about a product. it is about who gets to run frontier ai locally.
post-image
  • Reward
  • Comment
  • Repost
  • Share
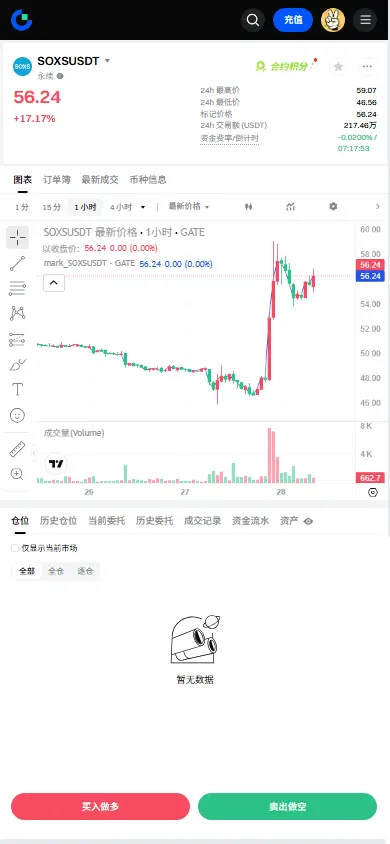
【$SOXS Signal】Negative funding rate short squeeze + 4H Bollinger upper band breakout
$SOXS After the 4H Bollinger Bands tighten, the price breaks above the middle band and tests the upper band at 56.85. Funding rate is -0.0326% and stays negative, giving long positions a clear cost advantage. The MACD 4H histogram bars are still expanding, but the 1H red bars are shortening, indicating short-term profit-taking pressure. There are relatively thick limit orders near 55.78 below, forming short-term support. Current price is 56.35, within the entry range. The risk-reward ratio is 1.5. In a negativ
View Original
post-image
  • Reward
  • Comment
  • Repost
  • Share
Stop treating missed opportunities as the end of the road or you will unwilling restart the loop you despise so much.
post-image
  • Reward
  • Comment
  • Repost
  • Share
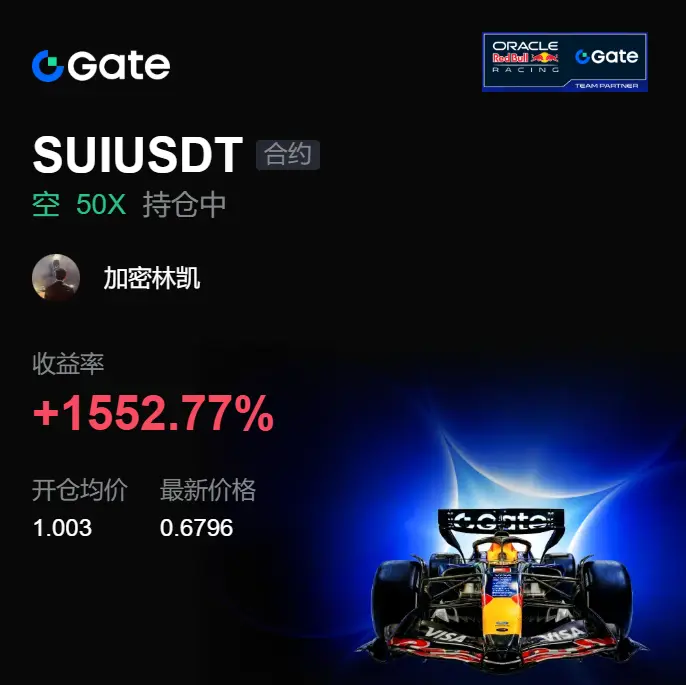
This pullback made a profit this time. Looking back, the most fortunate thing was that I wasn’t fooled by the previous fake breakout. The price repeatedly probed upward around 1.0030; it looked like it might continue to rally, but every spike back up quickly fell again. I judged that this area was more like draining the people chasing longs.

After holding the short, it wasn’t smooth sailing the whole way either. Several sharp rebounds tightened my nerves, especially that one wick. It almost made me doubt whether I’d read the chart wrong. Later, the price was pushed down to 0.6796, and the ou
BTC-2.42%
ETH-3.12%
View Original
post-image
  • Reward
  • Comment
  • Repost
  • Share
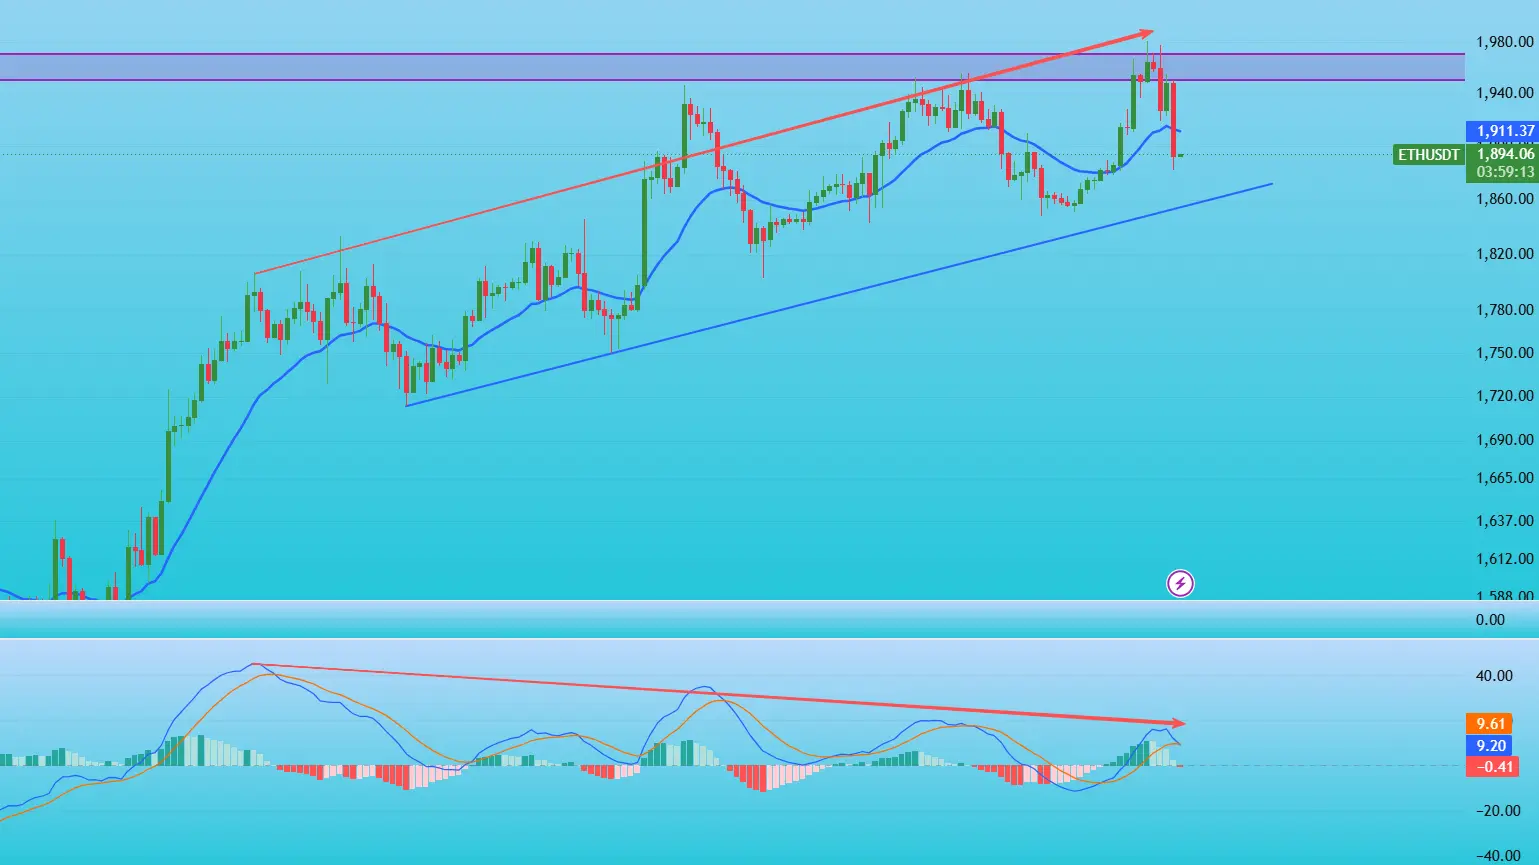
The divergence is still in place; wait for it to break below the support level, and the downside will accelerate.
Still be patient and wait. #ETH
View Original
post-image
  • Reward
  • Comment
  • Repost
  • Share
In the early morning, the market moved into a unilateral downward trend. Bearish forces dominated, price bounces were weak, and overall market sentiment remained strongly bearish; the weak short-term pattern on the chart is clear.
After the continued decline, the short-term short-selling momentum has been released in stages. Indicators have entered the oversold zone, and the market likely needs a technical rebound. At the current price level, it is near a key support area. Consider placing small long positions to gamble on a rebound and technical repair based on the support zone. Be sure to ma
View Original
post-image
  • Reward
  • Comment
  • Repost
  • Share
July 28 strategy plan priority order, fan-only
Trade priority ranking
Based on today’s market action, I would set it up like this:
Priority 1: Short 1898—1906 on a rebound
This is the strategy that best fits the current weak structure.
Ideal setup:
Short in batches from 1898—1906, stop loss above 1914, targets at 1881 / 1875 / 1865.
---
Priority 2: After breaking below 1881, short on the retest
If 1881 is broken down effectively, don’t chase the lowest; wait for the retest.
Ideal setup:
Break below 1881, retest that fails to hold the 1881—1885 zone (not going back up), short; tar
ETH-3.12%
View Original
post-image
  • Reward
  • Comment
  • Repost
  • Share
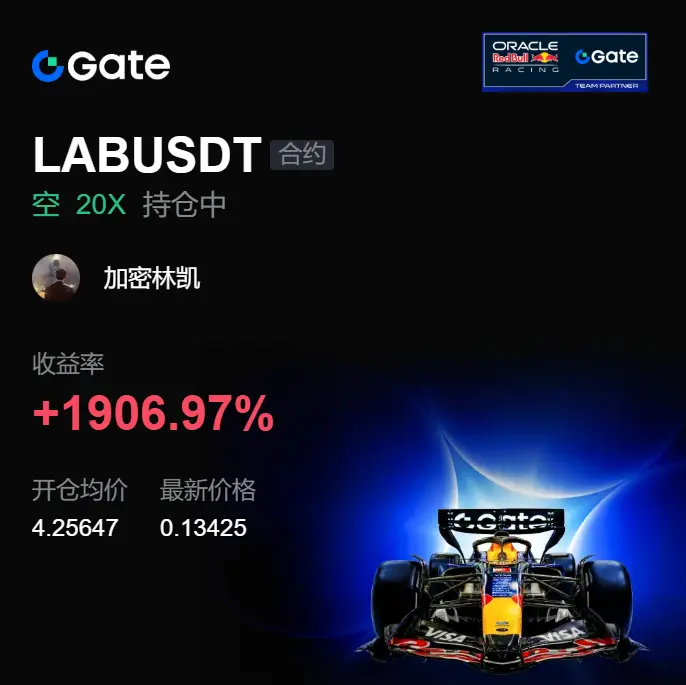
The most torturous part of this trade is that after the short side appeared, the price didn’t immediately dump—it just kept grinding back and forth at high levels. When $LAB started weakening from around 4.25647, I didn’t panic and get off after a few small rebounds. After all, what truly made me bearish was the increasingly worse sell-side support after the push up.

There was a particularly vicious spike in the middle; the short positions were repeatedly yanked around. People with itchy hands probably chased in and out already. Fortunately, the price was ultimately pulled to 0.13426, and th
LAB-7.22%
BTC-2.42%
ETH-3.12%
View Original
post-image
  • Reward
  • Comment
  • Repost
  • Share
(New Streamer)Morning Hot Market Breakdown
gate liveLIVE
463
live-coin
  • Reward
  • Comment
  • Repost
  • Share
#USPausesStrikesAfter13DaysOfBombingIran
A Fragile Calm Emerges: US Halts Iran Strikes as Diplomacy Takes Centre Stage
After nearly two weeks of continuous military operations, the United States has paused its air campaign against Iran, creating the first meaningful opportunity for diplomacy since tensions escalated. Following 13 consecutive days of bombardment, both sides have now maintained a ceasefire-like pause for three straight days, raising cautious hopes that negotiations could prevent a wider regional conflict.
US Ambassador to the United Nations Mike Waltz stated that the temporary
post-image
post-image
  • Reward
  • 1
  • Repost
  • Share
Sultan09:
2026 GOGOGO 👊
[Sport Prediction] BTC Market Updates
gate liveLIVE
2,029
live-coin
  • Reward
  • Comment
  • Repost
  • Share
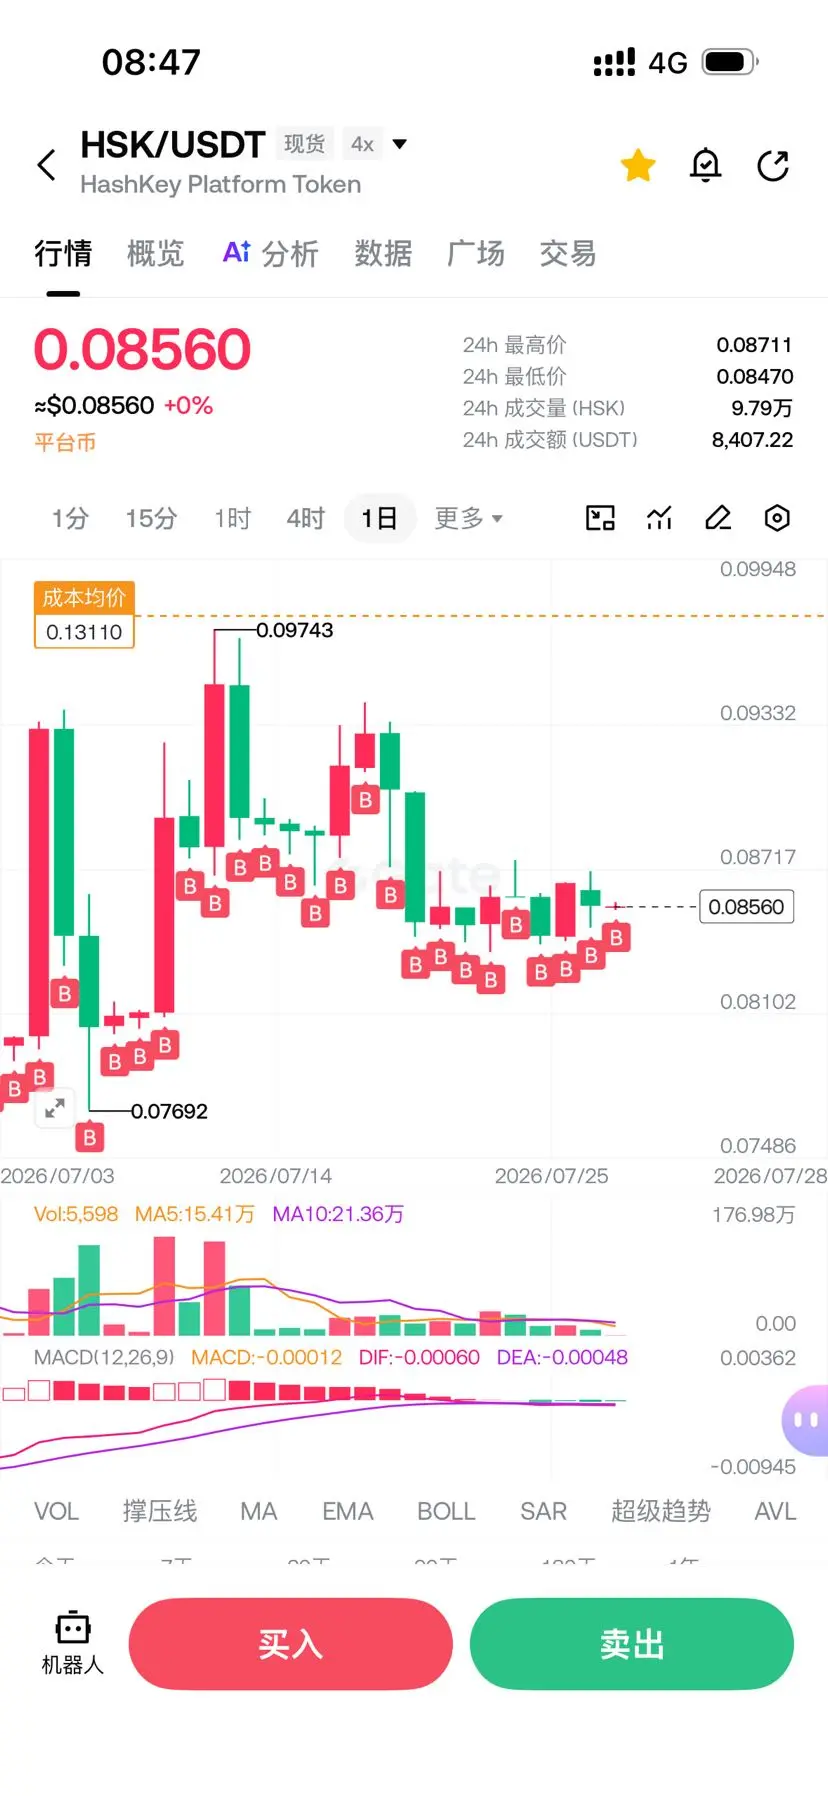
$HSK Daily post, No. 48: I didn’t feel it after buying. I’ve gotten used to it already.
HSK-0.96%
View Original
post-image
  • Reward
  • Comment
  • Repost
  • Share
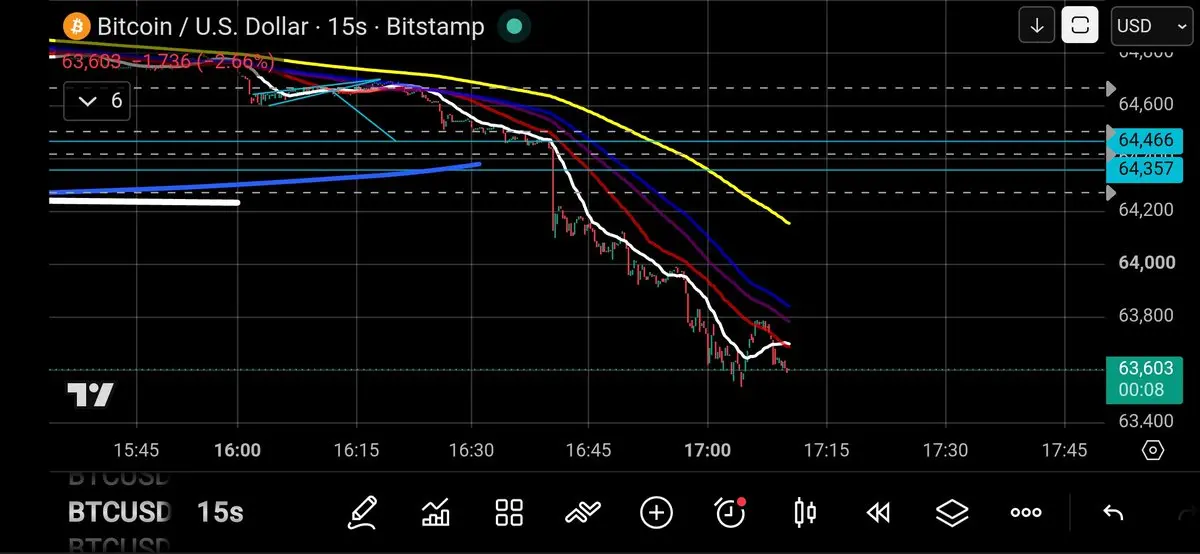
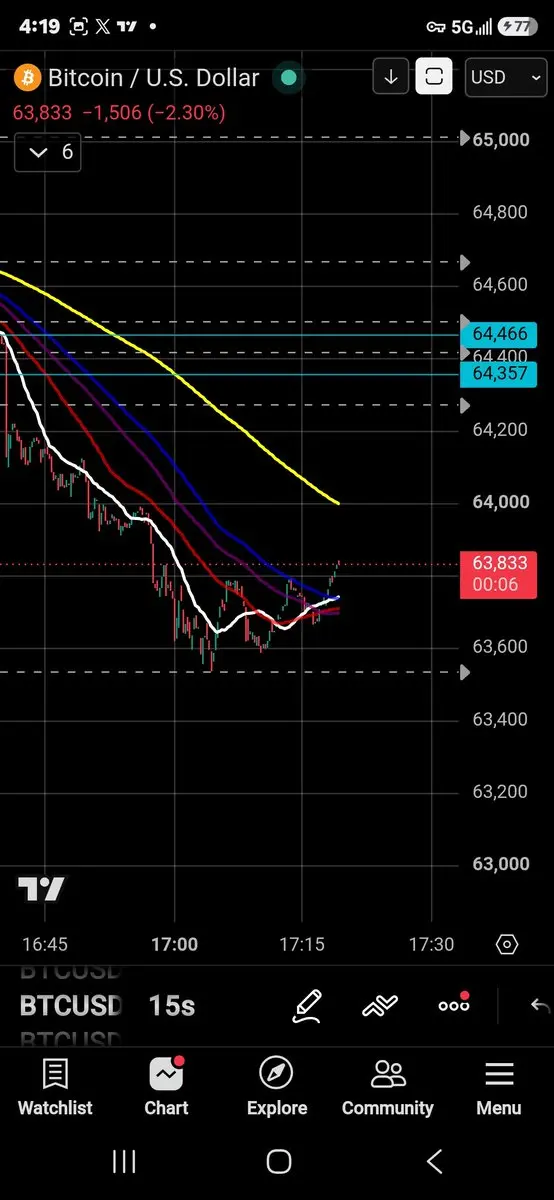
$BTC 15-Second Chart
Reversal Hunting Mode Activated 🔥
When price action starts moving FAST…
Zoom into the smaller timeframes.
That’s where the real story is hiding.
Right now we’re seeing the classic Money Printer formation forming in the moving averages.
This setup almost always appears after a sharp downside retracement…
It’s giving strong confluence that price wants to reverse back to the upside.
You want to chase this up through each timeframe. Look for that money printer.
Look closely:
Almost every moving average is stacking tightly together with price action.
Compression =
post-image
post-image
  • Reward
  • 1
  • Repost
  • Share
GateUser-0be04db9:
hjjko uib uoyc ukng yikhg yinhf yonyf yintc fcuj gijf
I’m staking all my SOXS positions—at this level of 56.39 is the best spot to set a short entry. In the past 24 hours, it surged from 45.96 to 59.61; after a violent 18% rebound, it clearly ran out of steam. The $167M trading volume shows that short-term profit-takers are fleeing aggressively. Historical pattern: for this kind of leveraged ETF rebound, the probability of a drawdown the next day is over 70%. Today, we’ll likely pull back to the 50 integer support. I’m laying it out plainly—I’m entering a short at the current price of 56.39, setting the stop loss at 59.70, and targeting the 45 ra
View Original
post-image
post-image
post-image
  • Reward
  • Comment
  • Repost
  • Share
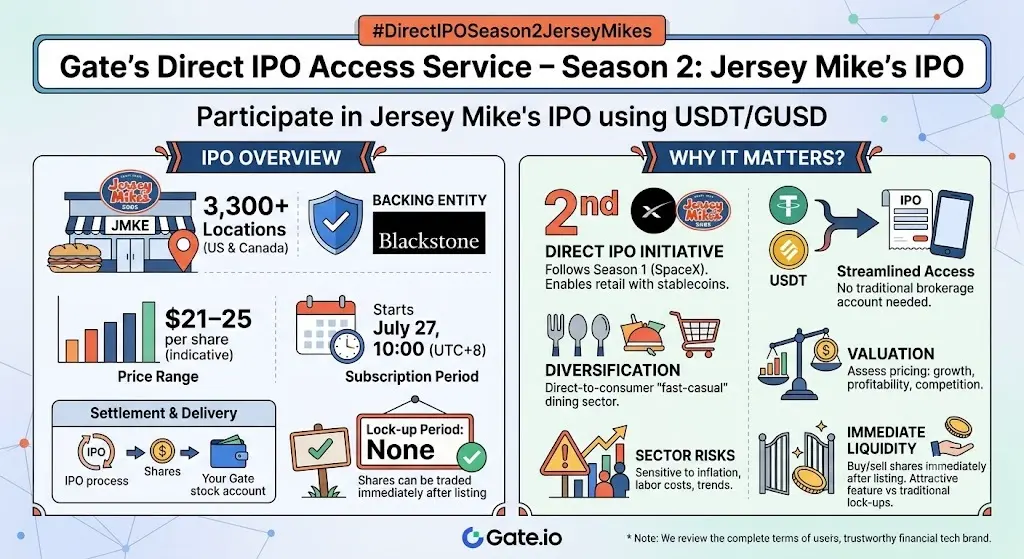
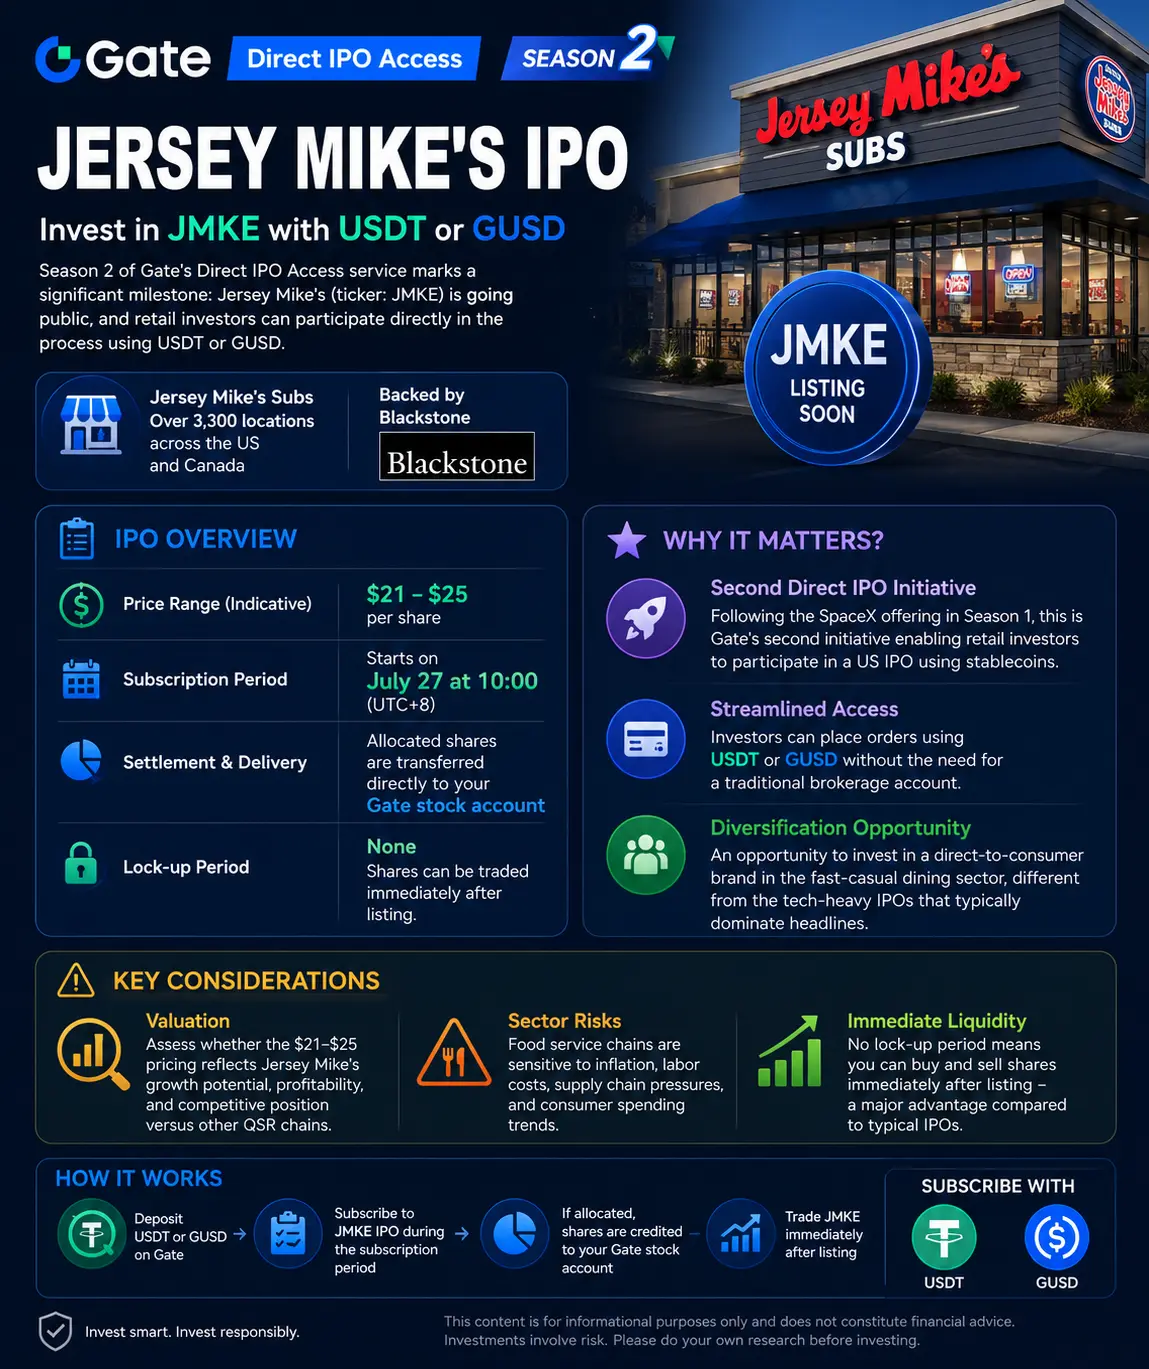
#DirectIPOSeason2JerseyMikes
Gate's Direct IPO Access Service – Season 2: Jersey Mike's IPO
Season 2 of Gate's Direct IPO Access service marks a significant milestone: Jersey Mike's (ticker: JMKE) is going public, and retail investors can participate directly in the process using USDT or GUSD.
Jersey Mike's Subs is a fast-casual sandwich chain with over 3,300 locations across the United States and Canada.
IPO Overview
Company: Jersey Mike’s Subs — Over 3,300 locations across the US and Canada.
Backing Entity: Blackstone, one of the world's largest private equity firms.
Price Range: $21–25 per
post-image
post-image
post-image
post-image
post-image
Jersey Mike's Subs IPO Closing Market Cap
$6.5B-$8B
2.27x
44%
<$6.5B
4.00x
25%
$1.34K Vol+5 more
  • Reward
  • 3
  • Repost
  • Share
ThisIsTranslateContent::
Get on board now! 🚗
View More
Load More

Join 40 M users in our growing community

⚡️ Join 40 M users in the crypto craze discussion
💬 Engage with your favorite top creators
👍 See what interests you
  • Pinned