Share crypto content and earn up to 60% commissions through content mining.
placeholder
gatefun
This short trade feels very smooth, but the process was anything but easy. When $BTC keeps grinding in the high range, the surface looks like it’s building up momentum, but in reality every attempt to surge is pushed back. This is the kind of chart pattern I’m most wary of— the more people watch for a breakout, the more easily it can turn into a reversal and a harvest.
After entering around 75,691.9, I didn’t rush to call the outcome. I first wanted to see whether it could reclaim above the key level. What truly reassured me was that after the drop, the rebound lacked strength, and the funds d
BTC-1.48%
ETH-2.90%
SOL-2.64%
View Original
post-image
  • Reward
  • Comment
  • Repost
  • Share
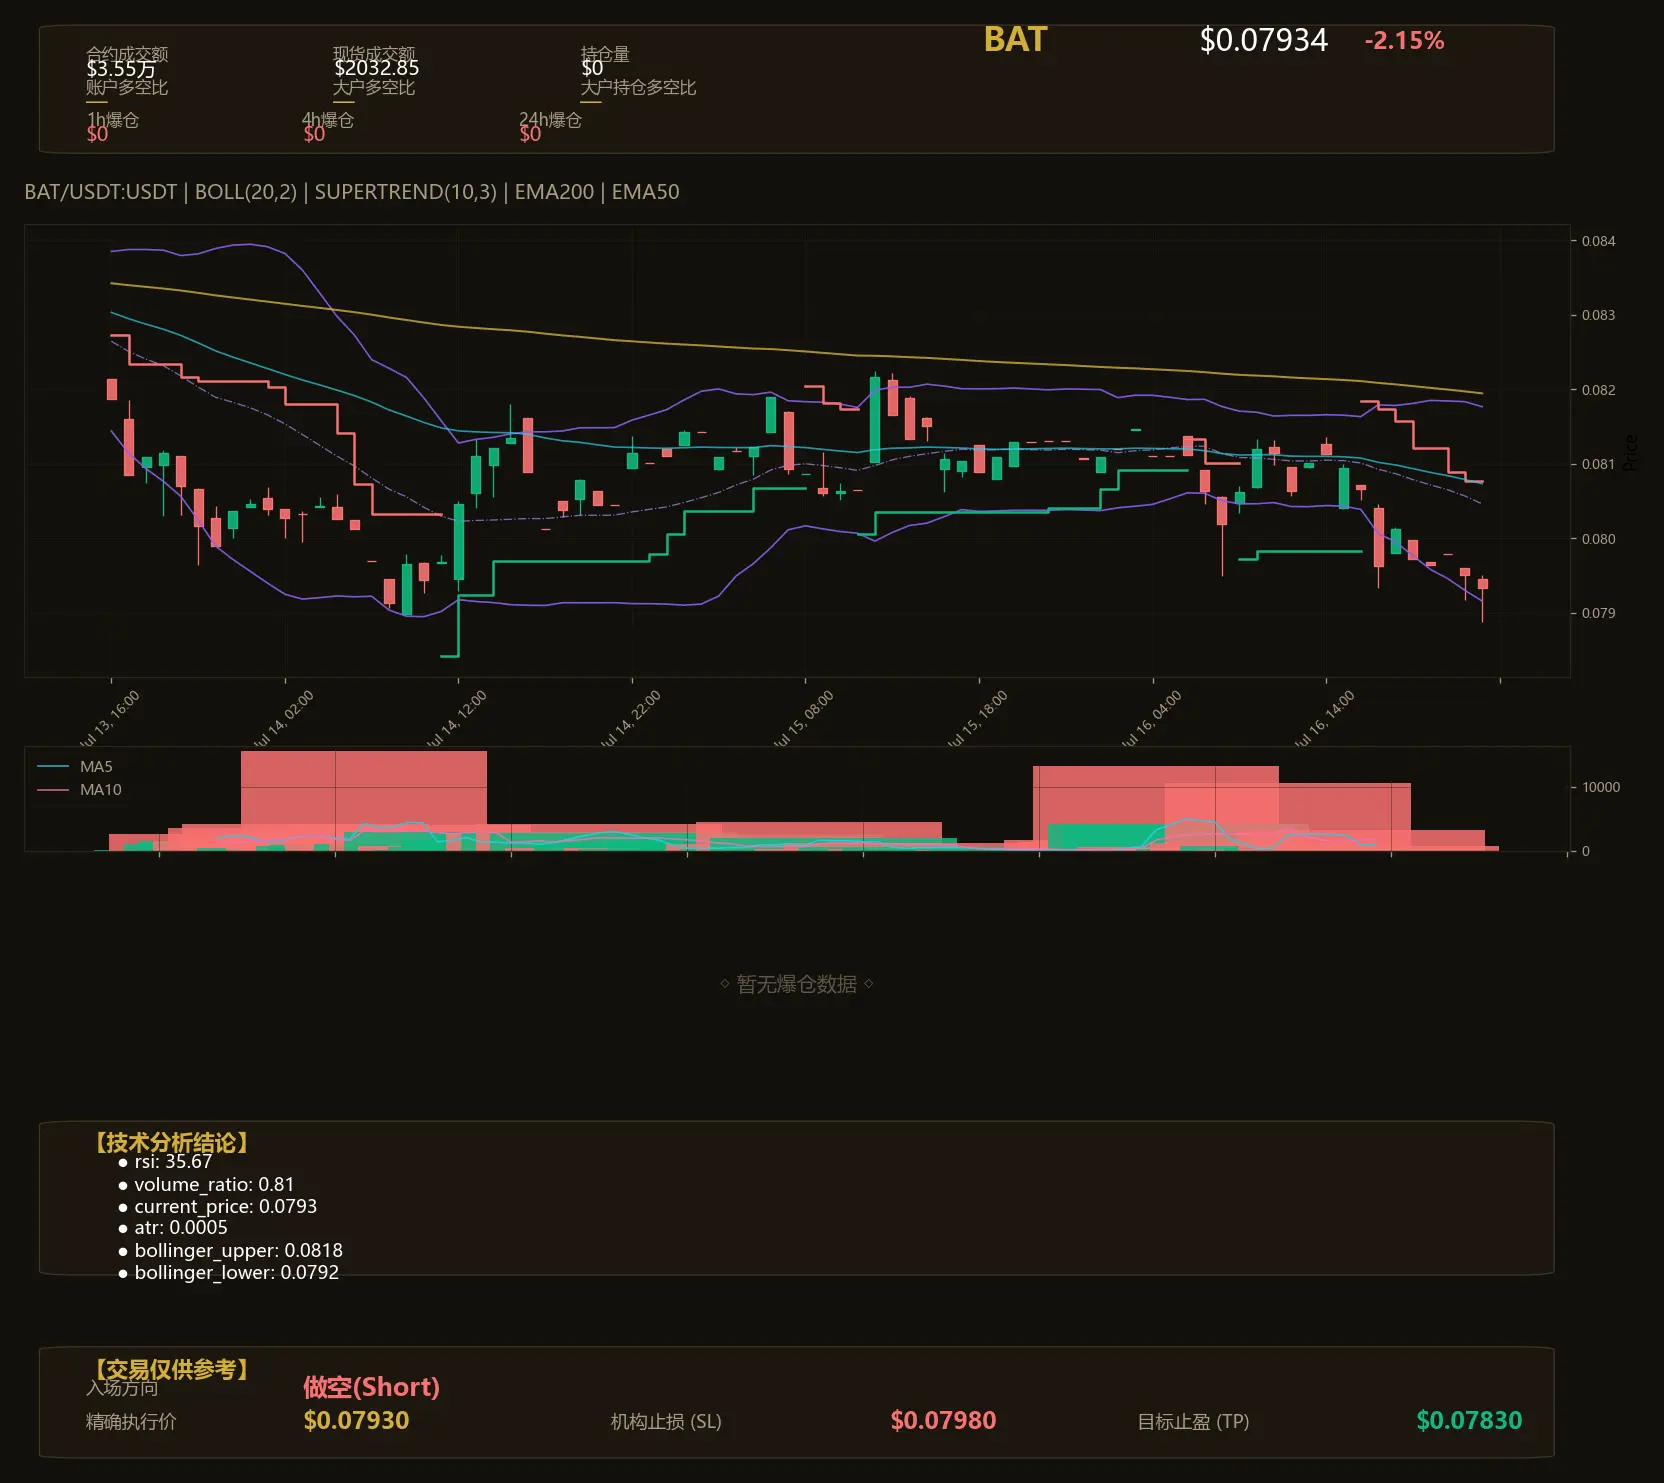
This BAT chart is so ugly it makes me want to curse. The fund flows are all dog-operator trades fighting each other, and retail investors can’t even get a mouthful of soup before getting chopped and running for the exit. This move is purely internal gamesmanship, with zero fundamental support. The K-line shows clear abnormal movement—market makers are just waiting to catch the panic sell orders.
My indicators show that around 0.0793 is an excellent position to lay a trap. Don’t just stand there waiting for a rebound—this level is basically handing out money.
If you want to secretly take a
BAT-1.93%
View Original
post-image
  • Reward
  • Comment
  • Repost
  • Share
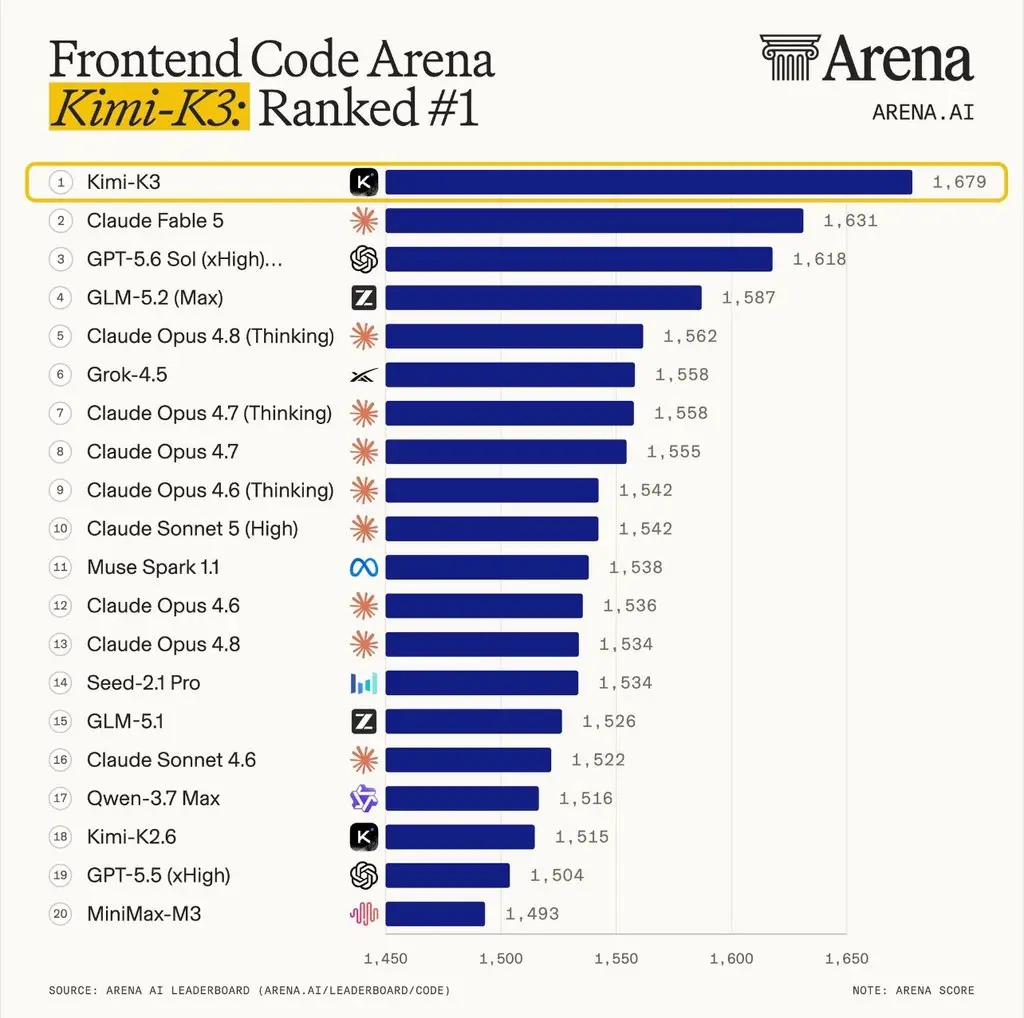
Kimi in the lead!
Ranked #1 for front end
Chinese based ai company prolly the next best thing incoming
I’ve been thinking this for a while
post-image
  • Reward
  • Comment
  • Repost
  • Share
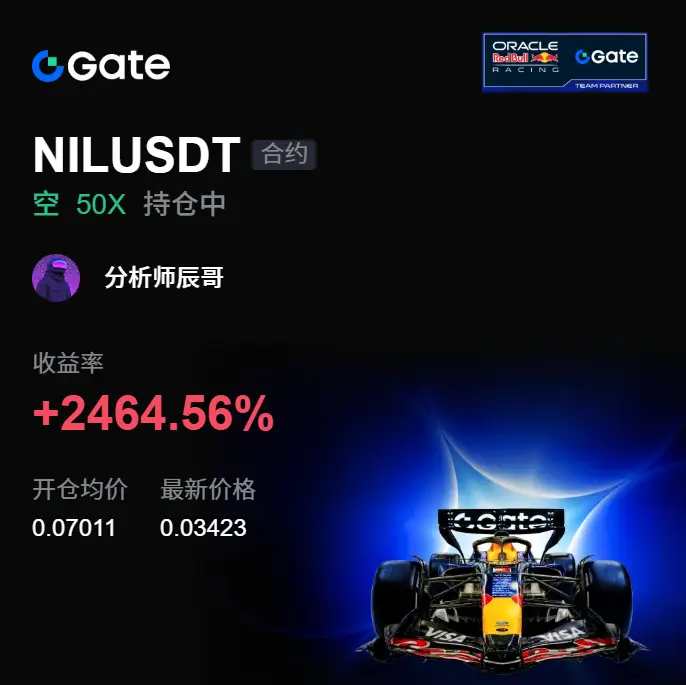
This move is the classic pattern of luring buyers at the high end, then killing the move downward. $NIL started pulling very aggressively, and the more chaotic the surface looks, the more you can’t just watch the noise.
Earlier, we already noticed this area. Around 0.07011 it looks like there’s still some momentum, but the order book support above is clearly getting thinner; several pushes to new highs failed to break through the structure. Many people see the rally and rush to chase it. I’m watching the speed of the pullback—this is the key point here. The pullback is more decisive than the
NIL-3.07%
BTC-1.48%
ETH-2.90%
View Original
post-image
  • Reward
  • Comment
  • Repost
  • Share
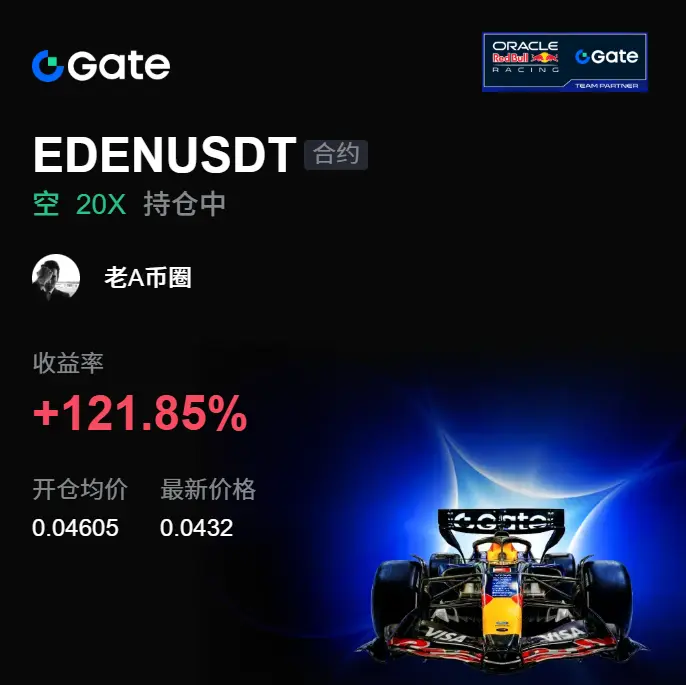
I was originally ready to shut down the software, but then I got this. When it dumped during the intraday drop, $EDEN ’s rebound never had any strength. There was clear resistance overhead—once it pushed up, it got smashed. I could tell something wasn’t right, so I directly warned: from the high level, don’t hard-chase. If you’re bullish, you should move toward realizing gains on the short side.
I entered at 0.04605, and now the price is at 0.04323. The P&L shows +121.85%—feels great, brothers. This pull-down is really showing respect.
Once you understand it, execute—don’t hesitate at the very
EDEN-1.25%
BTC-1.48%
ETH-2.90%
View Original
post-image
  • Reward
  • Comment
  • Repost
  • Share
Crypto Myth vs Fact
gate liveLIVE
21
  • Reward
  • Comment
  • Repost
  • Share
This price action is really a bit outrageous! 🔥 A few days ago, in the early morning, it was still acting strong, and it kept getting yanked upward in bursts—but what I’m seeing actually looks more like a trap to lure longs.
While it ground higher at the highs during the session, every time $CARV pushed up, it was always missing by a breath, and the volume also didn’t keep up 📉 I judged that the overhead pressure hasn’t been lifted yet, so around 0.03857 I flagged a long entry—not chasing the excitement, just waiting for a pullback to cash out.
Now it’s moved from 0.03857 down to 0.03257, pr
CARV-4.41%
BTC-1.48%
ETH-2.90%
View Original
post-image
  • Reward
  • Comment
  • Repost
  • Share
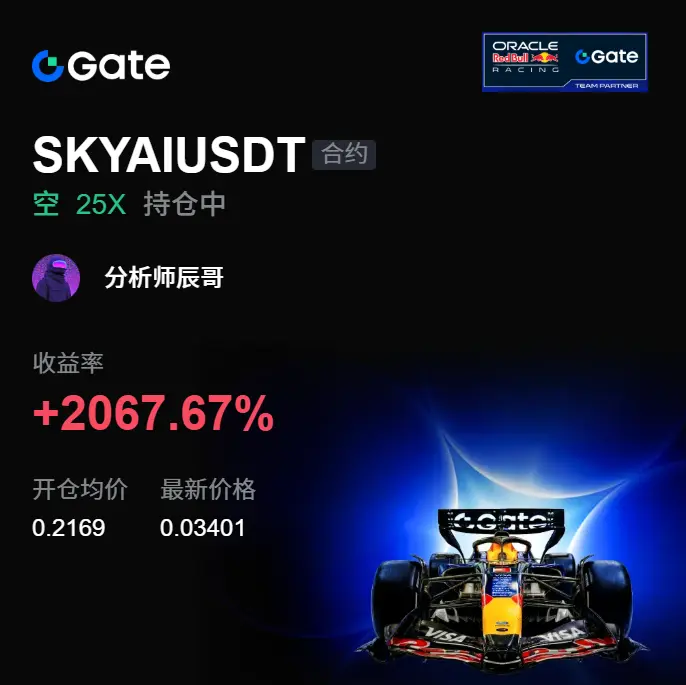
This sell-off just now wasn’t most clearly about the size of the drop—it was that the rebound couldn’t hold at all. $SKYAI ground around at the high for so long; many people thought it was building up power, but what I saw was that the support was getting weaker and weaker.
What really made me take action was that pullback near 0.21690. Price gave an upswing move, but it didn’t get follow-through. Then sell-side orders started to press very tightly. Something was already off here—especially with short-term longs still stubbornly waiting for a comeback; the chart had already weakened first.
No
SKYAI13.97%
BTC-1.48%
ETH-2.90%
View Original
post-image
  • Reward
  • Comment
  • Repost
  • Share
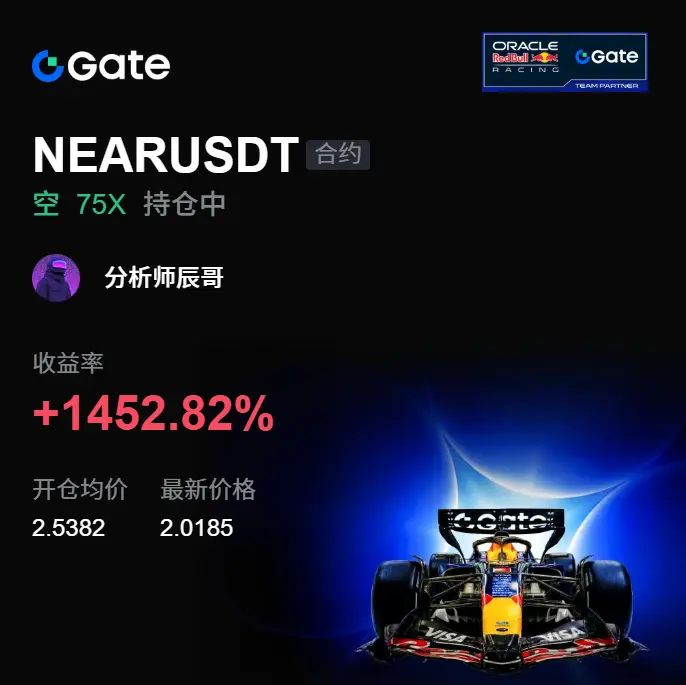
After this round of selloff, the tape’s “feel” is very clear. $NEAR has been grinding sideways at high levels for a while; many people think that if it hasn’t dropped yet, it’s strong. I actually think this is very dangerous here, because the price can’t go up—if time drags on, it will just wear down the bulls’ patience.

I opened a short around 2.5382. I’m not looking at just a single candlestick, but several consecutive attempts to push higher that all failed. To put it simply, the rhythm has changed: the buy-side can’t keep up. The weaker the rebound, the higher the probability that the ne
NEAR-4.78%
BTC-1.48%
ETH-2.90%
View Original
post-image
  • Reward
  • Comment
  • Repost
  • Share
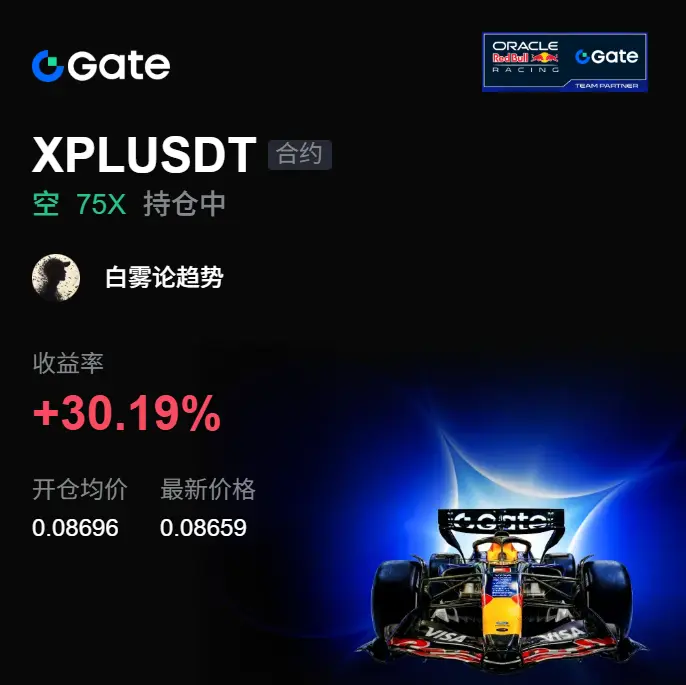
To be honest, today’s sell-off is really against human nature. The more $XPL looks strong at the highs, the easier it is to fool people into getting in.
My short position is at 0.08696. Now the price is down to 0.08659, and the return is +30.19%. Back then, many people were still looking for a breakout. I was watching the reaction after the spike: the price couldn’t push higher, but the pullback got faster and faster. Something here was already off.
The easiest way to lose money is in moments like this—seeing one bullish candle and rushing to chase. Then once the resistance above confirms, the
XPL-5.83%
BTC-1.48%
ETH-2.90%
View Original
post-image
  • Reward
  • Comment
  • Repost
  • Share
July 17 Fundraising Lady - Yellow Fish Early News
The data-driven momentum continues the downward trend, with the head trend fully opening
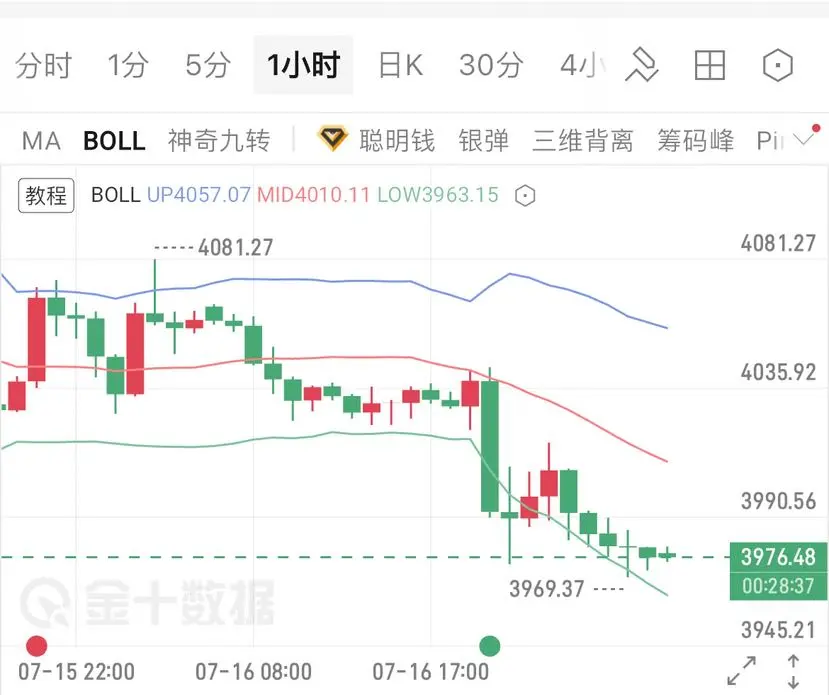
1. From a review of the order book, due to a favorable impact from late-night U.S. economic data on the dollar, gold has continued to weaken, dipping to the low of 3969. The current price is 3976. On the hourly chart, price has been continuously trading near the lower Bollinger Band around 3963, bearing below the Bollinger middle band at 4010. In the short term, resistance lies at 4010 and 4057 above; support near term lies at 3963 below. The overall downtr
XAUT-1.69%
View Original
post-image
  • Reward
  • 2
  • Repost
  • Share
OusdSleeper:
This drop is indeed severe. Data is broadly bullish for the US dollar, and the gold bulls are routed. However, the technicals are already close to the lower Bollinger Band, so there may be a short-term technical rebound. It’s best not to chase too deeply; it’s safer to short only after the rebound moves back above 4,000.
View More
TODAY MARKET UPDATES
gate liveLIVE
2,164
  • Reward
  • Comment
  • Repost
  • Share
Guys, who gets it! With this one, the chart directly gave the answer 📉🔥

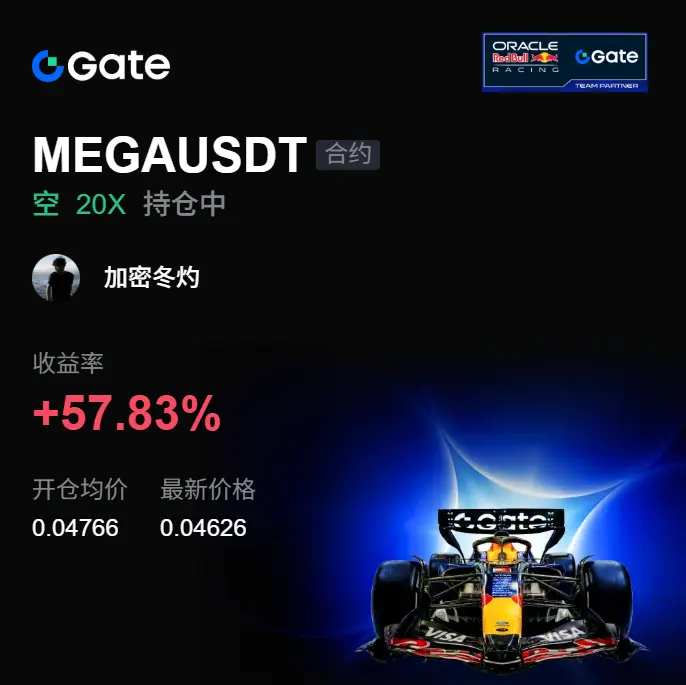
A few days ago, before sleep, I was watching $MEGA . It did pump, but the volume didn’t keep up, and the overhead resistance was pretty obvious 👀 Every time it surged, it always missed by just a little—I told myself then not to chase the order. When the position is reached, just look at going long.

From 0.04766 to 0.04626, this short trade paid out really comfortably ✅🎯 +57.83% in hand. The grinding before was truly grinding, but when it finally moved, it was truly worth it.

This is the rhythm.

On execution: fir
MEGA-3.64%
BTC-1.48%
ETH-2.90%
View Original
post-image
  • Reward
  • Comment
  • Repost
  • Share
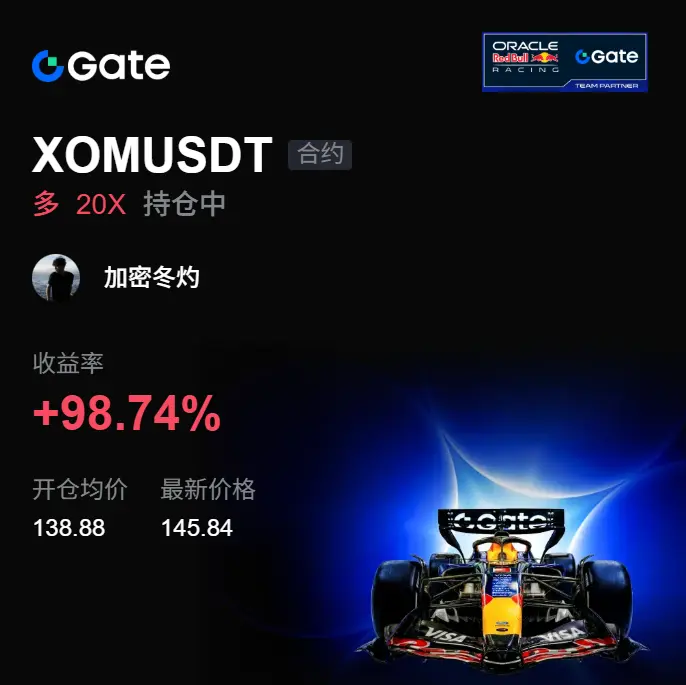
A few days ago it was still grinding, and today it directly gives the answer! This round of $XOM is really messing with people, but the result is truly rewarding 📈🎉
A few days ago, at around midnight, I saw it grind at the bottom but not break down. When it pulled back, it could still be recovered—buying pressure kept coming in waves. At that moment, I judged that the shorts couldn’t hold it down. I prompted to go long, first to watch for the rebound to be cashed out ✅👀
Now the price has pushed from 138.88 to 145.84, with profit +98.74%. Everyone on the car should be pretty comfortable this
XOM1.09%
BTC-1.48%
ETH-2.90%
View Original
post-image
  • Reward
  • Comment
  • Repost
  • Share
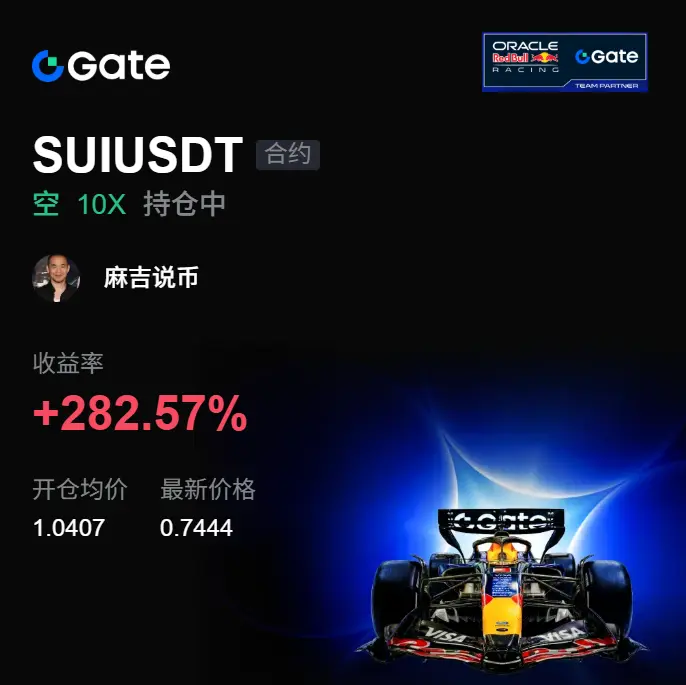
This drop just smashed down— the whole chart instantly sobered up! 📉🔥
A few days ago, when I was watching $SUI before sleeping, it was still holding strong at a high level. A lot of people thought it could push higher again, but the more I watched, the more uncomfortable I felt. Volume didn’t keep up—once it went up, there weren’t enough buyers to catch it. Every rebound was just short of the mark. This kind of chart is the easiest to first fool your emotions.
Before the chart fully kicked off, I watched SUI’s follow-through and noticed the overhead pressure still wouldn’t loosen, and the b
SUI-2.21%
BTC-1.48%
ETH-2.90%
View Original
post-image
  • Reward
  • Comment
  • Repost
  • Share
$MSTAR this token will skyrocket before it delists!!!
MSTAR-43.58%
post-image
  • Reward
  • Comment
  • Repost
  • Share
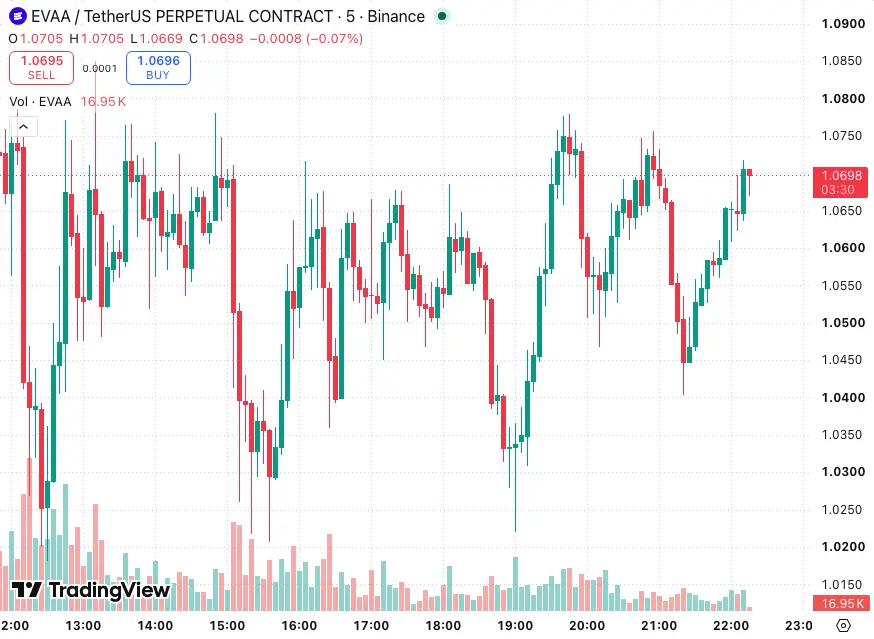
$EVAA Watch the short side. The current price is clearly under pressure in the resistance range of 1.06410 to 1.07270. The short structure on the 4-hour timeframe is still in place, and the daily chart overall remains in range-bound consolidation. From the short-term perspective, the 15-minute RSI is around 55, momentum is neutral, and there may still be room to move further down. Also, the 15-minute trading volume has surged by 4x, and real sell orders have already started to come in. For entry, you can look at the 1.06410 to 1.07270 area; downside targets could be around 1.03760, 1.01710, a
EVAA1.03%
View Original
post-image
  • Reward
  • Comment
  • Repost
  • Share
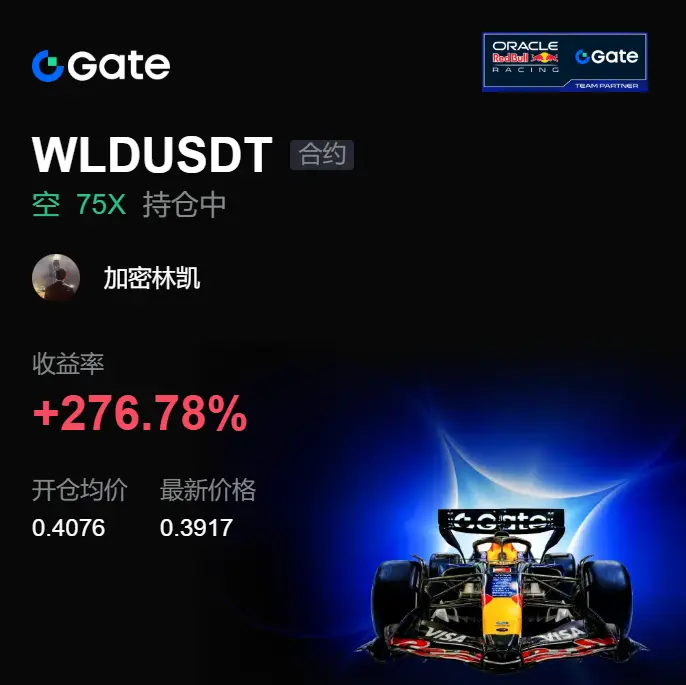
This trade wasn’t made by impulse—it was signaled by those fake breakouts at the high. $WLD surged at the time and looked very strong, but the volume couldn’t keep up. The order book got pressed and it fell apart; a lot of people chased in and only then realized something was off.

My focus is simple: can the pullback hold. If it can’t, it means the sell pressure overhead is still there. After opening a short around 0.4076, the price kept releasing downward; it’s now at 0.3916. You’re up +278.53%—when this kind of volatility opens up, execution matters more than fantasies.

After a short is
WLD-4.32%
BTC-1.48%
ETH-2.90%
View Original
post-image
  • Reward
  • Comment
  • Repost
  • Share
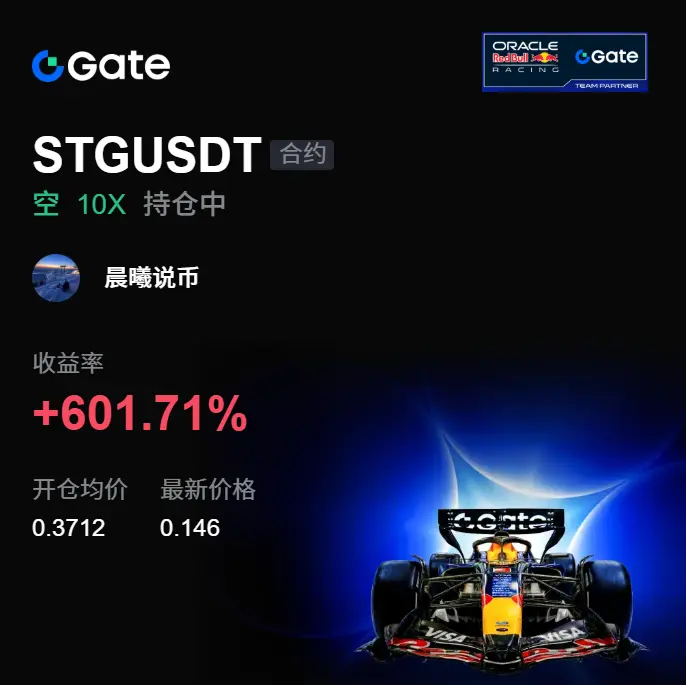
Before panic starts spreading, prices often already give signals in advance. One thing $STG confirmed for me this time is that the weaker the rebound in weakness, the more likely it is that it will continue to release afterward.
My trading habit is to look at structure first, then at price feedback. After confirming the rhythm around 0.3712, it then moved all the way to 0.146. This wasn’t just luck—key levels at the high end were gradually being realized.
Now the return rate shows +601.71%. To me, it feels more like a judgment being validated by the market. In a downtrend, the worst thing isn’
STG3.42%
BTC-1.48%
ETH-2.90%
View Original
post-image
  • Reward
  • Comment
  • Repost
  • Share
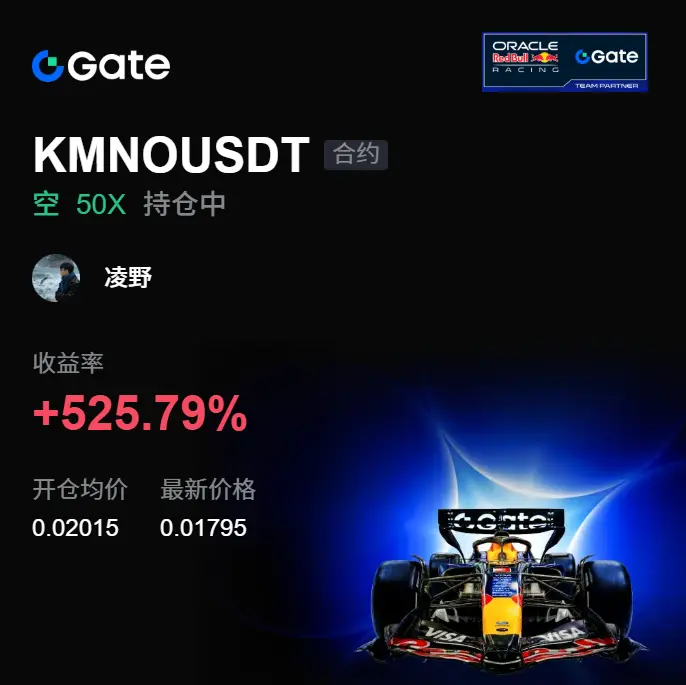
It was still grinding a few days ago, and today it directly gives the answer! 📉🚀 One last glance before bed, $KMNO is still showing strength by moving sideways at the high end, but I can see it clearly: an endless pump is coming, but there’s insufficient support— the more it grinds, the more dangerous it gets.

Before the market fully kicked off, I already warned you not to get led by small pullbacks. Weak rebound is the key. Go long as a reference at 0.02015—what we’re waiting for is its drop after it faces pressure at the high end 🎯👀

This morning, when I opened the chart, the price h
KMNO-0.56%
BTC-1.48%
ETH-2.90%
View Original
post-image
  • Reward
  • Comment
  • Repost
  • Share
Load More

Join 40 M users in our growing community

⚡️ Join 40 M users in the crypto craze discussion
💬 Engage with your favorite top creators
👍 See what interests you
  • Pinned