
#ETHBreaks1700
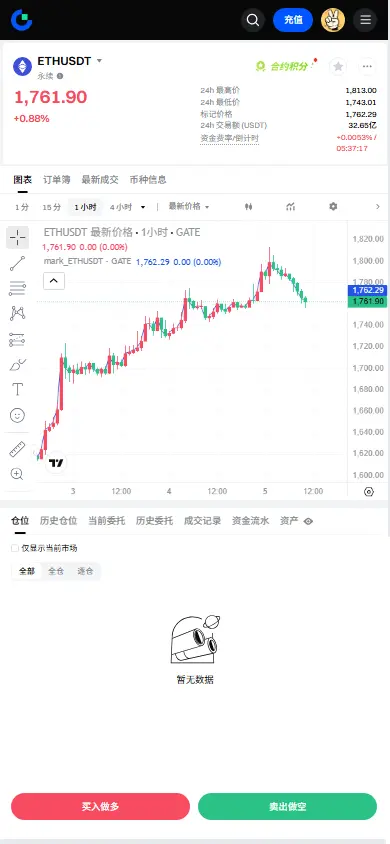
Ethereum's decisive breakthrough above the $1,700 resistance level marks a pivotal moment in the cryptocurrency market, signaling a fundamental shift in market structure and investor sentiment. This technical milestone represents far more than a simple price point crossed; it embodies the transition from a bearish consolidation phase to a potential bullish momentum phase that could define the trajectory for the remainder of 2026.
The significance of the $1,700 level cannot be overstated from a technical analysis perspective. For months, this price point served as an impenetrable ceiling that repeatedly rejected Ethereum's upward advances, creating a psychological barrier that dampened investor confidence and reinforced bearish narratives. Each failed attempt to breach this level resulted in cascading sell-offs, pushing ETH into lower trading ranges and testing the resolve of long-term holders. However, the recent successful breakout has fundamentally altered this dynamic, transforming what was once formidable resistance into a robust support foundation.
Current market positioning at approximately $1,745 demonstrates that Ethereum is not merely testing the $1,700 level but has established genuine conviction above it. This price action suggests that institutional and whale accumulation has reached a critical mass where buying pressure now consistently overwhelms selling pressure at these levels. The transformation of $1,700 from resistance to support creates a new technical floor that provides traders with increased confidence for establishing long positions.
From a technical indicator standpoint, multiple convergence signals support the bullish thesis. The Relative Strength Index has climbed from oversold territory below 30 to approximately 45-50, indicating renewed buying momentum without yet reaching overbought conditions that would suggest imminent correction. This positioning leaves substantial room for further upside before technical exhaustion becomes a concern. The Moving Average Convergence Divergence indicator is approaching a bullish crossover, with the MACD line threatening to cross above the signal line, a development that historically precedes sustained upward price movements.
Bollinger Bands analysis reveals decreasing volatility compression, suggesting that a significant price expansion may be imminent. When volatility has been suppressed for extended periods, as witnessed in recent months, the subsequent breakout tends to be particularly powerful as pent-up market energy releases. Ethereum's current positioning above the middle Bollinger Band while the bands themselves begin to expand supports the interpretation that a new trending phase is initiating.
On-chain metrics provide compelling evidence of underlying strength that supports the technical breakout narrative. Whale wallets holding in excess of 10,000 ETH have demonstrated unprecedented accumulation behavior, with recent data indicating purchases exceeding 140,000 ETH within compressed timeframes. Perhaps most notably, a single entity recently acquired 50,537 ETH valued at approximately $162 million within a 24-hour period, representing one of the largest single-day purchases in recent market history. This institutional-scale accumulation signals sophisticated market participants' conviction regarding Ethereum's undervaluation at current levels.
Exchange reserve data reinforces this bullish interpretation, with Ethereum balances on centralized exchanges declining to historic lows. This trend indicates that holders are increasingly choosing self-custody or decentralized finance protocols over exchange storage, effectively removing liquid supply from immediate market circulation. When combined with whale accumulation, this supply squeeze dynamic creates favorable conditions for price appreciation as demand meets constrained available supply.
The broader cryptocurrency ecosystem stands to benefit from Ethereum's breakout performance. As the dominant smart contract platform hosting approximately $250-300 billion in total value locked across decentralized finance protocols, Ethereum's strength typically catalyzes sector-wide optimism. Layer 2 scaling solutions built atop Ethereum's infrastructure, including Arbitrum, Optimism, and Base, historically demonstrate correlated performance with ETH price action. Similarly, major DeFi tokens such as Uniswap, Aave, and Compound typically experience renewed buying interest when Ethereum establishes bullish momentum.
Network fundamentals complement the positive price action narrative. Ethereum's transition to proof-of-stake consensus has successfully established deflationary tokenomics, with network activity periodically resulting in net ETH destruction through the burn mechanism. Layer 2 adoption continues accelerating, with these scaling solutions now processing transaction volumes that rival or exceed many independent Layer 1 competitors while inheriting Ethereum's security guarantees. The upcoming Hegotá hard fork and associated EIP-8182 proposal for standardized shielded pools represent continued protocol development that enhances Ethereum's utility and competitive positioning.
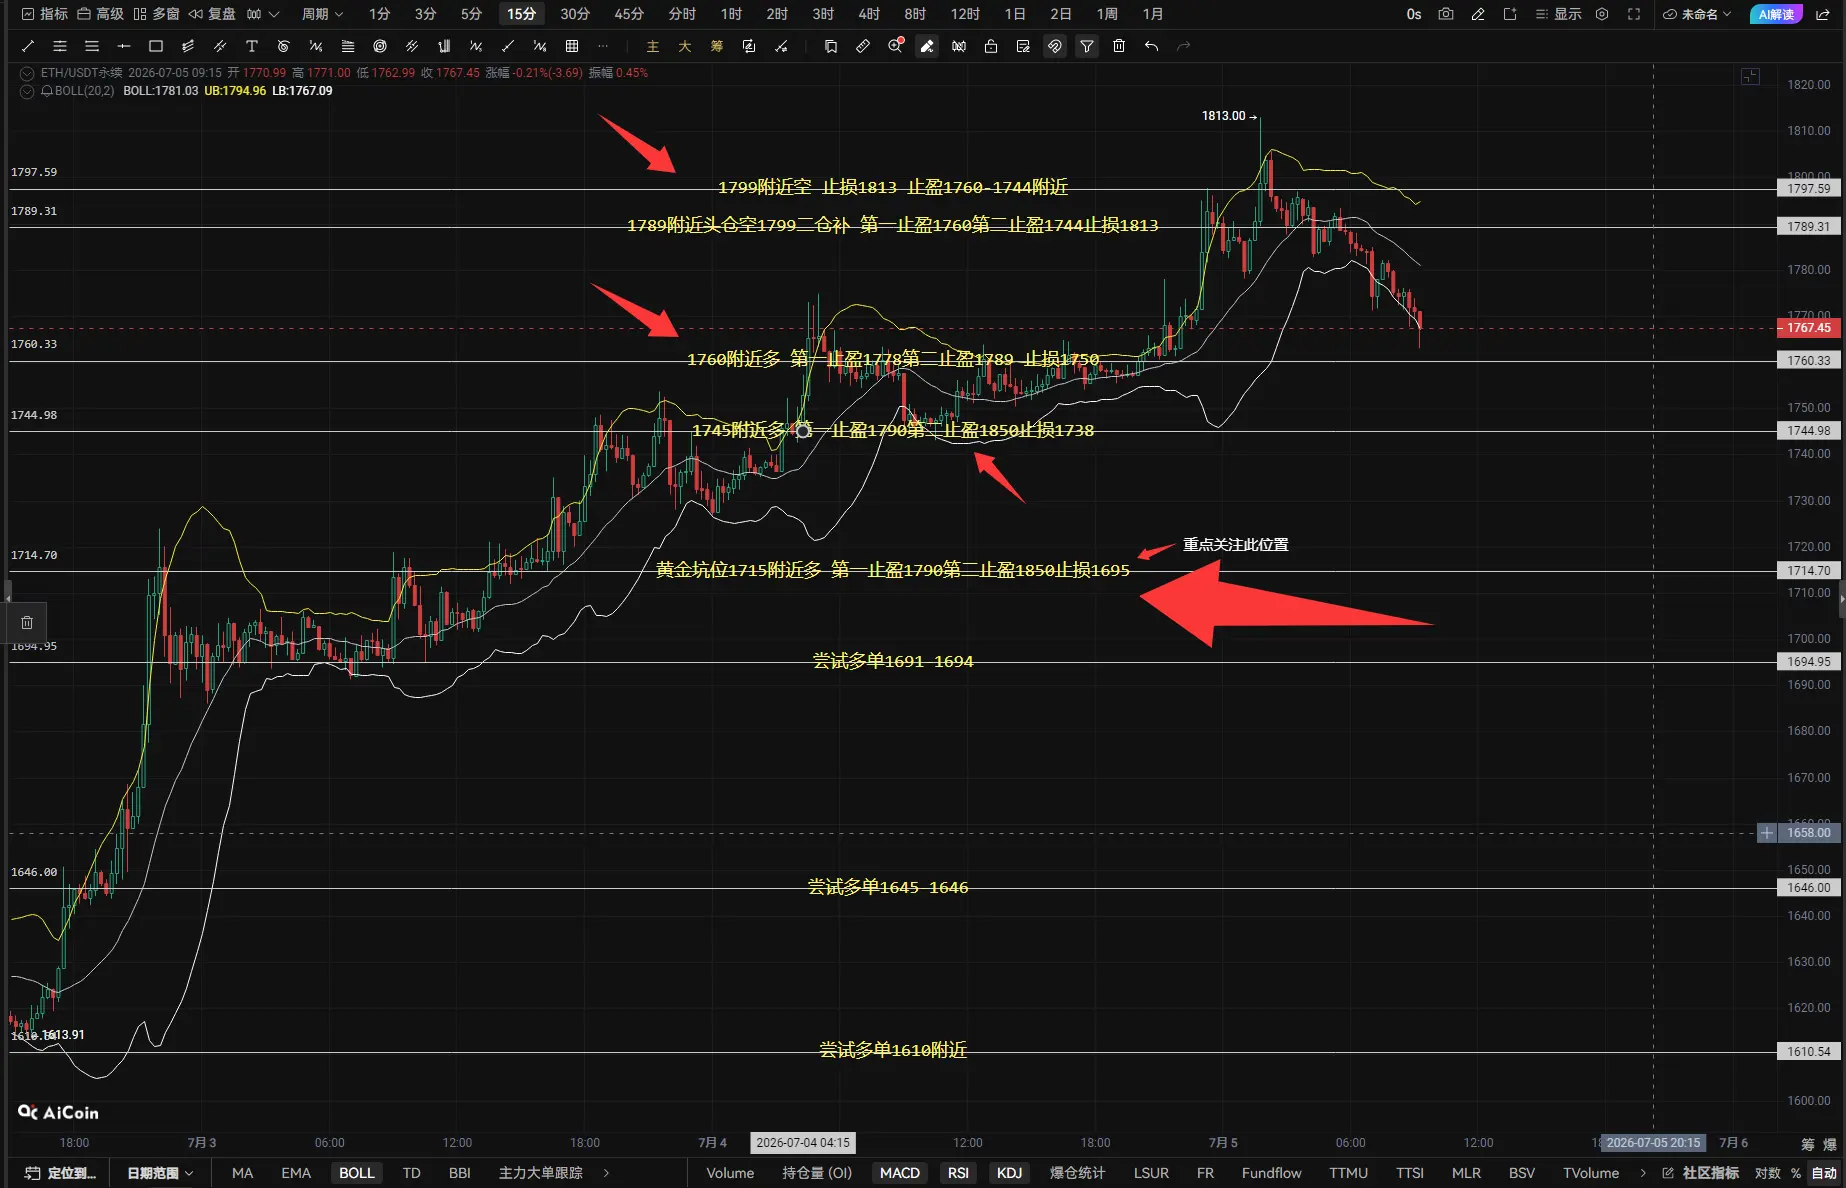
Trading strategy formulation must account for both opportunity and risk management considerations. For traders establishing new positions, the $1,720-$1,740 zone presents attractive accumulation opportunities on any minor pullbacks, with the transformed $1,700 support level providing a logical stop-loss reference point. Initial profit targets should be staged at $1,800, where partial position reduction allows for risk management while maintaining upside exposure. Secondary targets at $1,865 and $1,900 represent the next significant resistance zones where additional profit-taking may be appropriate.
Swing traders should monitor volume confirmation closely, as sustainable breakouts require participation that validates price movements. Declining volume on advances would suggest weak conviction and increased vulnerability to reversal. The $1,750-$1,800 range will likely serve as a consolidation zone where Ethereum establishes a foundation for the next leg higher, providing multiple entry opportunities for patient participants.
Macro considerations remain relevant despite improving technical conditions. Federal Reserve monetary policy decisions continue influencing risk asset valuations, with interest rate trajectories affecting the opportunity cost of cryptocurrency investments. Institutional adoption trends, including corporate treasury allocations and retirement account integrations, represent structural demand sources that may accelerate as regulatory clarity improves. Geopolitical developments and traditional market correlations warrant monitoring, as cryptocurrency markets do not operate in complete isolation from broader financial conditions.
Risk management discipline remains paramount even within favorable technical setups. Position sizing should reflect individual risk tolerance and portfolio context, with prudent traders avoiding excessive leverage that could force liquidation during normal volatility. The cryptocurrency market operates continuously without traditional market hours, necessitating alert systems and contingency planning for unexpected developments.
For traders seeking professional execution environments, Gate provides comprehensive infrastructure supporting sophisticated cryptocurrency trading strategies. The platform offers advanced charting capabilities with integrated technical indicators including RSI, MACD, Bollinger Bands, and customizable moving averages. Real-time price alert systems enable proactive position management, while deep liquidity across spot and derivatives markets ensures efficient order execution. Security protocols incorporating cold storage, multi-signature authorization, and insurance funds protect user assets against operational risks.
The confluence of technical breakout confirmation, on-chain accumulation evidence, network fundamental development, and improving macro sentiment suggests Ethereum has established a foundation for sustained appreciation. While short-term volatility remains inherent to cryptocurrency markets, the structural shift represented by the $1,700 breakout provides a framework for strategic positioning that balances opportunity capture with prudent risk management.@Gate_Square
Ethereum's decisive breakthrough above the $1,700 resistance level marks a pivotal moment in the cryptocurrency market, signaling a fundamental shift in market structure and investor sentiment. This technical milestone represents far more than a simple price point crossed; it embodies the transition from a bearish consolidation phase to a potential bullish momentum phase that could define the trajectory for the remainder of 2026.
The significance of the $1,700 level cannot be overstated from a technical analysis perspective. For months, this price point served as an impenetrable ceiling that repeatedly rejected Ethereum's upward advances, creating a psychological barrier that dampened investor confidence and reinforced bearish narratives. Each failed attempt to breach this level resulted in cascading sell-offs, pushing ETH into lower trading ranges and testing the resolve of long-term holders. However, the recent successful breakout has fundamentally altered this dynamic, transforming what was once formidable resistance into a robust support foundation.
Current market positioning at approximately $1,745 demonstrates that Ethereum is not merely testing the $1,700 level but has established genuine conviction above it. This price action suggests that institutional and whale accumulation has reached a critical mass where buying pressure now consistently overwhelms selling pressure at these levels. The transformation of $1,700 from resistance to support creates a new technical floor that provides traders with increased confidence for establishing long positions.
From a technical indicator standpoint, multiple convergence signals support the bullish thesis. The Relative Strength Index has climbed from oversold territory below 30 to approximately 45-50, indicating renewed buying momentum without yet reaching overbought conditions that would suggest imminent correction. This positioning leaves substantial room for further upside before technical exhaustion becomes a concern. The Moving Average Convergence Divergence indicator is approaching a bullish crossover, with the MACD line threatening to cross above the signal line, a development that historically precedes sustained upward price movements.
Bollinger Bands analysis reveals decreasing volatility compression, suggesting that a significant price expansion may be imminent. When volatility has been suppressed for extended periods, as witnessed in recent months, the subsequent breakout tends to be particularly powerful as pent-up market energy releases. Ethereum's current positioning above the middle Bollinger Band while the bands themselves begin to expand supports the interpretation that a new trending phase is initiating.
On-chain metrics provide compelling evidence of underlying strength that supports the technical breakout narrative. Whale wallets holding in excess of 10,000 ETH have demonstrated unprecedented accumulation behavior, with recent data indicating purchases exceeding 140,000 ETH within compressed timeframes. Perhaps most notably, a single entity recently acquired 50,537 ETH valued at approximately $162 million within a 24-hour period, representing one of the largest single-day purchases in recent market history. This institutional-scale accumulation signals sophisticated market participants' conviction regarding Ethereum's undervaluation at current levels.
Exchange reserve data reinforces this bullish interpretation, with Ethereum balances on centralized exchanges declining to historic lows. This trend indicates that holders are increasingly choosing self-custody or decentralized finance protocols over exchange storage, effectively removing liquid supply from immediate market circulation. When combined with whale accumulation, this supply squeeze dynamic creates favorable conditions for price appreciation as demand meets constrained available supply.
The broader cryptocurrency ecosystem stands to benefit from Ethereum's breakout performance. As the dominant smart contract platform hosting approximately $250-300 billion in total value locked across decentralized finance protocols, Ethereum's strength typically catalyzes sector-wide optimism. Layer 2 scaling solutions built atop Ethereum's infrastructure, including Arbitrum, Optimism, and Base, historically demonstrate correlated performance with ETH price action. Similarly, major DeFi tokens such as Uniswap, Aave, and Compound typically experience renewed buying interest when Ethereum establishes bullish momentum.
Network fundamentals complement the positive price action narrative. Ethereum's transition to proof-of-stake consensus has successfully established deflationary tokenomics, with network activity periodically resulting in net ETH destruction through the burn mechanism. Layer 2 adoption continues accelerating, with these scaling solutions now processing transaction volumes that rival or exceed many independent Layer 1 competitors while inheriting Ethereum's security guarantees. The upcoming Hegotá hard fork and associated EIP-8182 proposal for standardized shielded pools represent continued protocol development that enhances Ethereum's utility and competitive positioning.
Trading strategy formulation must account for both opportunity and risk management considerations. For traders establishing new positions, the $1,720-$1,740 zone presents attractive accumulation opportunities on any minor pullbacks, with the transformed $1,700 support level providing a logical stop-loss reference point. Initial profit targets should be staged at $1,800, where partial position reduction allows for risk management while maintaining upside exposure. Secondary targets at $1,865 and $1,900 represent the next significant resistance zones where additional profit-taking may be appropriate.
Swing traders should monitor volume confirmation closely, as sustainable breakouts require participation that validates price movements. Declining volume on advances would suggest weak conviction and increased vulnerability to reversal. The $1,750-$1,800 range will likely serve as a consolidation zone where Ethereum establishes a foundation for the next leg higher, providing multiple entry opportunities for patient participants.
Macro considerations remain relevant despite improving technical conditions. Federal Reserve monetary policy decisions continue influencing risk asset valuations, with interest rate trajectories affecting the opportunity cost of cryptocurrency investments. Institutional adoption trends, including corporate treasury allocations and retirement account integrations, represent structural demand sources that may accelerate as regulatory clarity improves. Geopolitical developments and traditional market correlations warrant monitoring, as cryptocurrency markets do not operate in complete isolation from broader financial conditions.
Risk management discipline remains paramount even within favorable technical setups. Position sizing should reflect individual risk tolerance and portfolio context, with prudent traders avoiding excessive leverage that could force liquidation during normal volatility. The cryptocurrency market operates continuously without traditional market hours, necessitating alert systems and contingency planning for unexpected developments.
For traders seeking professional execution environments, Gate provides comprehensive infrastructure supporting sophisticated cryptocurrency trading strategies. The platform offers advanced charting capabilities with integrated technical indicators including RSI, MACD, Bollinger Bands, and customizable moving averages. Real-time price alert systems enable proactive position management, while deep liquidity across spot and derivatives markets ensures efficient order execution. Security protocols incorporating cold storage, multi-signature authorization, and insurance funds protect user assets against operational risks.
The confluence of technical breakout confirmation, on-chain accumulation evidence, network fundamental development, and improving macro sentiment suggests Ethereum has established a foundation for sustained appreciation. While short-term volatility remains inherent to cryptocurrency markets, the structural shift represented by the $1,700 breakout provides a framework for strategic positioning that balances opportunity capture with prudent risk management.@Gate_Square