
Futures
Access hundreds of perpetual contracts
CFD
Gold
One platform for global traditional assets
Options
Hot
Trade European-style vanilla options
Unified Account
Maximize your capital efficiency
Demo Trading
Introduction to Futures Trading
Learn the basics of futures trading
Futures Events
Join events to earn rewards
Demo Trading
Use virtual funds to practice risk-free trading
Launch
CandyDrop
Collect candies to earn airdrops
Launchpool
Quick staking, earn potential new tokens
HODLer Airdrop
Hold GT and get massive airdrops for free
Pre-IPOs
Unlock full access to global stock IPOs
Alpha Points
Trade on-chain assets and earn airdrops
Futures Points
Earn futures points and claim airdrop rewards


Promotions
AI
Gate AI
Your all-in-one conversational AI partner
Gate AI Bot
Use Gate AI directly in your social App
GateClaw
Gate Blue Lobster, ready to go
Gate for AI Agent
AI infrastructure, Gate MCP, Skills, and CLI
Gate Skills Hub
10K+ Skills
From office tasks to trading, the all-in-one skill hub makes AI even more useful.
GateRouter
Smartly choose from 40+ AI models, with 0% extra fees

Just joined Gate, combining macro and technical analysis, let's review gold!
I see many friends trading gold on Gate Square, so I’m writing a perspective on gold as my opening post for joining Gate Square!
This article is for reference only and does not constitute investment advice! The cycle is relatively long, and it can serve as a reference for short-term trading.
As a trader with many years coming from traditional financial markets, I prefer to judge a category’s trend by combining macro and technical analysis!
Especially for major assets like gold, which are more influenced by macro factors.
First, we need to understand what triggered this gold bull market? The root cause is de-dollarization, with central bank gold purchases as the driving force.
This process will continue because the de-dollarization effort is currently only in the mid-stage; I won’t go into too much detail here as it involves many aspects.
Let’s directly discuss the most probable future trend and the range for bottom-fishing, roughly at what prices.
Starting with the macro perspective:
Buy gold in turbulent times! The current Middle East situation did not trigger gold’s safe-haven properties; instead, it caused a decline, for two reasons!
1: The previous rally was too strong, commonly called the market moving ahead of schedule, and central bank gold buying has weakened.
2: The Middle East situation pushed up oil prices, and high oil prices boosted global inflation, leading to increased expectations of rate hikes!
Gold is a non-yield asset, while U.S. Treasuries are risk-free interest-bearing assets, which naturally leads to liquidity shifting, meaning money is flowing out of gold.
This is also why gold and the dollar are negatively correlated!
Now, on the technical side (using daily chart as reference):
I won’t talk about the previous rise; that’s just a post-mortem analysis! It’s of little significance.
On March 12, 2026, the price broke below the upward channel and also broke through the MA60! Since then, the price has been trading below the MA60.
Breaking the upward channel indicates that the bullish trend has ended, and the chips zone directly moved below 4850!
On May 13, it broke below the MA120 half-year line, further confirming the bearish trend. The only support below is the MA200 (the bull-bear dividing line) around 4400.!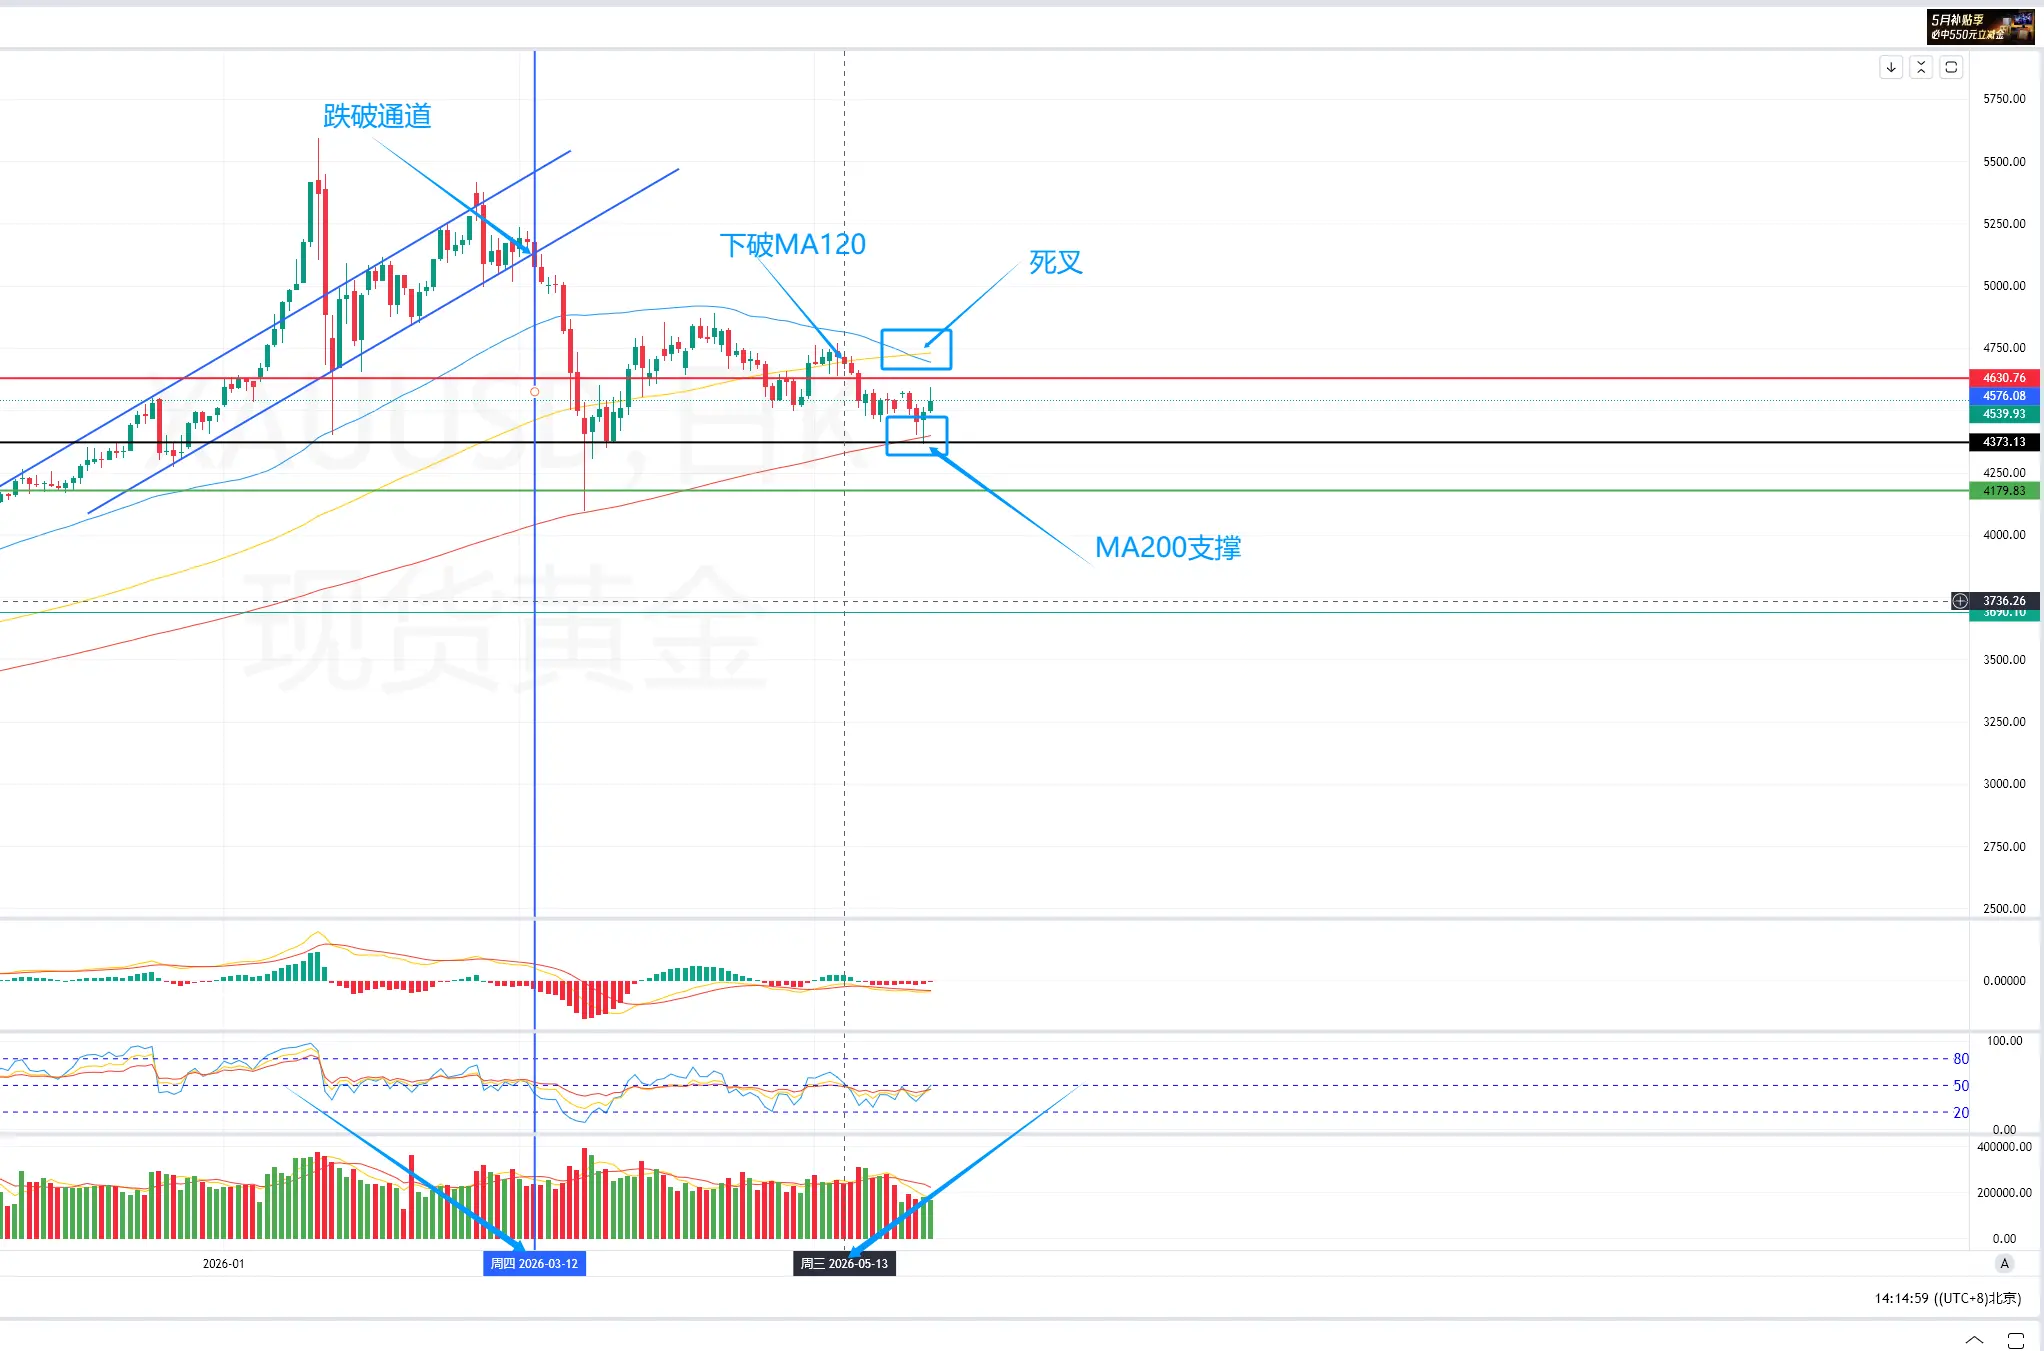
The current conclusion is that the MA60 above is crossing down to press against the MA120, while the MA200 below provides support.
From a technical perspective alone, this is a wide-range consolidation, but macro factors cannot be ignored!
1: US-Iran negotiations, which can be checked through news; multiple negotiations have failed! So, hope is limited moving forward.
2: Even if negotiations succeed, in the short term, oil prices and inflation levels won’t change much. Summer is the peak demand season for crude oil. Don’t think that short-term emotional-driven drops in oil prices mean a real decline; the prices we see are futures prices. The actual (physical, industrial demand) prices are what truly matter.
3: The Federal Reserve has been hawkish repeatedly, currently in a “three-hawk, one-dove” stance, meaning three hawkish statements and one dovish to ease.
4: June has seen a series of macro events, making it a very pivotal month.
Summary: Short-term gold rises can be seen as rebounds, not reversals.
The 4380/4400 range is a stage support!
From my personal view, considering long-term gold allocation, around 4000 is a good level. In other words, I expect the upcoming correction and decline to touch near the 4000 mark.