Futures
Access hundreds of perpetual contracts
TradFi
Gold
One platform for global traditional assets
Options
Hot
Trade European-style vanilla options
Unified Account
Maximize your capital efficiency
Demo Trading
Introduction to Futures Trading
Learn the basics of futures trading
Futures Events
Join events to earn rewards
Demo Trading
Use virtual funds to practice risk-free trading
Launch
CandyDrop
Collect candies to earn airdrops
Launchpool
Quick staking, earn potential new tokens
HODLer Airdrop
Hold GT and get massive airdrops for free
Pre-IPOs
Unlock full access to global stock IPOs
Alpha Points
Trade on-chain assets and earn airdrops
Futures Points
Earn futures points and claim airdrop rewards
Promotions
AI
Gate AI
Your all-in-one conversational AI partner
Gate AI Bot
Use Gate AI directly in your social App
GateClaw
Gate Blue Lobster, ready to go
Gate for AI Agent
AI infrastructure, Gate MCP, Skills, and CLI
Gate Skills Hub
10K+ Skills
From office tasks to trading, the all-in-one skill hub makes AI even more useful.
GateRouter
Smartly choose from 30+ AI models, with 0% extra fees
Confirmation of a weakening signal at high ETH levels! Resistance above 2280, the intraday pullback window has already opened.
Current Price: 2285.80
First, the conclusion: ETH has shifted from a consolidation pattern to a short-term bearish trend, indicating a “retest phase after a failed rebound.” Intraday, it is more likely to decline sideways rather than continue to strengthen.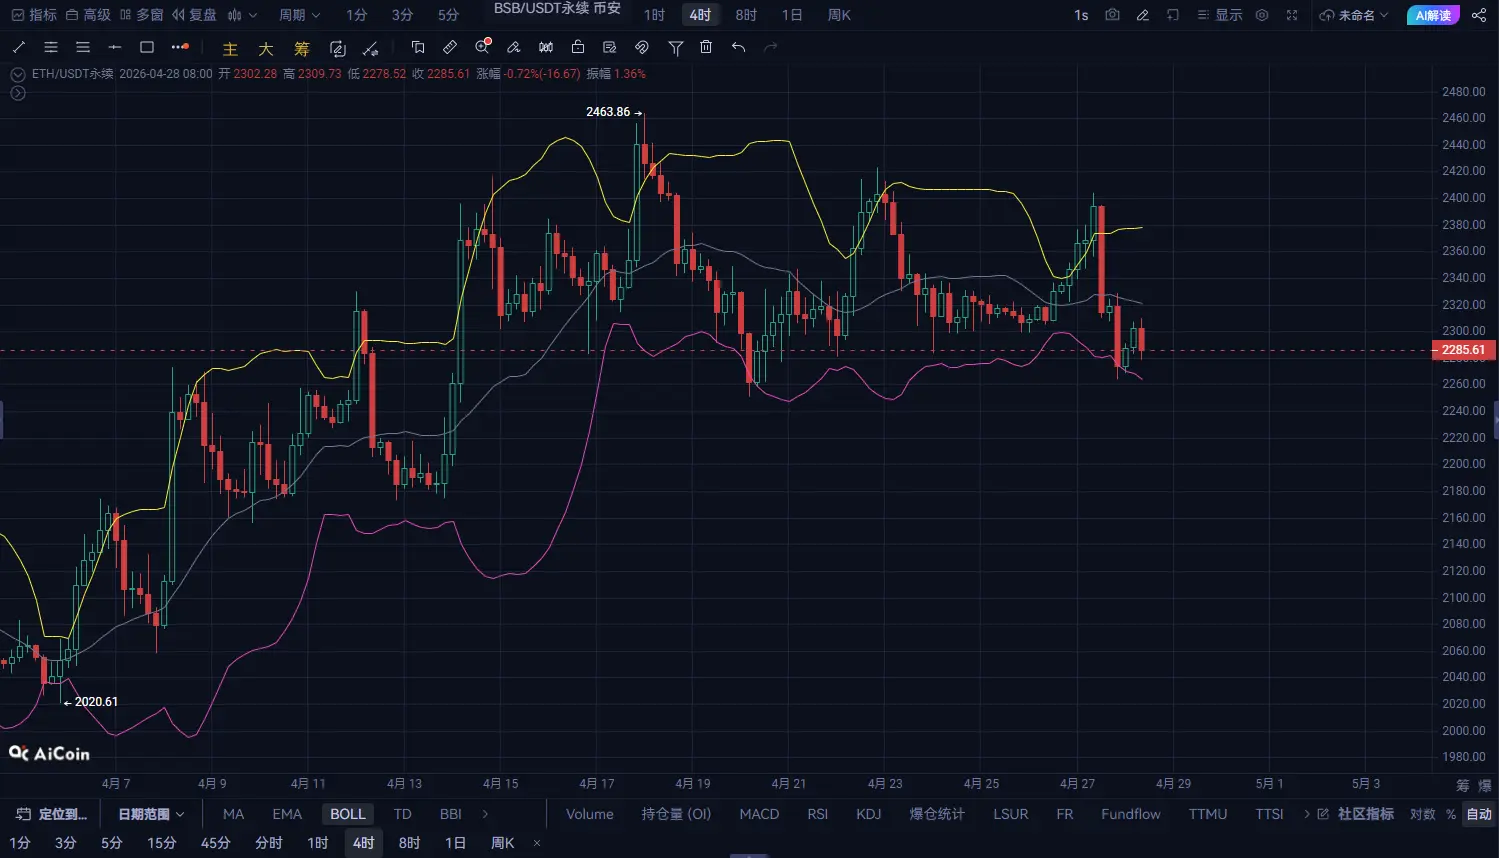
Failed to break above 2350 area, unable to sustain the rally Highs gradually declining, forming a resistance structure MACD shows clear signs of a death cross at high levels Bollinger Bands starting to tighten, price falling below the middle band
Core judgment: 4-hour chart indicates a sideways to bearish phase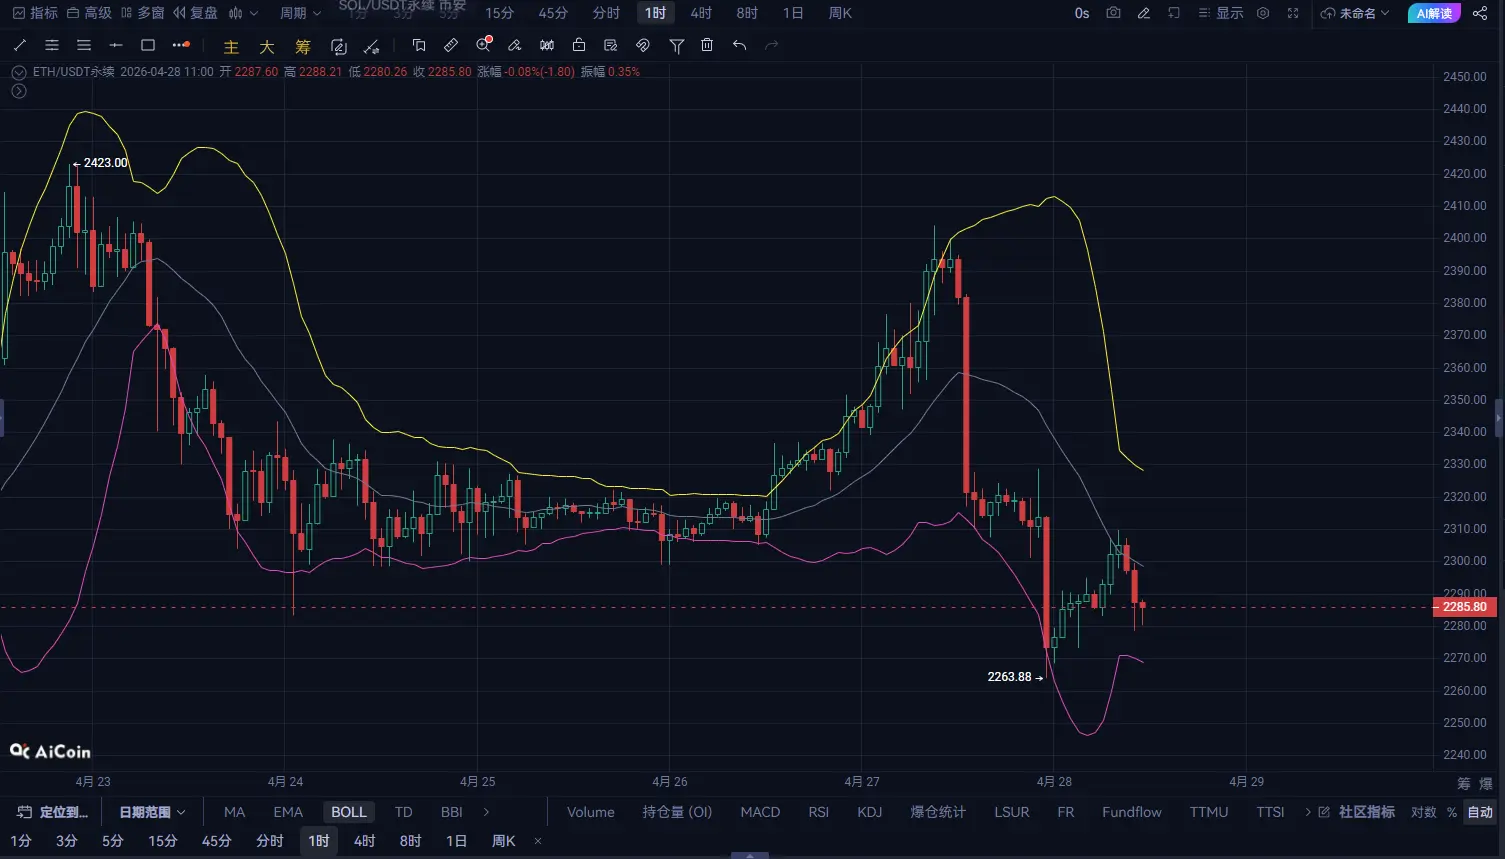
Pattern of “spike higher → pullback → weak rebound” Multiple rebounds capped around 2300 Moving averages turning downward, price trading below the averages MACD bearish momentum gradually strengthening
Short-term rhythm: Weak rebound + stair-step decline
If unable to regain stability above the 2300-2320 range:
More likely to decline sideways intraday First test support around 2260 If broken, may extend to the 2230 area
Direction: Short (market order to open position)
Entry Price: Around 2285.80
Take Profit:
First TP: 2263 (approximately -1%) Second TP: 2240 (approximately -2%)
Stop Loss:
Stop Loss Level: 2320 (approximately +1.5%)