Futures
Access hundreds of perpetual contracts
TradFi
Gold
One platform for global traditional assets
Options
Hot
Trade European-style vanilla options
Unified Account
Maximize your capital efficiency
Demo Trading
Introduction to Futures Trading
Learn the basics of futures trading
Futures Events
Join events to earn rewards
Demo Trading
Use virtual funds to practice risk-free trading
Launch
CandyDrop
Collect candies to earn airdrops
Launchpool
Quick staking, earn potential new tokens
HODLer Airdrop
Hold GT and get massive airdrops for free
Pre-IPOs
Unlock full access to global stock IPOs
Alpha Points
Trade on-chain assets and earn airdrops
Futures Points
Earn futures points and claim airdrop rewards
ETH loses key support! 2270 becomes the dividing line between bulls and bears. Is this drop a shakeout or a trend reversal?
Current Price: 2273.33
Compared to yesterday’s high-volatility fluctuations, ETH has begun to show substantial signs of weakening. The price decline is not the main point; the key is— the structure is changing. If you are still viewing the current market with a “volatility mindset,” it’s easy to be repeatedly liquidated.
Let’s directly analyze the three timeframes.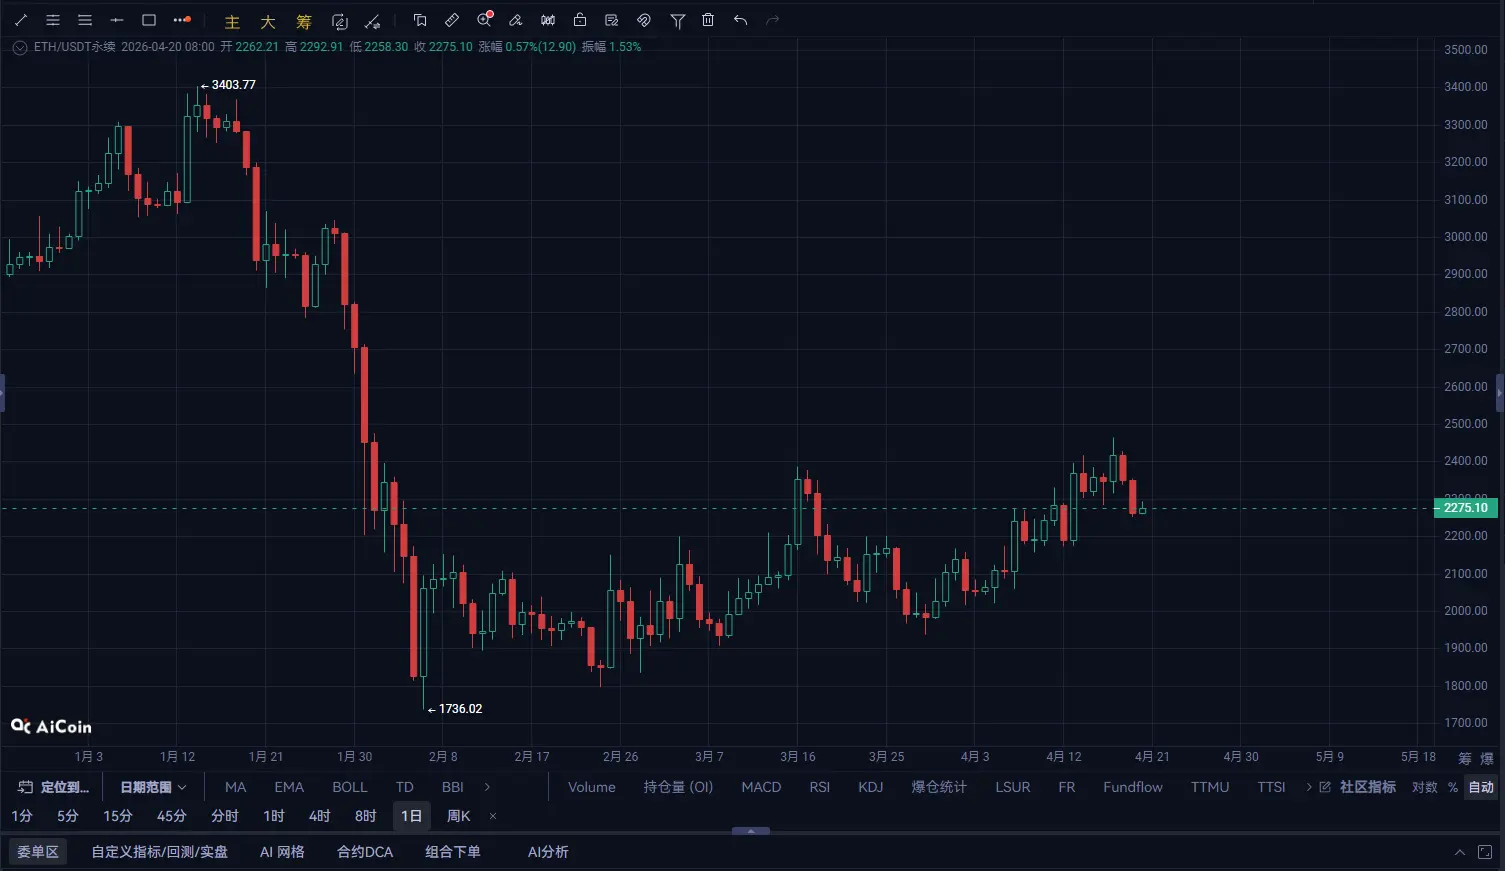
The daily chart is the core for judging the overall trend, and it has already issued a warning signal:
Consecutive high-level oscillations followed by a bearish candlestick → Bears gaining momentum
No new highs at the peak, indicating a potential top formation
MACD red bars significantly shortened, approaching a death cross
RSI drops below 60, entering a weak zone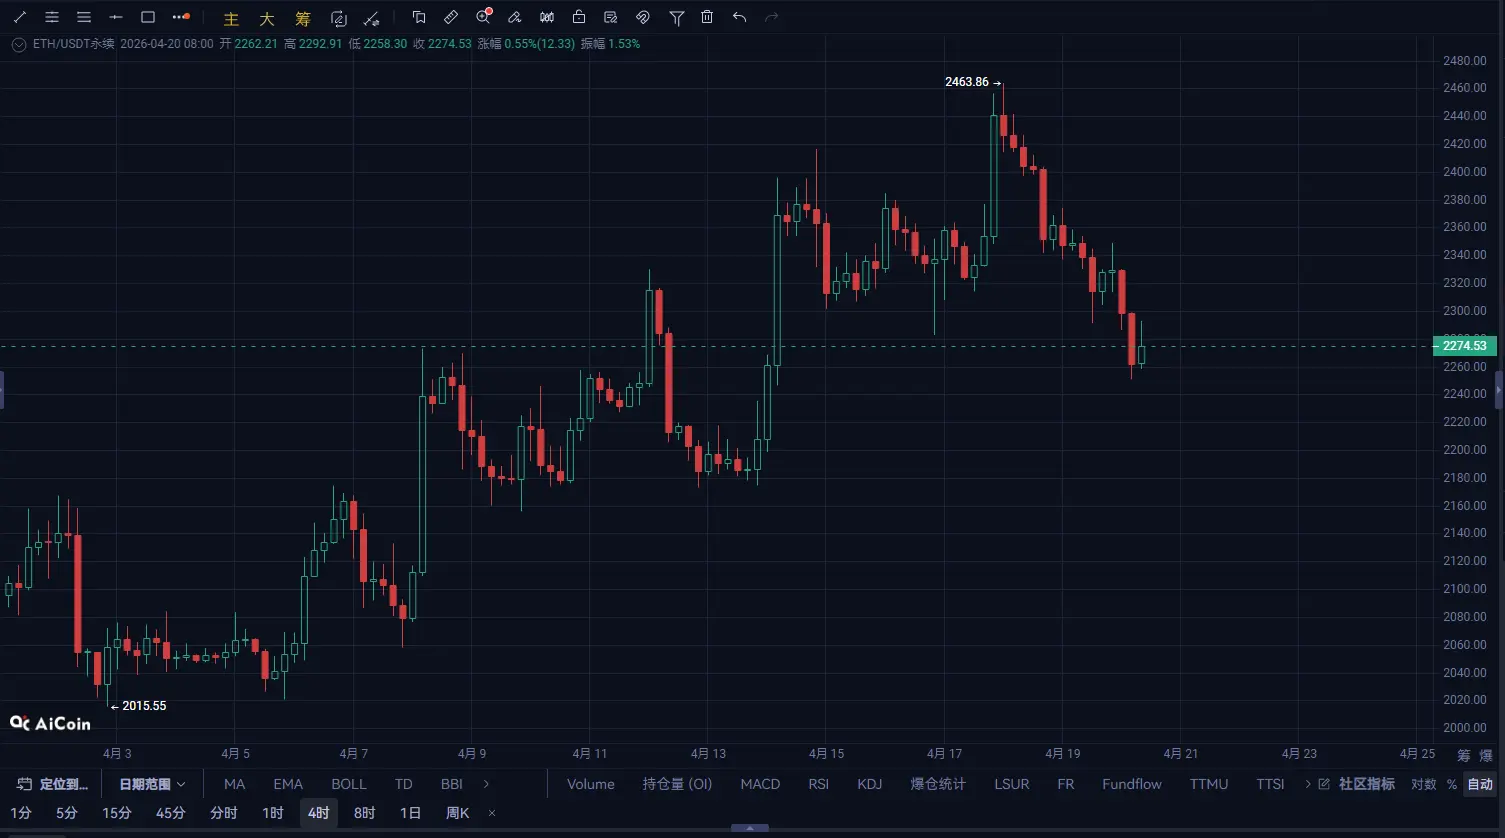
The 4-hour chart is now very clear:
Break below the lower boundary of the consolidation zone (original support at 2300)
Structure shifts from “sideways” to “downward”
Rebound heights gradually decreasing
Technical analysis:
MACD death cross and moving below zero line → Bearish trend confirmed
Bollinger Bands opening downward → Volatility releasing
Falling volume on declines, decreasing volume on rebounds → Standard bearish rhythm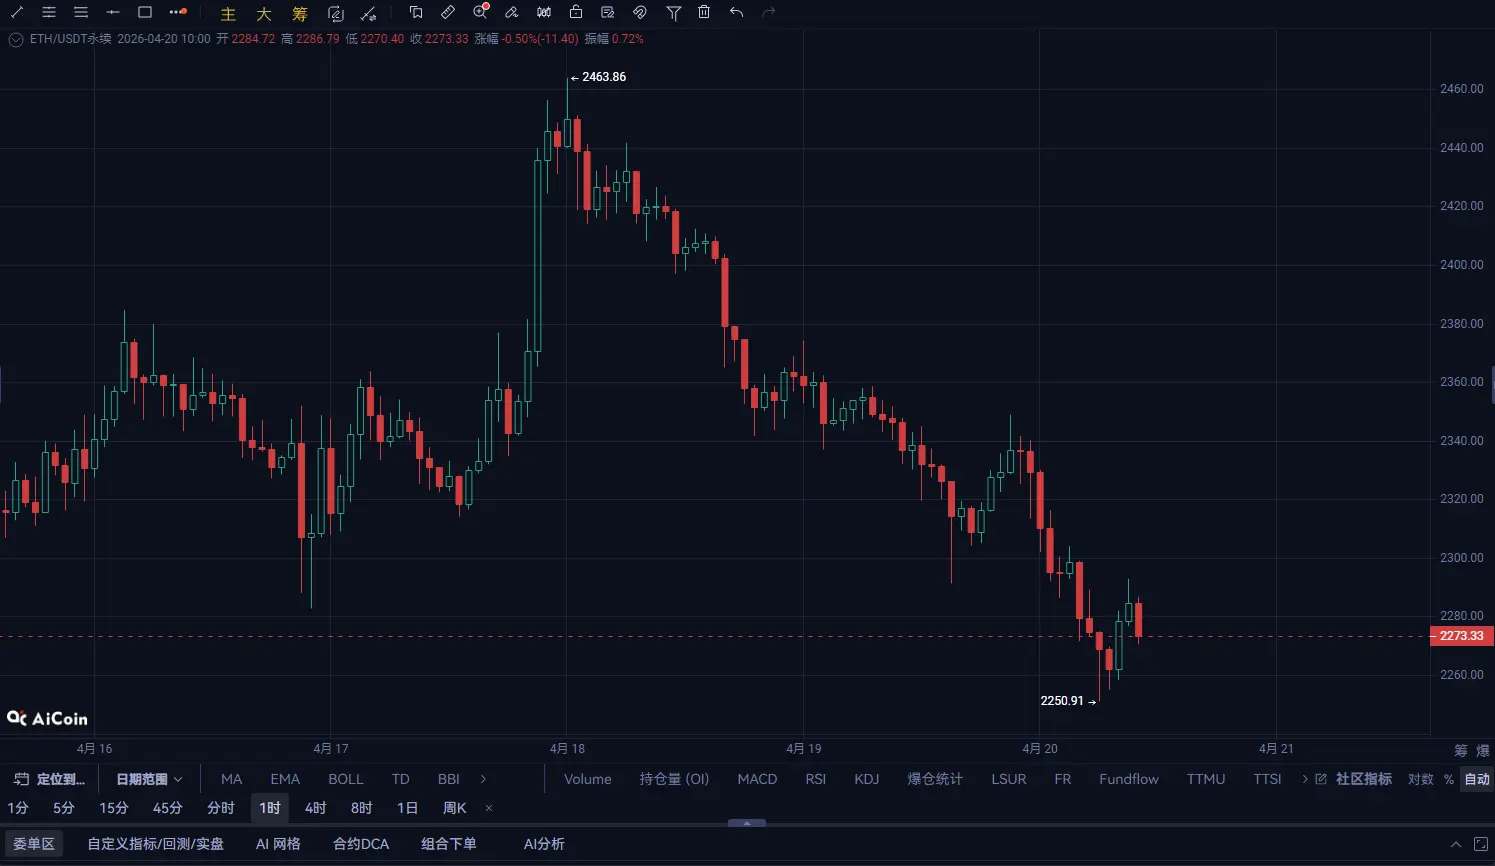
Short-term has entered a typical bearish trend:
Moving averages in a bearish alignment (MA20/MA60 clearly suppressed)
Weak rebounds, forming a “weak bounce + further decline” structure
MACD continues to expand
Current rhythm:
Downtrend → Rebound → Break lower again
Summary of structure: ETH is entering a “trend switching critical point”
The current three timeframes show consistent signals:
Daily: Decelerating upward momentum
4-hour: Break downward, turning bearish
1-hour: Bearish continuation
This indicates:
ETH is no longer just oscillating but is attempting to enter a downtrend
【ETH Today’s Short Position Strategy】
Entry point: 2273.33
First take profit: 2270.55
Second take profit: 2268.68
Stop-loss: 2276.68