Futures
Access hundreds of perpetual contracts
TradFi
Gold
One platform for global traditional assets
Options
Hot
Trade European-style vanilla options
Unified Account
Maximize your capital efficiency
Demo Trading
Introduction to Futures Trading
Learn the basics of futures trading
Futures Events
Join events to earn rewards
Demo Trading
Use virtual funds to practice risk-free trading
Launch
CandyDrop
Collect candies to earn airdrops
Launchpool
Quick staking, earn potential new tokens
HODLer Airdrop
Hold GT and get massive airdrops for free
Pre-IPOs
Unlock full access to global stock IPOs
Alpha Points
Trade on-chain assets and earn airdrops
Futures Points
Earn futures points and claim airdrop rewards
Bitcoin Market Structure and Current Position
Bitcoin’s current price action places it at a critical level within the overall market cycle. Trading near the $75K–$76K zone, the asset is positioned just below a major resistance area that has repeatedly limited upward movement. Despite multiple rejections, Bitcoin has not shown any significant breakdown. Instead, it continues to form higher lows, indicating that buyers are gradually gaining control.
This pattern suggests that the market is in a re-accumulation phase, where selling pressure from short-term traders is being absorbed by stronger hands. Over time, this reduces available supply and increases the likelihood of a breakout.
The structure can best be described as a compression range, where price volatility decreases while pressure builds. Such conditions are often followed by strong directional moves once the market escapes the range.
1-Hour Timeframe Analysis
When we shift to the 1-hour timeframe, the market reveals more precise trading opportunities. This timeframe highlights the ongoing battle between buyers and sellers within a defined range.
Support Zones
The support levels on the 1-hour chart are acting as key areas where buying interest consistently appears.
$75,000 serves as immediate support and a psychological level
$74,200 represents a stronger support where demand has been visible
$73,000 stands as a major demand zone, unlikely to break easily without strong selling pressure
Each time the price approaches these zones, buyers step in, preventing deeper declines and reinforcing the bullish structure.
Resistance Zones
On the upside, Bitcoin is facing strong resistance that has limited its ability to move higher.
$76,800acts as immediate resistance
$77,500 – $78,000 forms a strong supply zone where sellers dominate
$80,000 remains the key breakout level that could trigger a major rally
These resistance levels are critical because repeated rejections indicate the presence of large sell orders. However, the fact that price continues to revisit these zones suggests growing buying strength.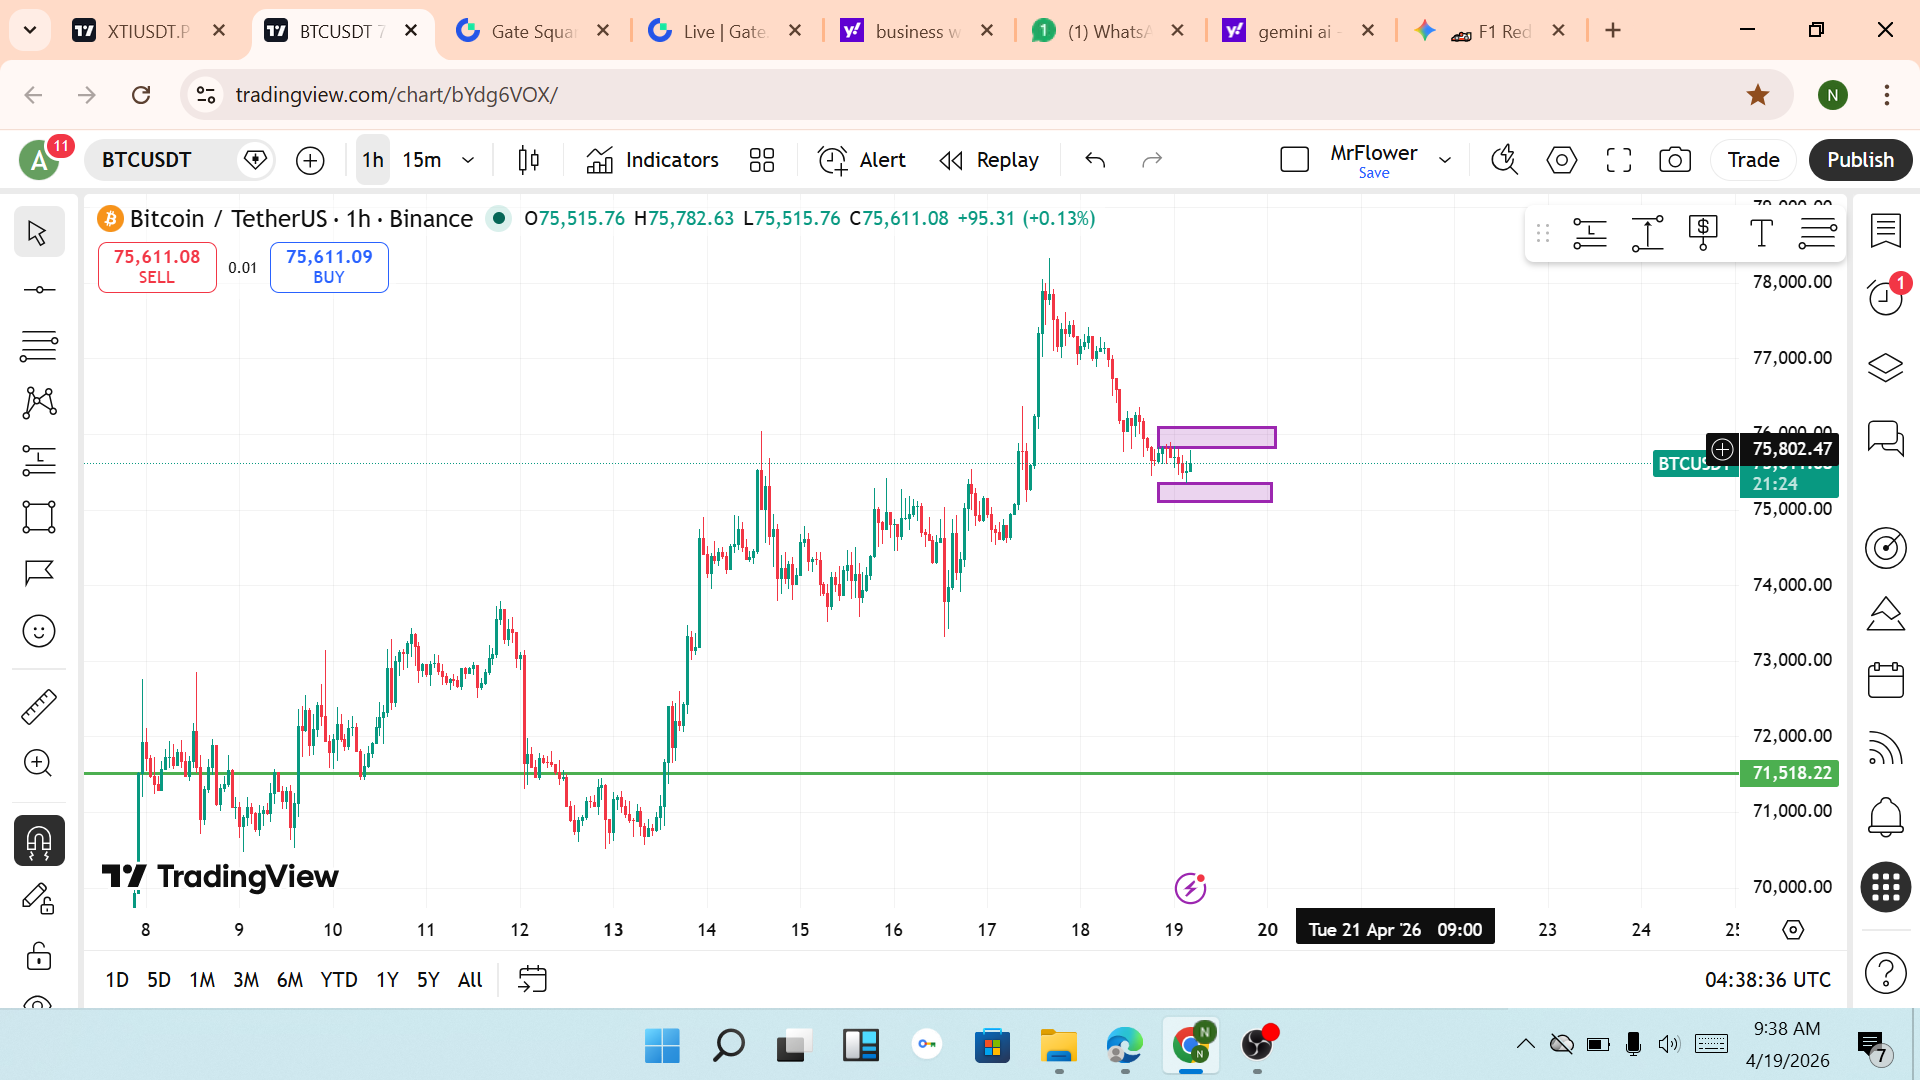
Market Behavior and Price Compression
The interaction between rising support and stable resistance has created a tight trading range. This range is gradually narrowing, forming a structure where price movement becomes more compressed over time.
Such compression is one of the most important signals in trading. It reflects a balance between supply and demand that cannot last indefinitely. Eventually, the market is forced to choose a direction, often resulting in a strong breakout accompanied by increased volatility.
In the current scenario, the formation of higher lows suggests that the pressure is building toward the upside, although confirmation is still required.
Trade Strategy: Long vs Short
Understanding whether to take a long or short position depends on how the market behaves around key levels rather than predicting direction blindly.
Long Trade Scenario
A long position becomes favorable when the market shows clear strength. This can occur if Bitcoin:
Holds firmly above the $75,000 support level
Breaks above $76,800 resistance with strong momentum
Successfully retests the breakout level and continues upward
In such a scenario, the next targets would likely be:
$77,500
$78,000
$80,000
Risk management remains essential, with a logical stop loss placed below the support zone to protect against unexpected reversals.
Short Trade Scenario
A short position becomes relevant if the market shows weakness near resistance. This typically happens when:
Price is rejected from the $77,500 – $78,000 zone
Momentum weakens at higher levels
A false breakout occurs, trapping buyers before reversing downward
In this case, potential downside targets include:
$75,500
$75,000
$74,200
A stop loss above resistance is necessary to limit risk if the market unexpectedly breaks upward.
Which Direction Is More Likely?
At present, the market does not show a confirmed breakout in either direction. However, the formation of higher lows and consistent buying at support levels suggests a slight bullish bias.
This does not mean the market will immediately move upward, but it indicates that buyers are gradually gaining strength. Until resistance is broken, the market remains in a range-bound condition, offering opportunities on both sides for disciplined traders.
Impact on Altcoins
Bitcoin’s consolidation is directly contributing to the strength of altcoins. When Bitcoin stabilizes and volatility decreases, traders often shift their focus toward altcoins in search of higher returns.
This leads to increased liquidity in smaller assets, resulting in stronger price movements across the altcoin market. The current rally is therefore not isolated but part of a broader cycle dynamic where capital flows outward from Bitcoin.
Risk Considerations
Despite the opportunities, the market carries several risks. Resistance levels remain strong, and failure to break above them could extend the consolidation phase. Profit-taking by short-term traders can also create sudden pullbacks.
Additionally, external factors such as global economic conditions and liquidity changes can influence market behavior. Traders must remain cautious and avoid overexposure during uncertain conditions.
Final Outlook
Bitcoin is currently positioned within a critical range that will determine the next phase of the market. The zone between $75,000 and $78,000 is acting as a battlefield between buyers and sellers.
A breakout above $80,000 would likely trigger a strong bullish trend
Continued rejection could lead to extended consolidation
At the same time, altcoins are gaining momentum, reflecting increasing confidence and capital flow within the market.
Conclusion
The current market environment represents a period of quiet buildup rather than explosive movement. Bitcoin, holding around $75K–$76K, is forming a strong structural base while altcoins begin to rally.
On the 1-hour timeframe, clear support and resistance levels provide valuable guidance for short-term trading decisions. Long positions are favored near support or on confirmed breakouts, while short positions remain valid near strong resistance zones.
This phase demands patience, discipline, and strategic thinking. The market is not yet in full expansion, but the conditions being formed now suggest that a significant move may be approaching
#AltcoinsRallyStrong