Futures
Access hundreds of perpetual contracts
TradFi
Gold
One platform for global traditional assets
Options
Hot
Trade European-style vanilla options
Unified Account
Maximize your capital efficiency
Demo Trading
Introduction to Futures Trading
Learn the basics of futures trading
Futures Events
Join events to earn rewards
Demo Trading
Use virtual funds to practice risk-free trading
Launch
CandyDrop
Collect candies to earn airdrops
Launchpool
Quick staking, earn potential new tokens
HODLer Airdrop
Hold GT and get massive airdrops for free
Pre-IPOs
Unlock full access to global stock IPOs
Alpha Points
Trade on-chain assets and earn airdrops
Futures Points
Earn futures points and claim airdrop rewards
The SOL critical point has been reached! The 85-level is surging with hidden currents; will it be a main upward wave or a deep correction? We'll find out tonight.
Current Price: 85.63
SOL’s recent movement is very interesting—unlike BTC’s high-level oscillation, nor ETH’s compression and convergence, it more resembles a “strong rebound edge” in the early divergence phase. To put it simply: the direction will be revealed soon, but right now it’s still in the “deception phase.”
Let’s analyze the structure directly.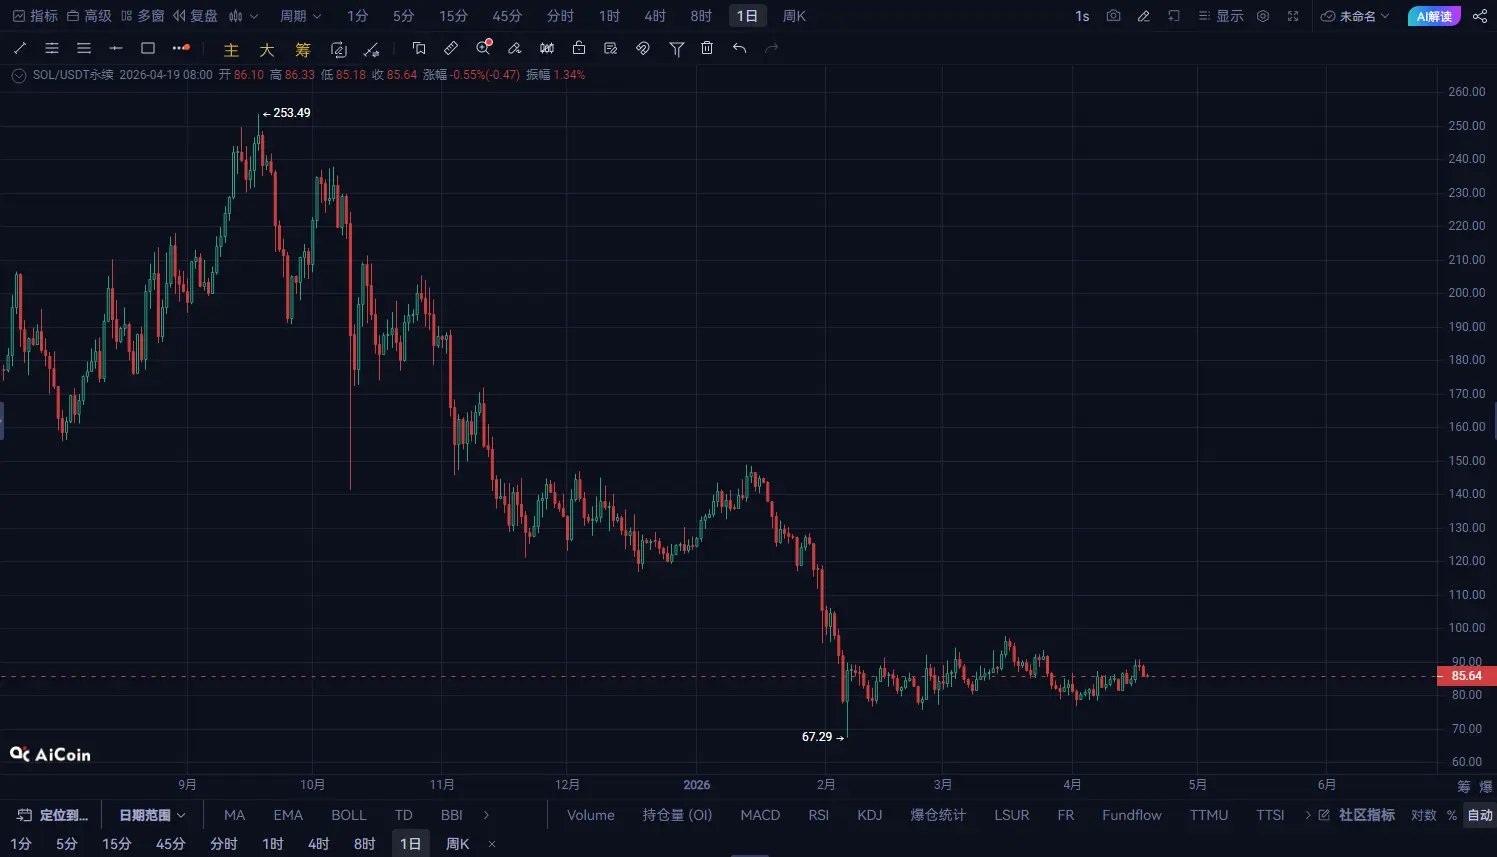
The daily chart still maintains a medium-term bullish structure, but there are several very key signals:
Key levels:
Conclusion: The daily chart has shifted from “unilateral rise” to “consolidation after rise,” indicating a healthy correction. But if it falls below 76, the structure will weaken.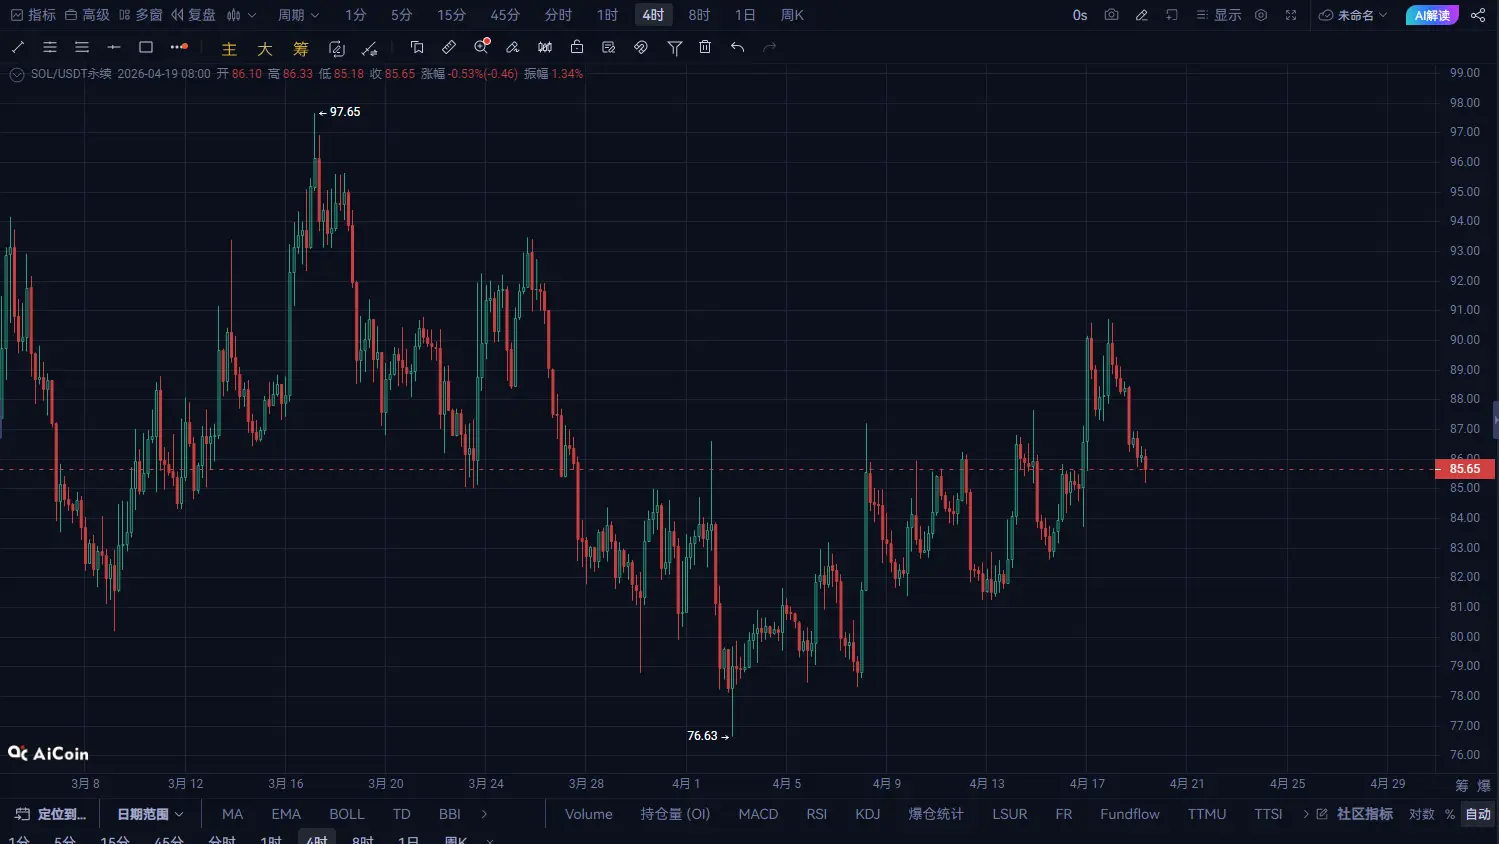
The 4-hour is currently the most critical cycle because it has shown signs of weakening before the daily:
Technical performance:
The essence of the current structure:
Key zones:
In the short term, the trend is very clear:
This is a typical:
Short-term key levels:
As long as the rebound cannot surpass 87, the bearish rhythm remains unchanged.
Compared to the overall market:
This indicates an important message: Funds are already taking profits on SOL.
Trading strategies (key points)
Short-term strategy (currently optimal)
Logic: 4-hour + 1-hour resonance bearish signals
Consider only two positions:
Light long near 80
Re-enter strong support zone around 76
Must set stop-loss, as a breakdown will accelerate the decline.
The most dangerous point for SOL now is:
Don’t be fooled by small rebounds.