Futures
Access hundreds of perpetual contracts
TradFi
Gold
One platform for global traditional assets
Options
Hot
Trade European-style vanilla options
Unified Account
Maximize your capital efficiency
Demo Trading
Introduction to Futures Trading
Learn the basics of futures trading
Futures Events
Join events to earn rewards
Demo Trading
Use virtual funds to practice risk-free trading
Launch
CandyDrop
Collect candies to earn airdrops
Launchpool
Quick staking, earn potential new tokens
HODLer Airdrop
Hold GT and get massive airdrops for free
Pre-IPOs
Unlock full access to global stock IPOs
Alpha Points
Trade on-chain assets and earn airdrops
Futures Points
Earn futures points and claim airdrop rewards
ETH breaks through 2400 and undergoes short-term consolidation; whether it can break through 2460 again becomes a key!
Current Price: 2422.06
ETH has recently shown strong market performance. After a period of consolidation and fluctuation, it successfully broke through 2400, approaching the previous high near 2460. The current price remains within a short-term consolidation zone, but once the resistance line is broken, the future trend still carries significant uncertainty. Next, we will analyze ETH’s movement across daily, four-hour, and one-hour charts to help you make more informed decisions.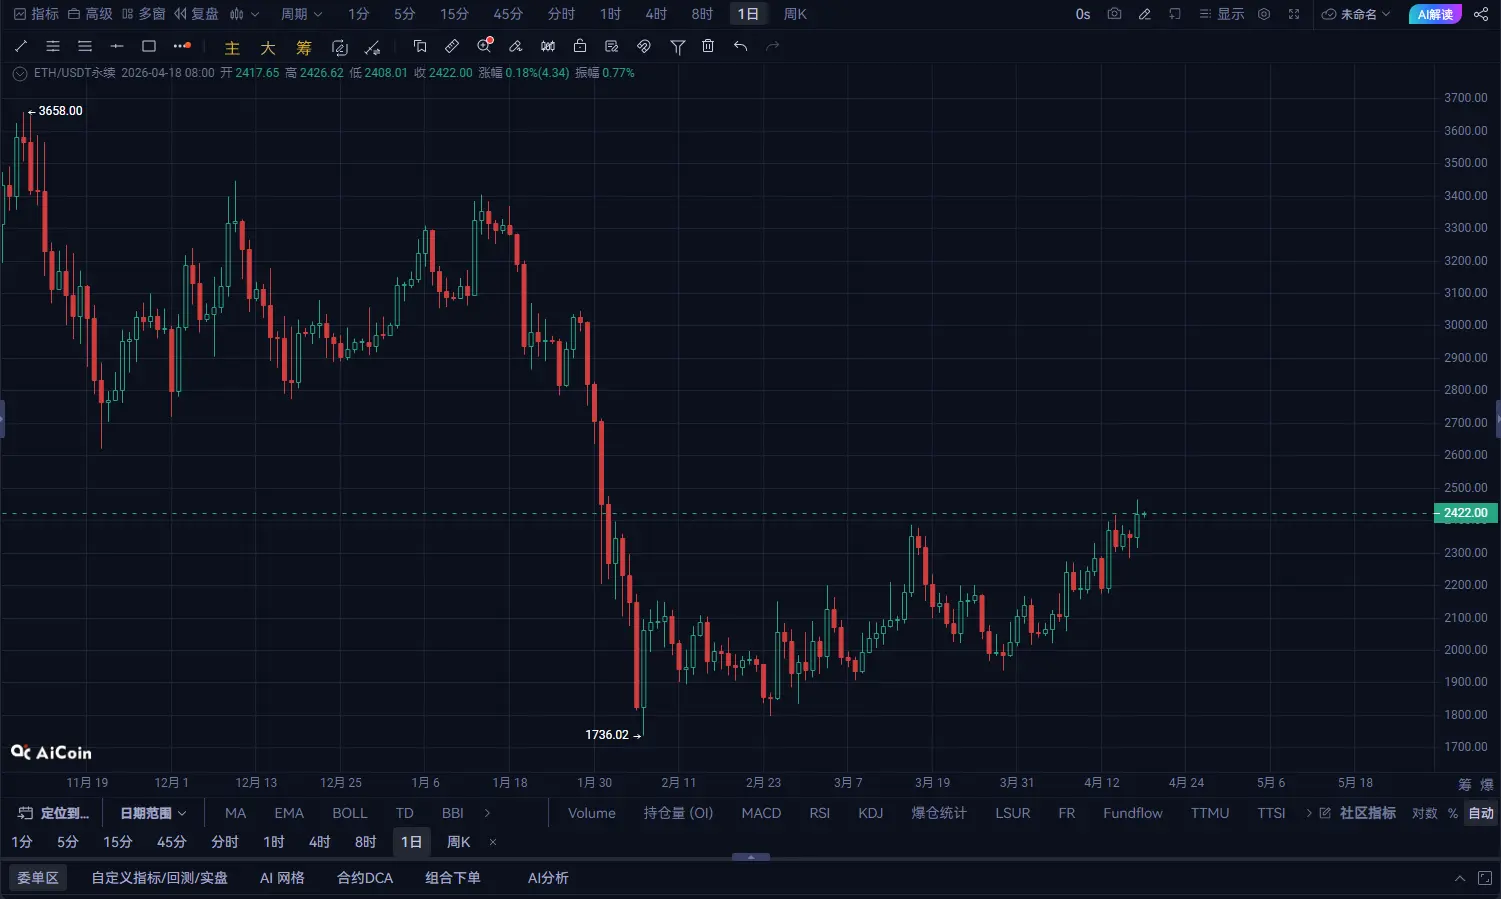
The daily chart shows ETH’s strong upward trend:
The low point at 2173.00 has confirmed support Price broke through the previous resistance zone at 2400, entering a strong upward phase Current price is within the 2400-2450 range, close to the previous high of 2460
This indicates:
👉 ETH’s upward trend has not been broken and remains in a strong bullish state. 👉 Currently near the previous resistance zone, a breakout could trigger a new wave of upward movement.
Key levels:
Support: 2300 / 2250 Resistance: 2450 / 2460 Daily conclusion: Trend: Bullish, not changed, strong upward movement Status: Consolidating, may continue higher after breaking resistance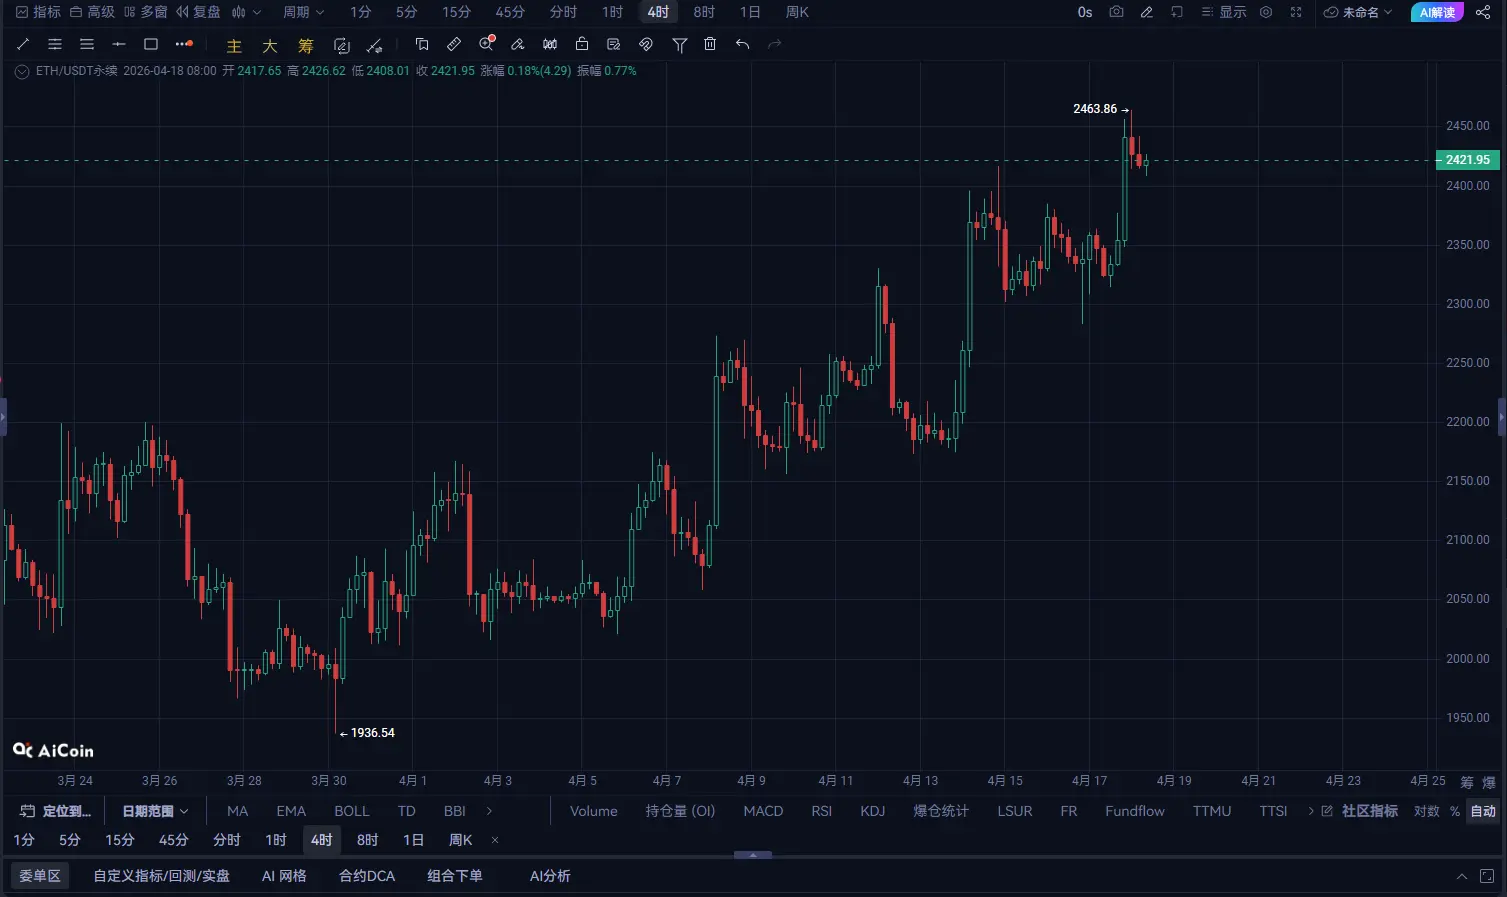 2. Four-Hour Chart Level: Breakout followed by consolidation, momentum still ample
The four-hour chart shows ETH currently in a consolidation phase:
After breaking 2400, price entered a range-bound zone, with significant resistance above, oscillating between 2420-2440 Four-hour candlesticks display consolidation characteristics, gradually approaching the 2460 resistance level Short-term pullbacks are small, and momentum remains sufficient
This suggests:
👉 The current price is in a short-term consolidation phase, with market sentiment relatively stable. 👉 If ETH breaks 2460, it could push further upward, targeting 2500.
Key levels:
Support: 2380 / 2350 Resistance: 2460 / 2500 Four-hour conclusion: Trend: Consolidating, but upward momentum Status: Waiting for a breakout above 2460 to confirm further gains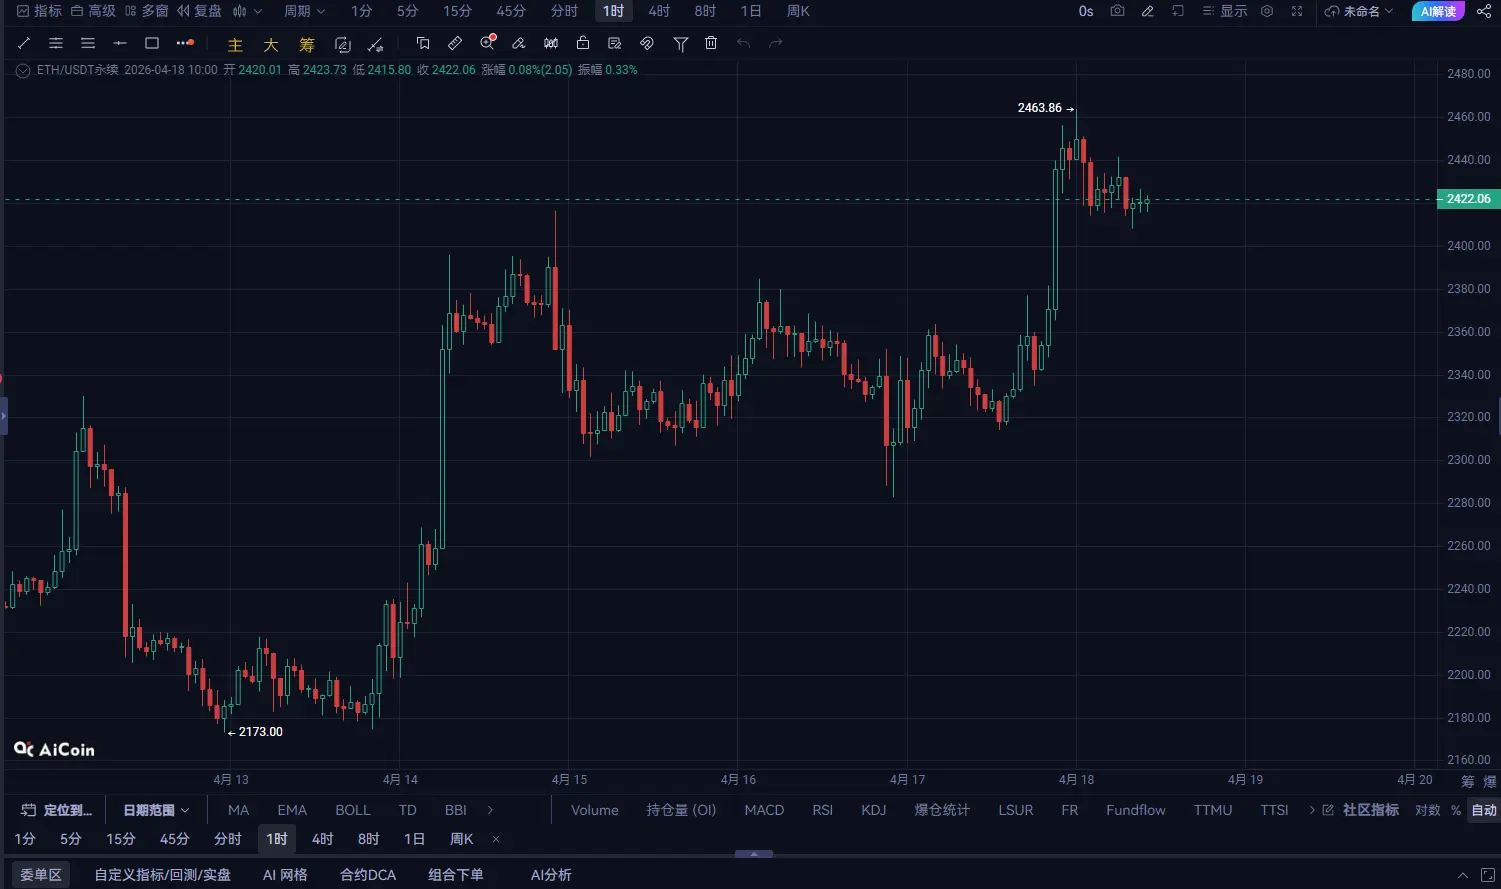 3. One-Hour Chart Level: Short-term consolidation, waiting for key breakout
The one-hour chart shows a typical short-term consolidation pattern:
Price repeatedly oscillates within the 2400-2450 range, failing to break 2450 effectively Long upper and lower shadows indicate intense battle between bulls and bears Currently near 2420, still some distance from breaking 2460
This indicates:
👉 In the short term, market sentiment is relatively stable, but there is a lack of breakout momentum. 👉 If the price breaks 2450 and stabilizes, it may continue upward toward 2460 or even 2500.
Key levels:
Support: 2400 / 2380 Resistance: 2450 / 2460 One-hour conclusion: Trend: Consolidating, not breaking key resistance Status: Waiting for a breakout above 2450 to confirm upward momentum 4. Overall Assessment
ETH’s current overall trend is very healthy, having entered a consolidation phase after breaking 2400. The key next step is whether it can break through the 2460 resistance zone. If successful, ETH could continue toward 2500 or higher. If it fails to break through, a consolidation or pullback may occur.
Stop-loss:
2️⃣ Short Position Strategy (Short-term Consolidation)
Suitable for short-term sideways trading:
Stop-loss:
Targets:
The market is currently in a high-level consolidation zone. A breakout could lead to further gains, but if it fails to break 2460, the risk of a pullback remains. Investors should operate cautiously, waiting for confirmed breakout signals before making decisions.