Futures
Access hundreds of perpetual contracts
TradFi
Gold
One platform for global traditional assets
Options
Hot
Trade European-style vanilla options
Unified Account
Maximize your capital efficiency
Demo Trading
Introduction to Futures Trading
Learn the basics of futures trading
Futures Events
Join events to earn rewards
Demo Trading
Use virtual funds to practice risk-free trading
Launch
CandyDrop
Collect candies to earn airdrops
Launchpool
Quick staking, earn potential new tokens
HODLer Airdrop
Hold GT and get massive airdrops for free
Pre-IPOs
Unlock full access to global stock IPOs
Alpha Points
Trade on-chain assets and earn airdrops
Futures Points
Earn futures points and claim airdrop rewards
The true intention behind ETH's sideways movement at high levels: Is it a continuation of the main rally or a trap to lure more buyers? This round of choices will determine the direction!
Current Price: 2327.46
From the overall structure, ETH has completed a very standard three-phase market cycle: bottom reversal → trend rally → high-level consolidation. It is currently in the most critical stage:
👉 High-level oscillation zone = direction selection zone
Next, let’s break down the three major cycles.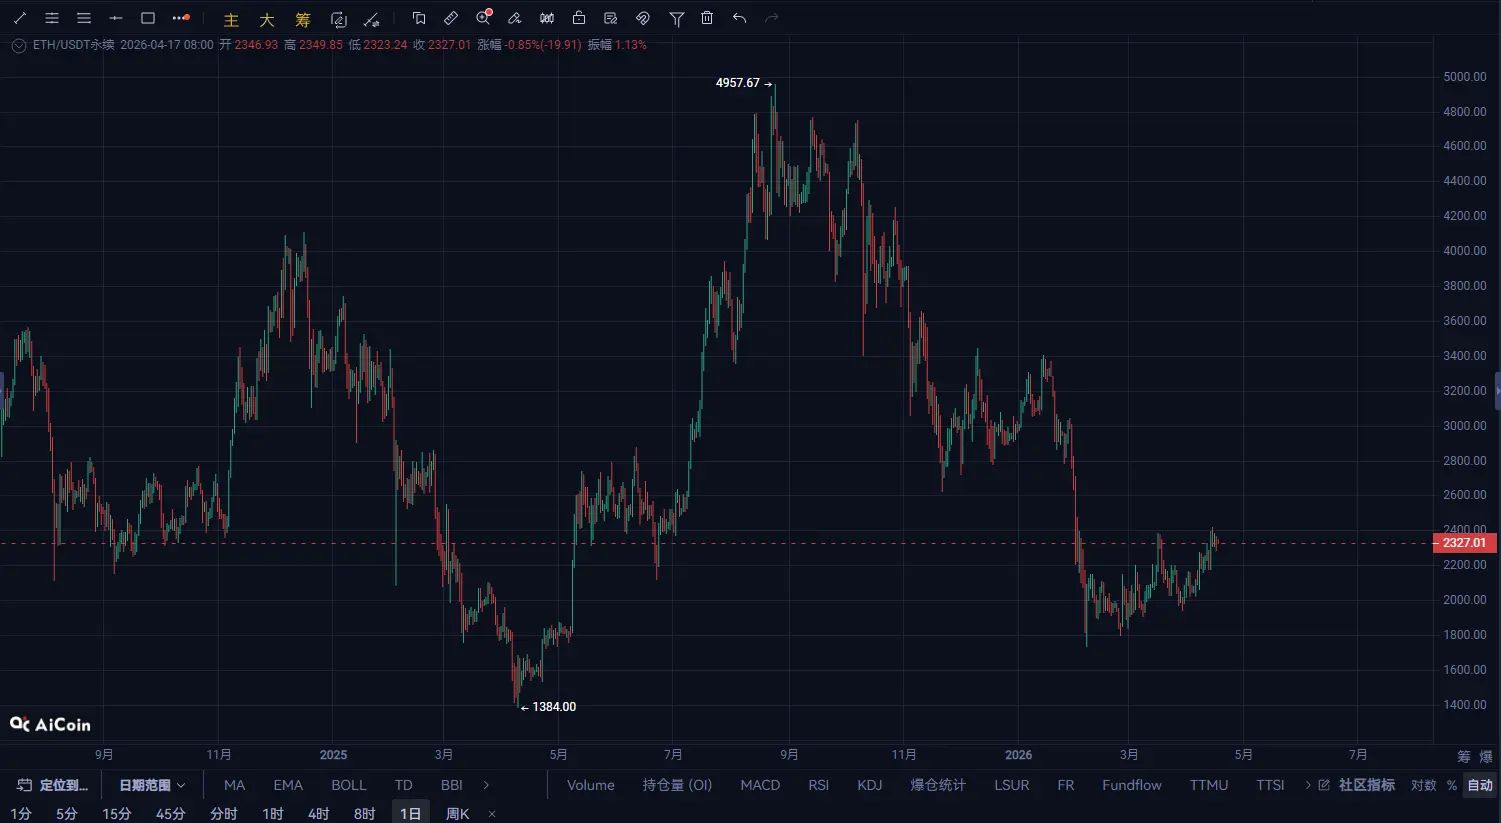
The daily structure is very clear:
Bottom at 1936 completes a phased bottoming Subsequently, continuous higher lows form an uptrend Highs reach 2416 before pulling back
Currently showing as:
👉 High-level sideways + upward structure maintained
But pay attention to two key points:
Highs have not made new highs Consecutive oscillating candlesticks appear
Indicates:
👉 Bulls are beginning to enter the “chip digestion phase”
Daily conclusion: Trend: Bullish remains State: Consolidation after rally
Key levels:
Support: 2250 / 2200 Resistance: 2400 / 2450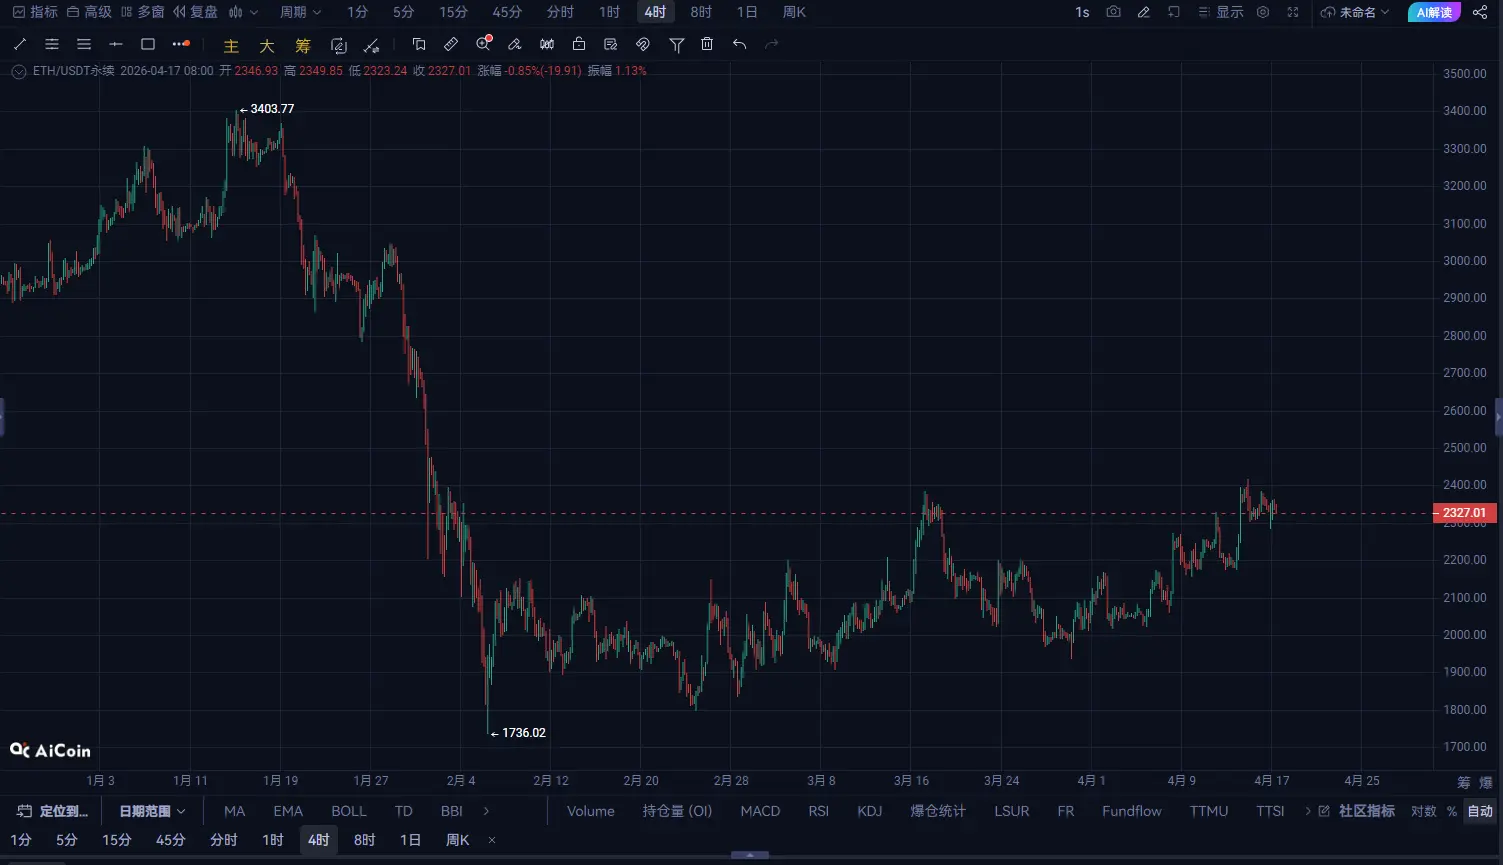 2. Four-hour level: structure oscillates, top pattern not formed but caution needed
The four-hour structure is more meaningful:
High: 2416 forms obvious resistance Pullback stops near 2250 Current rebound but no new high
Forming structure:
👉 High-level box oscillation (2250 - 2400)
This is a typical:
Bullish continuation or Early head formation
The key point is:
👉 Whether it can effectively break through 2400
Four-hour key signals: If volume breaks through 2400 → continuation of main rally If repeated failure to push higher → increased probability of weakening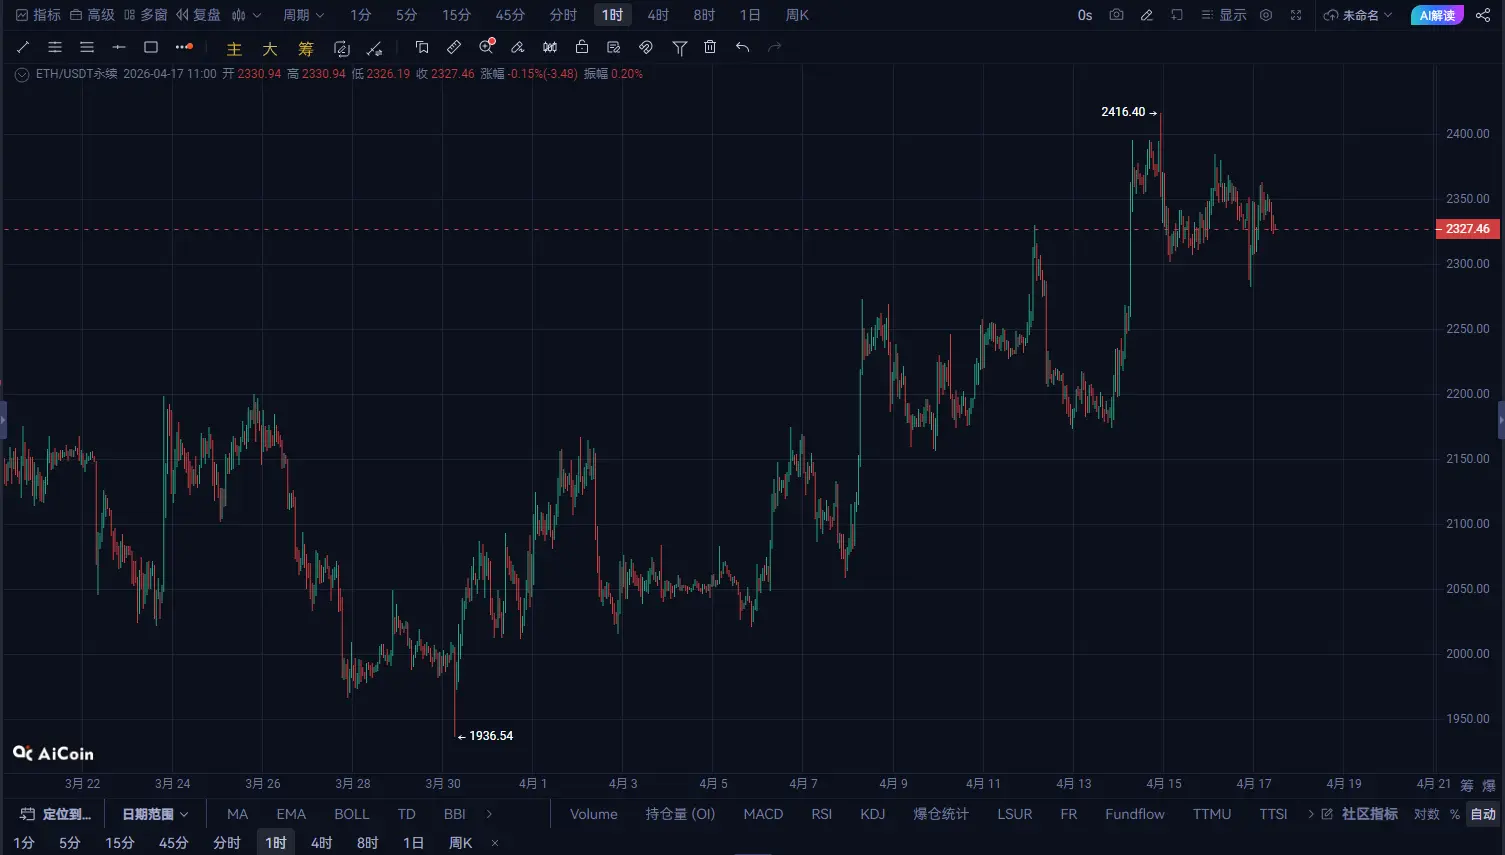 3. One-hour level: short-term weakening, bears begin to probe
The one-hour structure has already shown detailed changes:
Highs gradually decreasing Rebound strength weakening Multiple attempts to push higher followed by pullbacks
Indicates:
👉 Short-term funds are starting to withdraw
Current rhythm:
👉 Oscillation leaning weak
One-hour key levels: Above: Resistance at 2350 Below: Support at 2280 4. Summary of core logic
Currently ETH is in:
Daily: consolidation within an uptrend Four-hour: range oscillation One-hour: short-term weakness
👉 In essence, one sentence:
The main trend is fine, but the short-term is adjusting
Prioritize two scenarios:
① Pullback to buy
Buy low in the 2250-2280 range
Stop-loss:
Below 2200
Target:
2350 → 2400
② Breakout chase
Volume breakout above 2400
Target:
2450 → 2500 2️⃣ Short position strategy (short-term)
Suitable for short-term trading:
Short at resistance in the 2350-2400 range
Stop-loss:
Above 2420
Target:
2280 → 2250 3️⃣ Most important current principle
❌ Avoid frequent operations in the 2300 middle zone ❌ Avoid emotional chasing of rallies
Must be alert to two signals:
1️⃣ Break below 2250
👉 May enter daily-level correction 👉 Target 2200 or even 2100
2️⃣ Multiple failed attempts to break 2400
👉 Forming a “false breakout structure” 👉 Easily triggers rapid decline
ETH is not weak now, but:
👉 Waiting for the next direction choice