Share crypto content and earn up to 60% commissions through content mining.
placeholder
gatefun
This move is really a bit ridiculous! 🚨📉 A few days ago at the early morning it was still pretending to be strong, but the moment it hit the resistance above, it just turned soft. When I saw $INTC ’s condition, I knew—this wasn’t a hard pull, it was increasingly becoming full-on stop-trading-induce-buying.
During the intraday attempt to grind the top, the price kept failing to push through repeatedly. Volume couldn’t keep up, and the moment selling pressure got pressed down, everything changed face. What I pointed out then was: don’t get fooled by that pump. You can track the short positions
INTC-5.97%
BTC-1.04%
ETH-2.28%
View Original
post-image
  • Reward
  • Comment
  • Repost
  • Share
TODAY MARKET UPDATES
gate liveLIVE
1,974
  • Reward
  • Comment
  • Repost
  • Share
No big pattern—this profit even surprised me. When the chart hadn’t fully started yet, $JCT kept grinding back and forth at the bottom. I saw a base forming, but it didn’t break. The support below didn’t weaken either. Right around 0.003230, I took a long position according to plan.

Now the price has pushed to 0.004038, with a return of +614.63%—it literally took off. This piece of meat feels great. Anyone who held on earlier and didn’t give in today should be pretty happy ✨

Some money isn’t made by impulsiveness.

As for the position, I’ll take profits first: sell 80%, and move the rema
JCT-9.05%
BTC-1.04%
ETH-2.28%
View Original
post-image
  • Reward
  • Comment
  • Repost
  • Share
Review this trade. $USELESS moved sideways from a high point, then broke down and pressed lower—the rhythm was actually clear, it’s just that there was too much noise during the process. Everyone was watching the rebound ahead of time; what I cared about was whether, after the rebound, it could hold its ground. The chart gave a very cold answer.
After going short around 0.07658, I didn’t rush to watch short-term fluctuations. The key was this: as long as the retest doesn’t bounce back and regain the level, the short-side structure is still intact. After that, price kept getting pushed down to
USELESS-16.63%
BTC-1.04%
ETH-2.28%
View Original
post-image
  • Reward
  • Comment
  • Repost
  • Share
I want to sleep
But I want money
But I really want to sleep
But I really want money
post-image
  • Reward
  • Comment
  • Repost
  • Share
Tomorrow is another day to try and make money.. Goodluck
post-image
  • Reward
  • Comment
  • Repost
  • Share
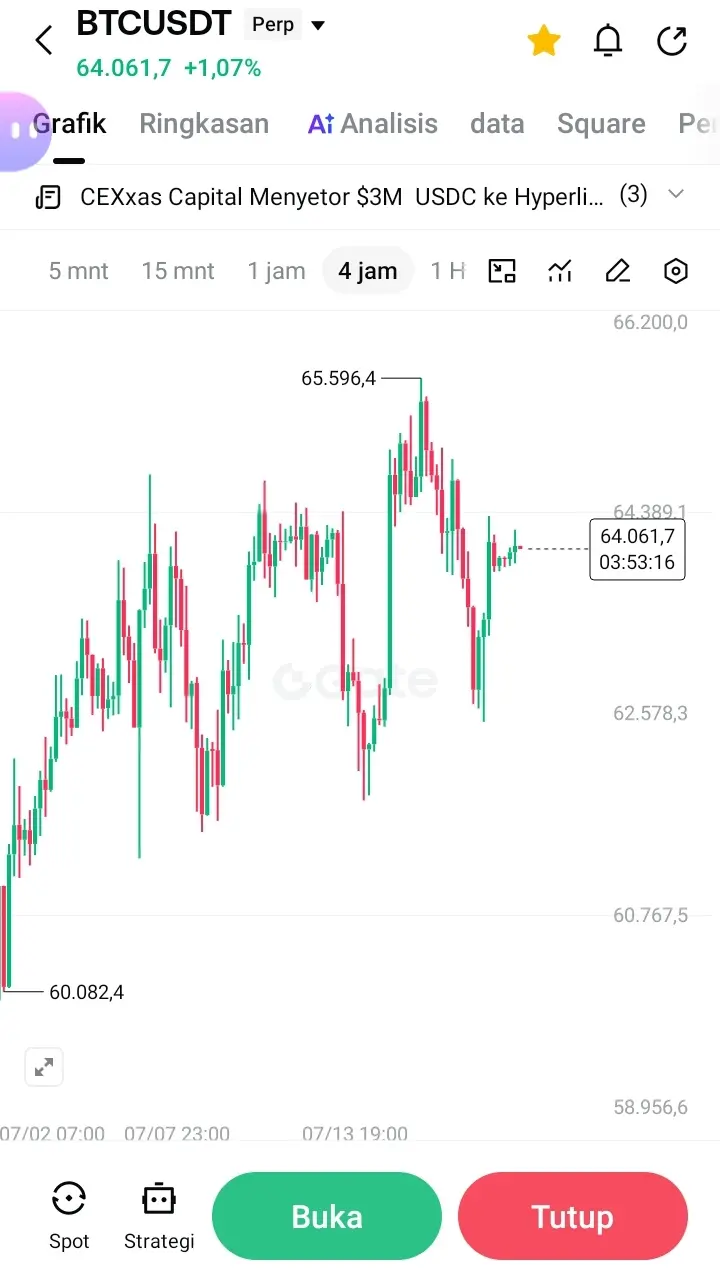
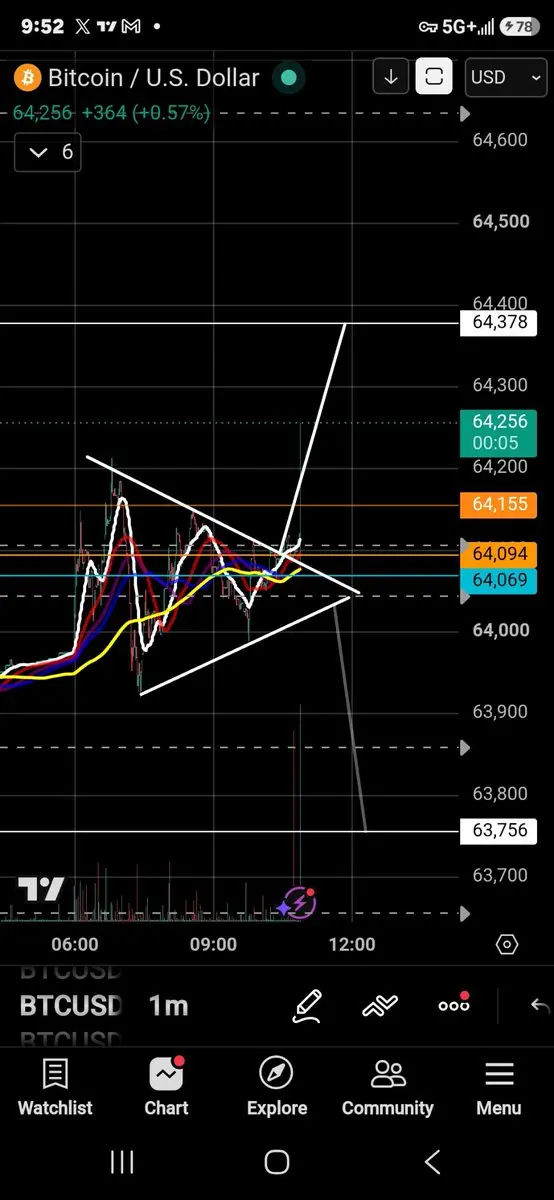
BTC H1 Chart Structure 17 July 2026
The current BTC price is 64,197.30 and has just been rejected from the Supply zone in the range 64,600 to 65,600 after a rally from the swing low on 14 July in the 61,600 area. This is a classic rejection pattern from the supply zone.
The MACD also supports this bias: both the MACD line and the signal line are both declining after the previous bullish momentum started to run out; the histogram is turning red again, indicating bearish short-term momentum is forming.
Below the current price, there are two demand levels that are logical targets: the first deman
BTC-1.03%
View Original
  • Reward
  • Comment
  • Repost
  • Share
I only meant to do a quick scalp trade, but it turned out to run a bit beyond expectations. A few days ago, at my last glance at the charts before bed, $COLLECT was still grinding sideways along the bottom. A lot of people said it was slow, but I actually found this type of bottoming-without-breaking the most interesting. So at the time, I directly reminded everyone to watch for a chance to go long.
After entering around 0.04356, the chart didn’t disappoint me. Now the price has come to 0.05104, and the return rate is +338.35%. This bite of profit is comfortable—no wasted sleepless hours.
I
COLLECT20.45%
BTC-1.04%
ETH-2.28%
View Original
post-image
  • Reward
  • Comment
  • Repost
  • Share
The comfortable part of this trade isn’t that people say they’re bullish only after it pumps—before the move started, the order book already showed the taste of it. $EIGEN has been pushed down ahead of time; on the surface it looks weak, but in reality the bid support at lower levels has been getting firmer and firmer.

I opened a long at 0.2145. Back then, many people were still watching the key levels above. What I was watching instead was whether anyone was stepping in to buy on the pullbacks. The key is right here: every time the price got slammed down, it failed to break through. That cl
EIGEN3.52%
BTC-1.04%
ETH-2.28%
View Original
post-image
  • Reward
  • Comment
  • Repost
  • Share
H/USDT 95% short signal—will you follow it?

$H /USDT - SHORT

Trading plan:
Entry: 0.05934 – 0.06016
SL: 0.06367
TP1: 0.05681
TP2: 0.05485
TP3: 0.05191

Why focus on this structure?
- The 1D trend is clearly bearish, and the 4h timeframe supports the short direction.
- RSI on 15m is 47.85, not oversold yet, with room for further downside.
- ATR on 1h is only 0.001633, low volatility—suitable for trend-following entry.
- Current price is 0.05975; TP1 target is 0.05681, with a reasonable risk-reward ratio.

Discussion:
Will this short hit TP1 first, or will it break through TP2 directly?
H1.79%
View Original
post-image
post-image
  • Reward
  • Comment
  • Repost
  • Share
Silver bulls are laying in around 55.6; an RSI bottoming and rebound signal has appeared

$XAG /USDT - LONG

Trade plan:
Entry: 55.52 – 55.76
SL: 54.17
TP1: 56.74
TP2: 57.48
TP3: 58.58

Why focus on this setup?
- Current $XAG /USDT price is 55.64; the 15-minute RSI is only 39.4, in the oversold zone, with ample short-term rebound momentum.
- The 4-hour trend is clearly bullish (confidence 77%); the 1-hour EMA 55.63 support is effective. With ATR 0.47 indicating moderate volatility, it’s suitable for entry.
- Key logic: Why now? Because within the daily range, 55.52-55.76 is a buy-the-dip wi
XAG-3.61%
View Original
post-image
post-image
  • Reward
  • Comment
  • Repost
  • Share
BTC & ETH Chart Overview With Market Momentum
gate liveLIVE
396
live-coin
  • Reward
  • Comment
  • Repost
  • Share
Earnings from a single one-on-one campaign on the third day
View Original
post-image
  • Reward
  • Comment
  • Repost
  • Share
JUST IN: 1inch co-founder says he was fired in 2025 after pushing for changes, and is launching a new venture. Could signal leadership shift and potential reorientation for the project. $1INCH
1INCH-1.35%
post-image
  • Reward
  • Comment
  • Repost
  • Share
This drop has been very satisfying—after holding it in for so long, it finally got released.
When $INJ was around 5.542, the order book had already given a warning: the rally had no volume, the pullback came quickly, and the rebound looked weak. Many people only noticed the price was still high, but they didn’t realize the rhythm had shifted from active attacking to passive defense—in plain terms, the momentum changed.
For this long trade, what I care about is the continuous confirmation after pressure at the high. Once it breaks below the key level, the shorts immediately take over the market
INJ-1.98%
BTC-1.04%
ETH-2.28%
View Original
post-image
  • Reward
  • Comment
  • Repost
  • Share
What's all these Alien ppl following me?!🤯👽
post-image
  • Reward
  • Comment
  • Repost
  • Share
$ANSEM is the easiest trade if it goes down to $100m
Size in, cash out around 3x, then fullport everything back into $JOTCHUA and $TRIPLET
post-image
  • Reward
  • Comment
  • Repost
  • Share
Just now, this round of selloff—many people still haven’t reacted, and $PEPE has already broken up the momentum of the long positions from the highs.

What I was watching earlier was the area around 0.000003774. The price stayed there for quite a while, but it never managed to break out effectively. Most people see it trading sideways and want to chase longs. I think that’s dangerous here, because there’s been persistent sell pressure overhead. The bids can’t hold, and the structure has clearly changed.

The short position is from 0.000003774 to the current price of 0.00000274. So far, the
PEPE-1.68%
BTC-1.04%
ETH-2.28%
View Original
post-image
  • Reward
  • Comment
  • Repost
  • Share
Honestly, this market really knows how to mess with people. 🚨📉 A few days ago, in the afternoon $ETH it was still bouncing back and forth up there. A lot of people saw it not dropping and wanted to rush in—meanwhile I watched and felt the level above was getting more and more off.
While everyone was still watching, I kept my eyes on the rebound strength of ETH. I found that every time it was pushed up, no one was stepping in to take it—the volume couldn’t keep up, and the follow-through wasn’t firm enough. 👀 In this kind of high-level tug-of-war, I leaned even more toward waiting for the s
ETH-2.28%
BTC-1.04%
SOL-1.94%
View Original
post-image
  • Reward
  • Comment
  • Repost
  • Share
After this round of sell-off plays out, the hesitation from earlier has basically been taught a lesson by the order book—$RAVE ’s key level at the high is truly real.
Before the signals came out, changes had already been observed. Around 0.5888 it looked like it could still hold, but each rebound showed weaker strength than the last. A lot of people watch for a short-term counter-rally to catch a bottom, ignoring that on every move up, there are people dumping from above. With this kind of market, I’d rather stand on the short side, because the structure has clearly changed.
Current price is 0
RAVE11.38%
BTC-1.04%
ETH-2.28%
View Original
post-image
  • Reward
  • Comment
  • Repost
  • Share
Load More

Join 40 M users in our growing community

⚡️ Join 40 M users in the crypto craze discussion
💬 Engage with your favorite top creators
👍 See what interests you
  • Pinned