


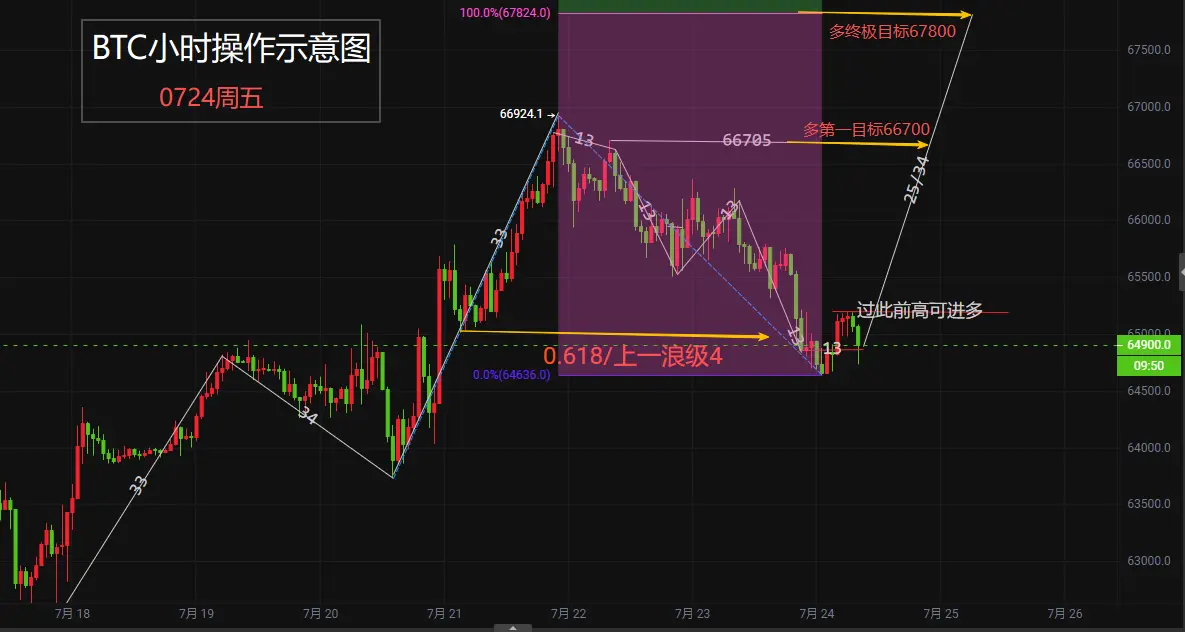


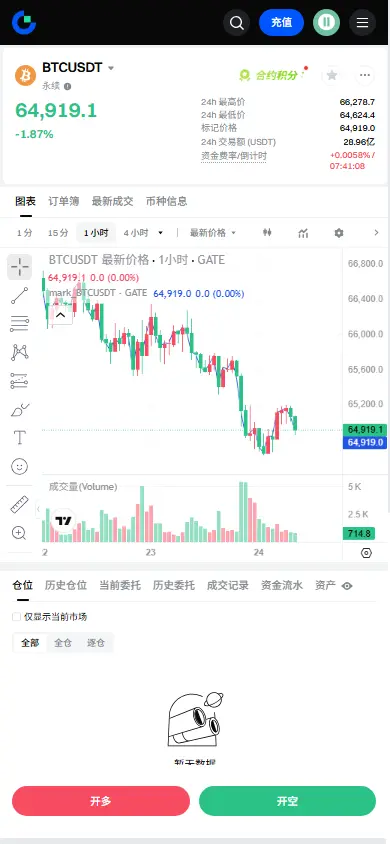


I opened a small BTC short around 67,000 with a strict stop-loss.
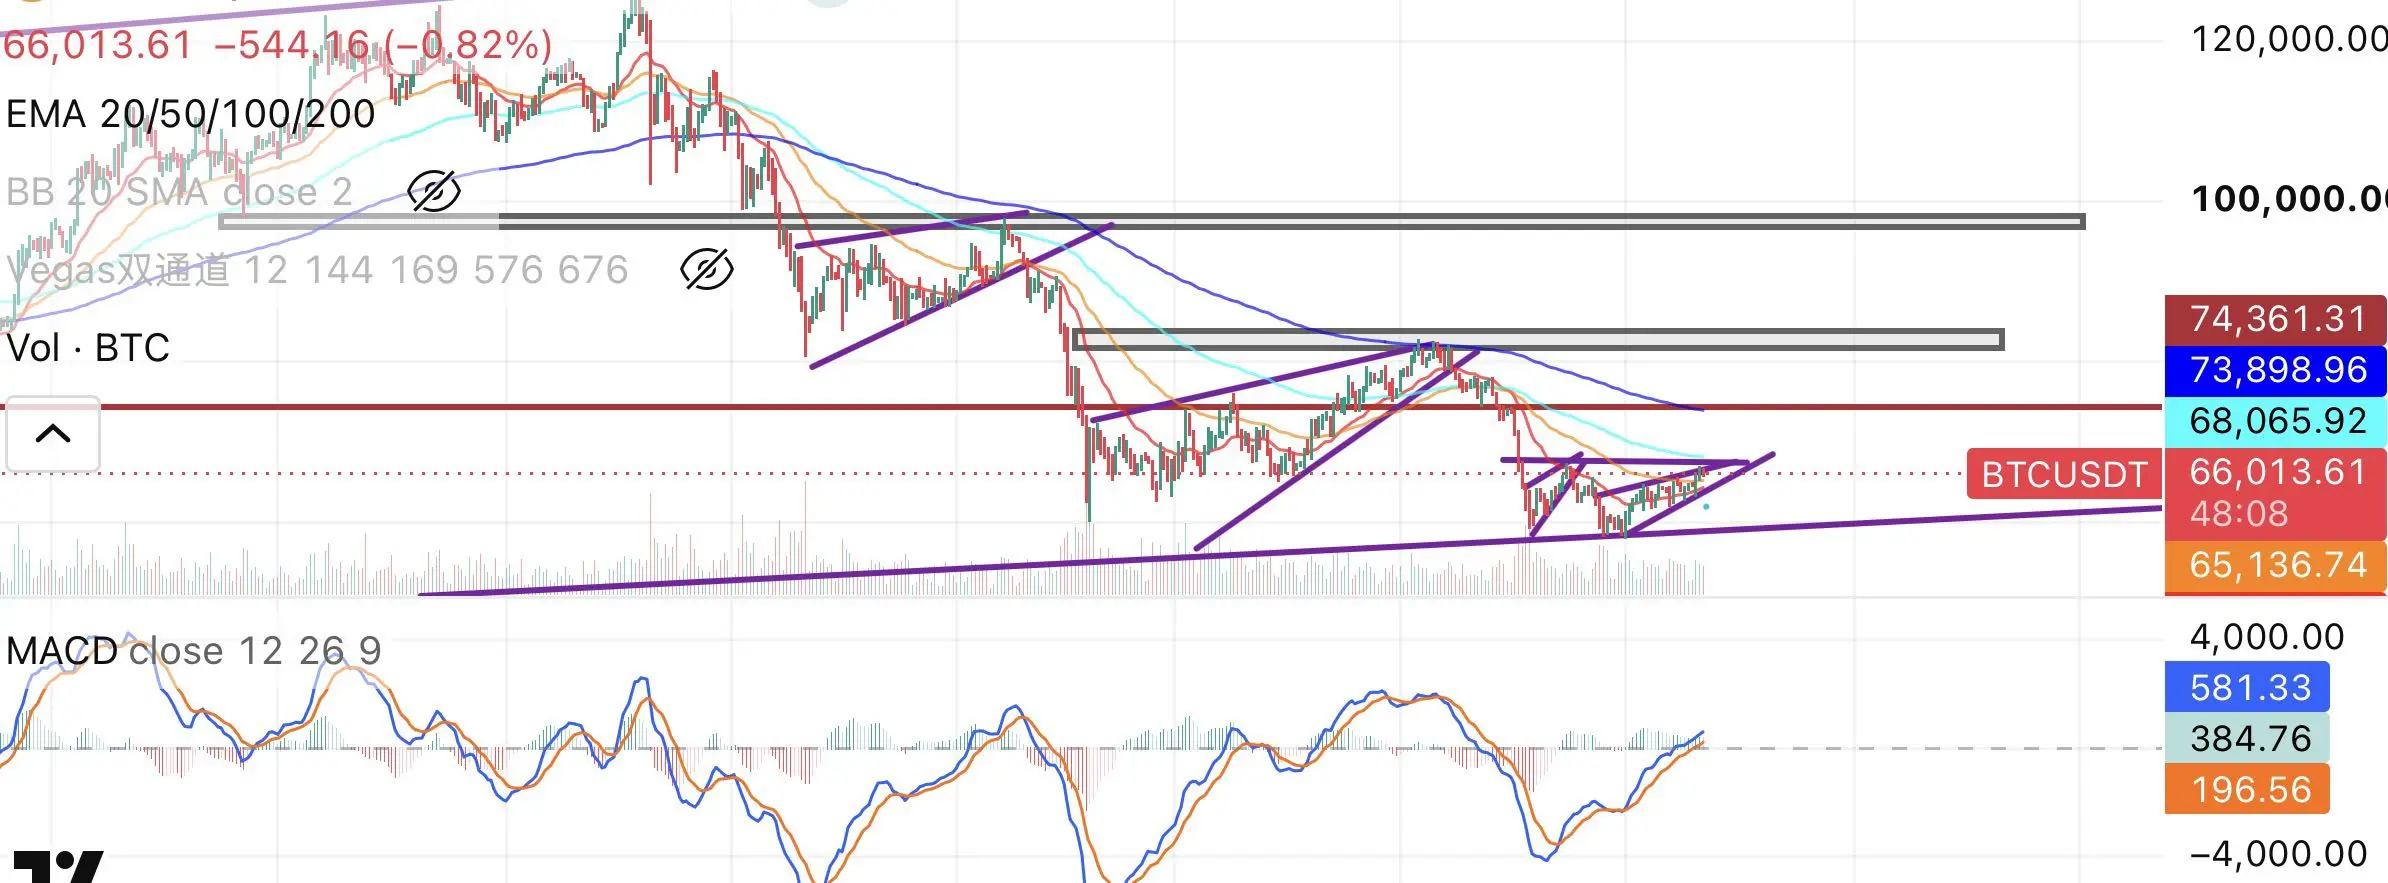
The reason is not simply that price formed another rising wedge.
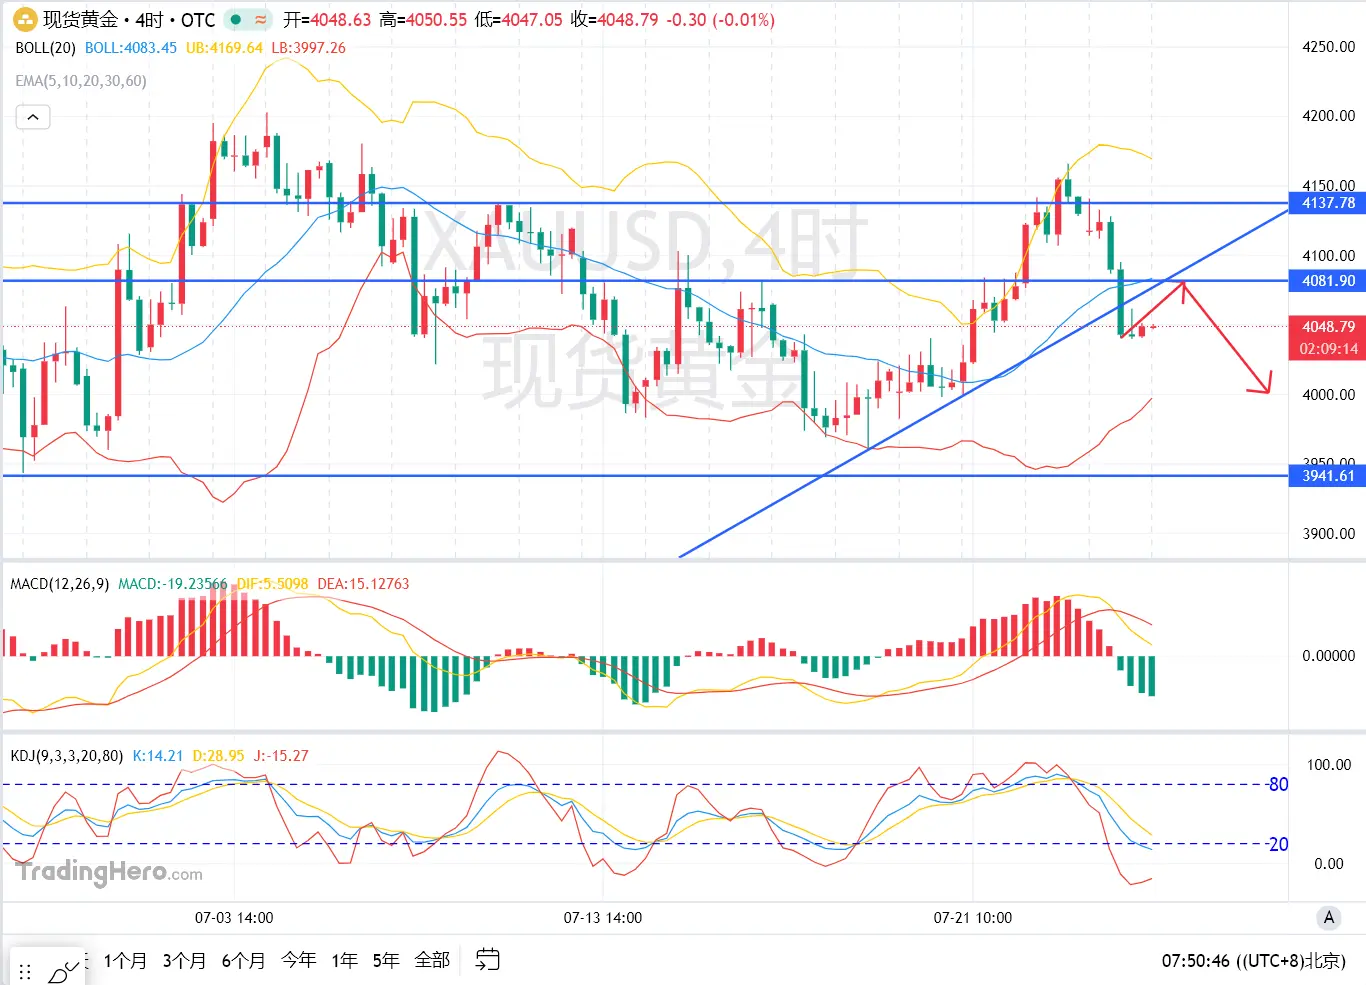
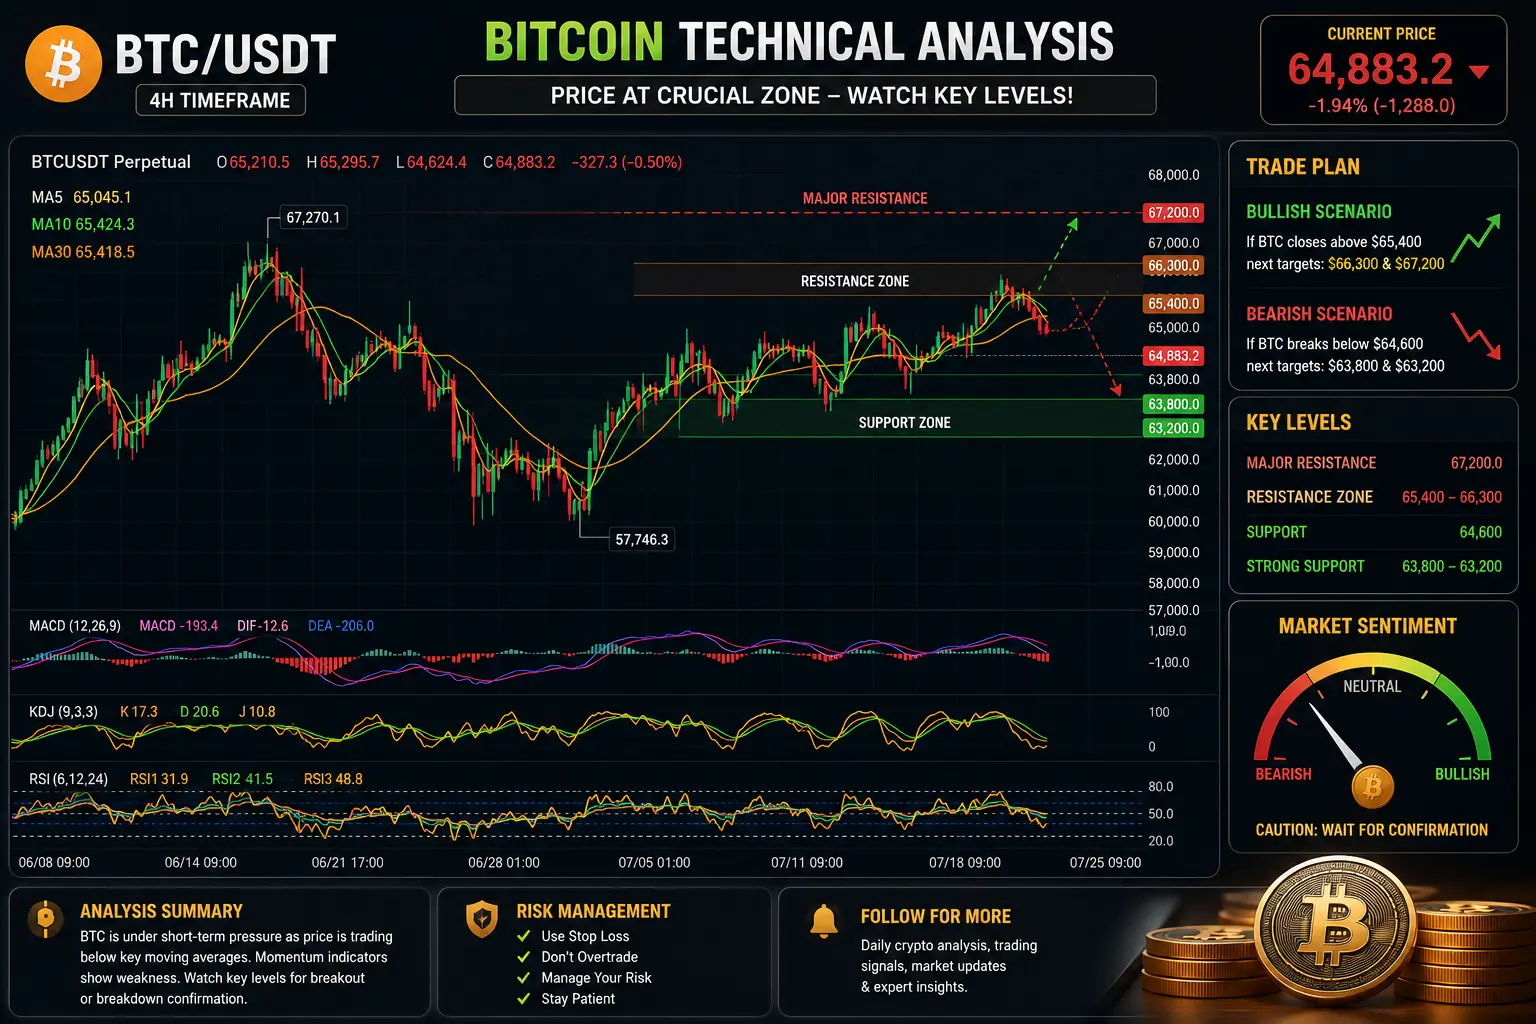
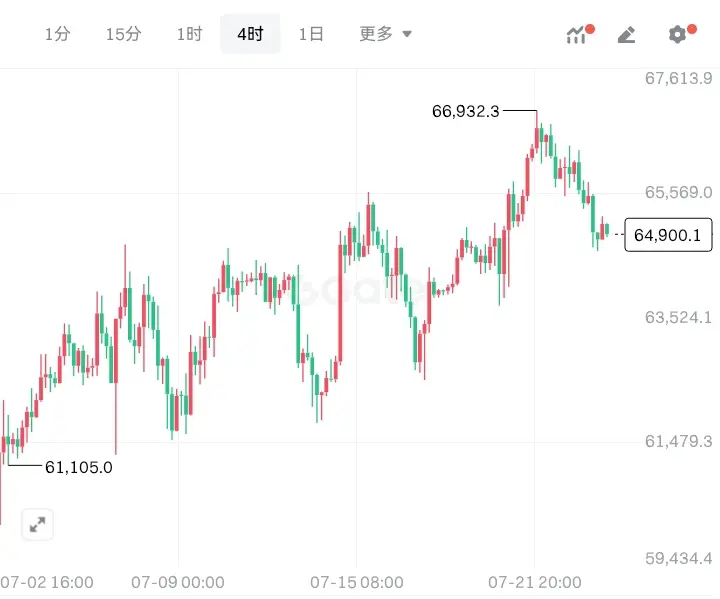
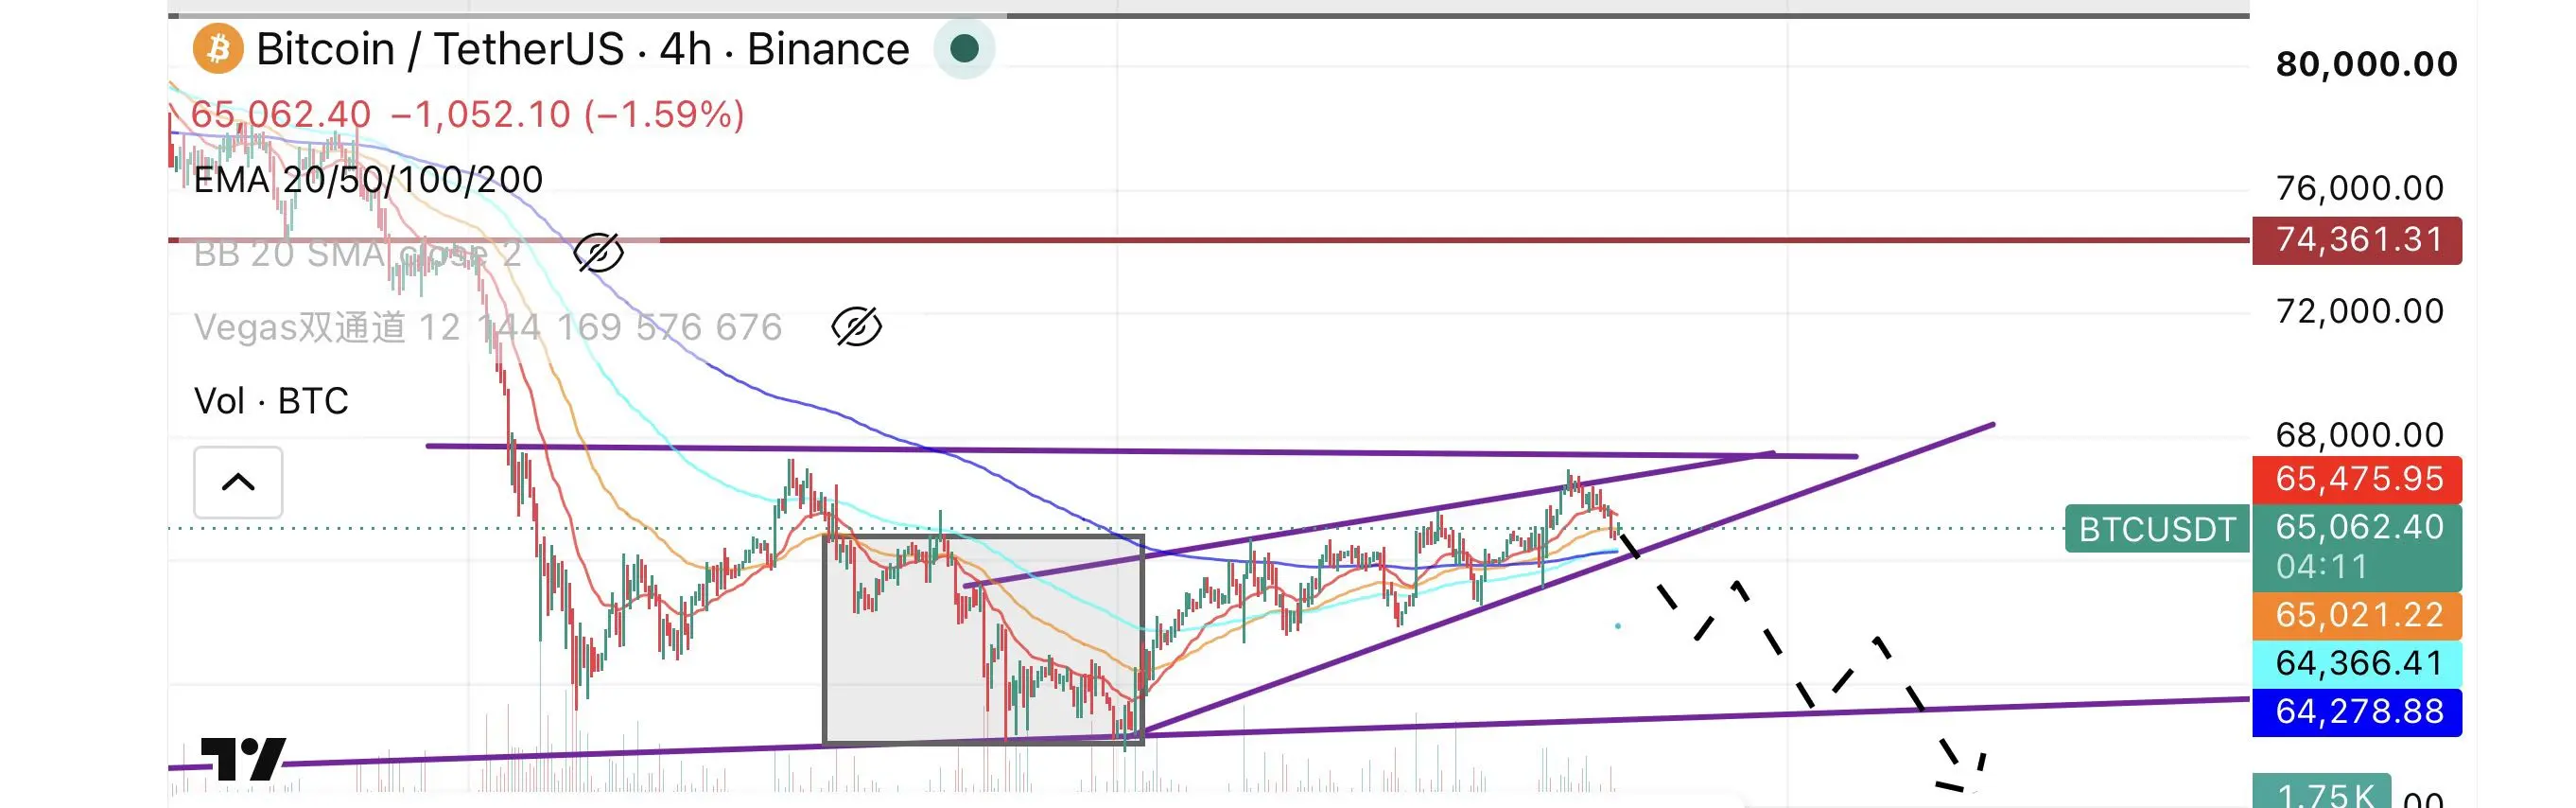
BTC is testing the 67,200 resistance area, while the 4H MACD has turned bearish and short-term momentum is weakening. The current rebound may also be forming another Lower High.
But this is still an early, controlled attempt—not a confirmed bearish reversal.
My position is deliberately small because BTC has not yet broken the latest Higher Low or closed below the wedge support.
The bearish setup becomes stronger if:
• BTC fails to reclaim 67,200
• The current Lower High remains intact
• Price breaks below the latest Higher Low
• A 4H candle closes below the rising structure
If those conditions appear, the market could begin shifting from a rebound into a clearer Lower High–Lower Low sequence.
The invalidation is equally clear.
If BTC breaks above 67,200 with strong volume and holds, I will respect the stop and exit rather than defend the short.
That could open the way toward 68,000–70,000.
My current decision:
Small position.
Strict risk.
No averaging up if the setup fails.
I am testing the resistance—not claiming the top is confirmed.
#BTC #CryptoTrading #夏日创作营
The reason is not simply that price formed another rising wedge.
BTC is testing the 67,200 resistance area, while the 4H MACD has turned bearish and short-term momentum is weakening. The current rebound may also be forming another Lower High.
But this is still an early, controlled attempt—not a confirmed bearish reversal.
My position is deliberately small because BTC has not yet broken the latest Higher Low or closed below the wedge support.
The bearish setup becomes stronger if:
• BTC fails to reclaim 67,200
• The current Lower High remains intact
• Price breaks below the latest Higher Low
• A 4H candle closes below the rising structure
If those conditions appear, the market could begin shifting from a rebound into a clearer Lower High–Lower Low sequence.
The invalidation is equally clear.
If BTC breaks above 67,200 with strong volume and holds, I will respect the stop and exit rather than defend the short.
That could open the way toward 68,000–70,000.
My current decision:
Small position.
Strict risk.
No averaging up if the setup fails.
I am testing the resistance—not claiming the top is confirmed.
#BTC #CryptoTrading #夏日创作营