


#夏日创作营 SpaceX “belt-saw” to 115, but Starship is the one that went right! Can you buy the dip now?
A slightly dramatic scene: SpaceX’s Starship just completed its 13th test flight on July 25. The boosters splashed down in the Gulf of Mexico, and the upper craft was controlled and recovered in the Indian Ocean. Musk said, “Starship is intact and undamaged. It’s floating in the ocean and transmitting telemetry data.”
Just two days before that, SpaceX’s stock price had just hit the lowest closing price since going public. One side is rockets that have turned into “it worked,” the other side is the stock being cut in half. This kind of “twisted” setup is the best entry point for understanding where the company stands right now.
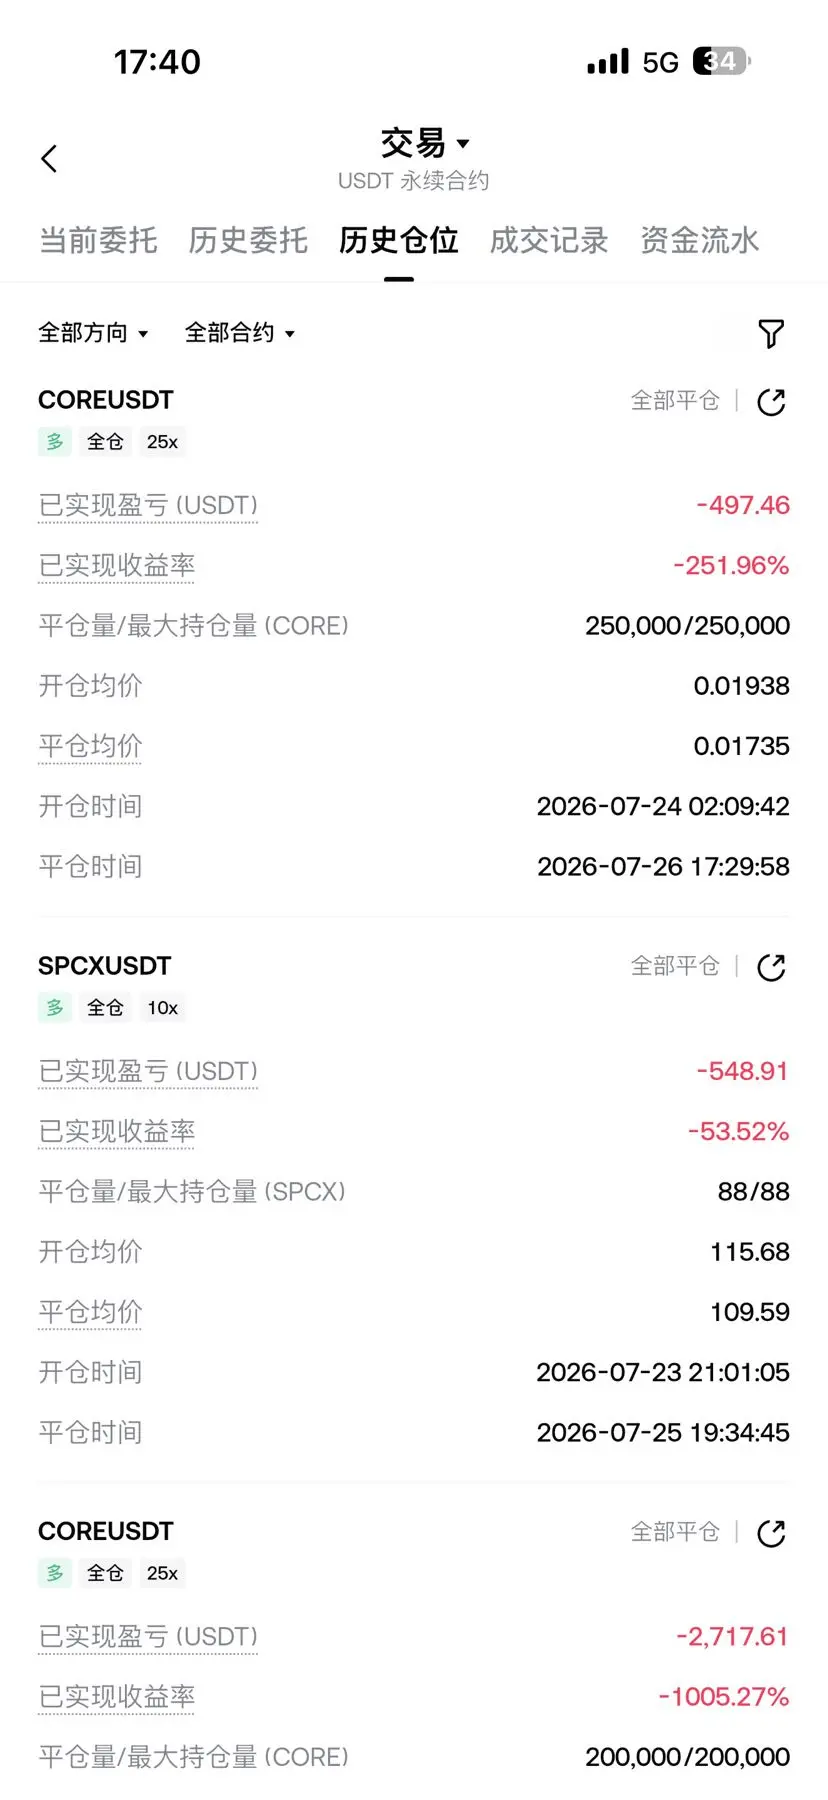
First, the live ledger (SPCX, Nasdaq)
Offering price $135 (6/12) → Peak $225.64 (6/16) → 7/24 close $115.07
Down about 49% from the peak, now below the offering price; intraday low on 7/23 was $110.85
Current market cap is about $1.5 trillion, with more than $1 trillion wiped out versus the high point
This week SpaceX is down about 7%, with Musk’s personal wealth down about $130 billion over the week
1. Why it fell so hard
It’s not that the rocket blew up. The Starship test on July 16 was aborted because an engine didn’t ignite, an automatic shutdown—but the real logic behind the drop is elsewhere.
Four reasons stacked together:
1、AI narrative gets repriced
In the early days after listing, the market priced it as “AI compute infrastructure,” with the price-to-sales ratio once jumping to 90-110x (Tesla is only about 15x). Morgan Stanley analyst Adam Jonas recently put it plainly: this round of selling has already pushed the stock price to a level where the market is “nearly not giving any valuation for the AI business.” In other words, the part priced in earlier was “story premium,” and now the story is fading—so the premium leaves first.
2、Shorts are adding, not retreating
Financial data provider Ortex said on July 24 that investors shorting SpaceX are already sitting on paper gains of $15.5 billion; of the shares available for trading, 56% (about 360 million shares) have been borrowed to short. Musk warned on July 17 that long-term heavy short sellers have “a very low probability of survival,” but the shorts didn’t close—if anything, they kept adding.
3、Unlocking is a sword hanging overhead
On August 6, 911.5 million shares of restricted stock held by insiders will unlock, corresponding to a maximum market value of about $116 billion; by early December, the shares in circulation are expected to expand from the current 639 million shares to 5.33 billion shares. Supply suddenly multiplies by several times—that’s also why the shorts feel emboldened to keep betting.
4、xAI consolidation spreads the losses out
This year in February, SpaceX merged xAI for about $250 billion (including Grok and the X platform). After consolidation, Q1 2026 revenue was $4.69 billion (year over year +15%), but net loss was $15k, and capital expenditures were $10.1 billion—2.15x revenue. On the books, “businesses that make money” and “businesses that burn cash” are being shown together for the first time.
2. Are future values worth it? Look at the three pillars
Regardless of whether the stock rises or falls, SpaceX’s business breakdown comes in three parts. Objectively, the quality is very different:
Pillar one: Starlink (the only cash cow)
Starlink revenue in Q1 was $3.26 billion, accounting for 69.4% of the group. Full-year 2025, it contributes $11.4 billion in revenue and $4.4 billion in operating profit—globally the only segment that generates positive cash flow. It has 10.3 million subscribers. But the worry is in the details: average revenue per user (ARPU) fell from $99 in 2023 to $66 in this year’s Q1, driven by price cuts to attract new users. Amazon Kuiper, OneWeb, and China’s GW constellation are all accelerating to grab share.
Pillar two: Starship (the cost disruptor)
On this 13th test flight, it first deployed 20 commercial-version Starlink V3 satellites (including 6 with cameras monitoring the heat shield). It’s one step closer to “regularized commercial launches.” SpaceX’s goal is full reuse, and to reduce the cost to $183 per kilogram to orbit by 2030. But Falcon 9 has already flown 658 times with a success rate above 99%, cutting launch costs by more than 85%. Still, “complete reusability via upper-stage recovery” hasn’t been verified. The payload delivery timeline will very likely be delayed by 12-18 months versus the original plan.
Pillar three: AI compute (the biggest upside imagination, also the most burning cash)
After merging xAI, SpaceX also secured Google’s long-term agreement (from October 2026 to June 2029: $92 million per month to lock in about 110k NVIDIA GPUs) and compute commitment from Anthropic. If all of it lands, it could add about $26 billion in revenue per year. But the cost is that free cash flow will remain negative through 2030; from 2026-2030, SpaceX is expected to raise about $270 billion in additional debt.
3. Objective judgment: is it expensive now?
Do the math, and the conclusion isn’t simply black or white:
Valuation is still high, but not that outrageous. Using about a $1.5 trillion market cap and a 2025 revenue estimate of $18.7 billion, the price-to-sales (PS) is about 80x—still far above Tesla (about 15x) and Nvidia (about 32x).
More importantly, look at sum-of-the-parts valuation (SOTP). Research institutions estimate that in today’s market cap, only about 35% corresponds to already-validated businesses (Falcon 9 + Starlink’s traditional broadband). The remaining 65%, about $1.3-1.4 trillion, is entirely bet on three forward-looking businesses that haven’t been fully proven yet.
The bulls also aren’t without reasons. Goldman Sachs initiated coverage in early July with a “Buy” and a $205 target. It expects revenue to surge to $474.3 billion by 2030 (five-year CAGR 91%). The average target price across 29-32 institutions is about $232-243, and Morgan Stanley gives $300. The bet is that all three future parts can be delivered at the same time.
The bears focus on real constraints: supply impact from unlocks; a valuation collapse if the AI narrative is disproven; and persistently negative free cash flow plus massive financing needs over the long term.
For ordinary people to judge whether it’s worth it, you only need to watch 3 signals
1、Whether Starship can stably deploy commercial payloads - V3 moving from “successful test flight” to “monthly launches” is the foundation for the cost story to hold;
2、After the August 6 unlock, whether the stock price can hold up - billions of shares pouring out, and the market votes with real money;
3、Whether AI compute orders bring in real cash - confirm income from financial reports, don’t just look at paper agreements.
In the end, what people are buying in SpaceX right now is the probability that “these three future things get delivered at the same time.” If any one falls short, valuation will need to be reset. If all three work out, then in hindsight the current $115 could be the floor. No need to rush to a conclusion—just watch those three signals land one by one. $SPCX
A slightly dramatic scene: SpaceX’s Starship just completed its 13th test flight on July 25. The boosters splashed down in the Gulf of Mexico, and the upper craft was controlled and recovered in the Indian Ocean. Musk said, “Starship is intact and undamaged. It’s floating in the ocean and transmitting telemetry data.”
Just two days before that, SpaceX’s stock price had just hit the lowest closing price since going public. One side is rockets that have turned into “it worked,” the other side is the stock being cut in half. This kind of “twisted” setup is the best entry point for understanding where the company stands right now.
First, the live ledger (SPCX, Nasdaq)
Offering price $135 (6/12) → Peak $225.64 (6/16) → 7/24 close $115.07
Down about 49% from the peak, now below the offering price; intraday low on 7/23 was $110.85
Current market cap is about $1.5 trillion, with more than $1 trillion wiped out versus the high point
This week SpaceX is down about 7%, with Musk’s personal wealth down about $130 billion over the week
1. Why it fell so hard
It’s not that the rocket blew up. The Starship test on July 16 was aborted because an engine didn’t ignite, an automatic shutdown—but the real logic behind the drop is elsewhere.
Four reasons stacked together:
1、AI narrative gets repriced
In the early days after listing, the market priced it as “AI compute infrastructure,” with the price-to-sales ratio once jumping to 90-110x (Tesla is only about 15x). Morgan Stanley analyst Adam Jonas recently put it plainly: this round of selling has already pushed the stock price to a level where the market is “nearly not giving any valuation for the AI business.” In other words, the part priced in earlier was “story premium,” and now the story is fading—so the premium leaves first.
2、Shorts are adding, not retreating
Financial data provider Ortex said on July 24 that investors shorting SpaceX are already sitting on paper gains of $15.5 billion; of the shares available for trading, 56% (about 360 million shares) have been borrowed to short. Musk warned on July 17 that long-term heavy short sellers have “a very low probability of survival,” but the shorts didn’t close—if anything, they kept adding.
3、Unlocking is a sword hanging overhead
On August 6, 911.5 million shares of restricted stock held by insiders will unlock, corresponding to a maximum market value of about $116 billion; by early December, the shares in circulation are expected to expand from the current 639 million shares to 5.33 billion shares. Supply suddenly multiplies by several times—that’s also why the shorts feel emboldened to keep betting.
4、xAI consolidation spreads the losses out
This year in February, SpaceX merged xAI for about $250 billion (including Grok and the X platform). After consolidation, Q1 2026 revenue was $4.69 billion (year over year +15%), but net loss was $15k, and capital expenditures were $10.1 billion—2.15x revenue. On the books, “businesses that make money” and “businesses that burn cash” are being shown together for the first time.
2. Are future values worth it? Look at the three pillars
Regardless of whether the stock rises or falls, SpaceX’s business breakdown comes in three parts. Objectively, the quality is very different:
Pillar one: Starlink (the only cash cow)
Starlink revenue in Q1 was $3.26 billion, accounting for 69.4% of the group. Full-year 2025, it contributes $11.4 billion in revenue and $4.4 billion in operating profit—globally the only segment that generates positive cash flow. It has 10.3 million subscribers. But the worry is in the details: average revenue per user (ARPU) fell from $99 in 2023 to $66 in this year’s Q1, driven by price cuts to attract new users. Amazon Kuiper, OneWeb, and China’s GW constellation are all accelerating to grab share.
Pillar two: Starship (the cost disruptor)
On this 13th test flight, it first deployed 20 commercial-version Starlink V3 satellites (including 6 with cameras monitoring the heat shield). It’s one step closer to “regularized commercial launches.” SpaceX’s goal is full reuse, and to reduce the cost to $183 per kilogram to orbit by 2030. But Falcon 9 has already flown 658 times with a success rate above 99%, cutting launch costs by more than 85%. Still, “complete reusability via upper-stage recovery” hasn’t been verified. The payload delivery timeline will very likely be delayed by 12-18 months versus the original plan.
Pillar three: AI compute (the biggest upside imagination, also the most burning cash)
After merging xAI, SpaceX also secured Google’s long-term agreement (from October 2026 to June 2029: $92 million per month to lock in about 110k NVIDIA GPUs) and compute commitment from Anthropic. If all of it lands, it could add about $26 billion in revenue per year. But the cost is that free cash flow will remain negative through 2030; from 2026-2030, SpaceX is expected to raise about $270 billion in additional debt.
3. Objective judgment: is it expensive now?
Do the math, and the conclusion isn’t simply black or white:
Valuation is still high, but not that outrageous. Using about a $1.5 trillion market cap and a 2025 revenue estimate of $18.7 billion, the price-to-sales (PS) is about 80x—still far above Tesla (about 15x) and Nvidia (about 32x).
More importantly, look at sum-of-the-parts valuation (SOTP). Research institutions estimate that in today’s market cap, only about 35% corresponds to already-validated businesses (Falcon 9 + Starlink’s traditional broadband). The remaining 65%, about $1.3-1.4 trillion, is entirely bet on three forward-looking businesses that haven’t been fully proven yet.
The bulls also aren’t without reasons. Goldman Sachs initiated coverage in early July with a “Buy” and a $205 target. It expects revenue to surge to $474.3 billion by 2030 (five-year CAGR 91%). The average target price across 29-32 institutions is about $232-243, and Morgan Stanley gives $300. The bet is that all three future parts can be delivered at the same time.
The bears focus on real constraints: supply impact from unlocks; a valuation collapse if the AI narrative is disproven; and persistently negative free cash flow plus massive financing needs over the long term.
For ordinary people to judge whether it’s worth it, you only need to watch 3 signals
1、Whether Starship can stably deploy commercial payloads - V3 moving from “successful test flight” to “monthly launches” is the foundation for the cost story to hold;
2、After the August 6 unlock, whether the stock price can hold up - billions of shares pouring out, and the market votes with real money;
3、Whether AI compute orders bring in real cash - confirm income from financial reports, don’t just look at paper agreements.
In the end, what people are buying in SpaceX right now is the probability that “these three future things get delivered at the same time.” If any one falls short, valuation will need to be reset. If all three work out, then in hindsight the current $115 could be the floor. No need to rush to a conclusion—just watch those three signals land one by one. $SPCX