Share crypto content and earn up to 60% commissions through content mining.
placeholder
gatefun
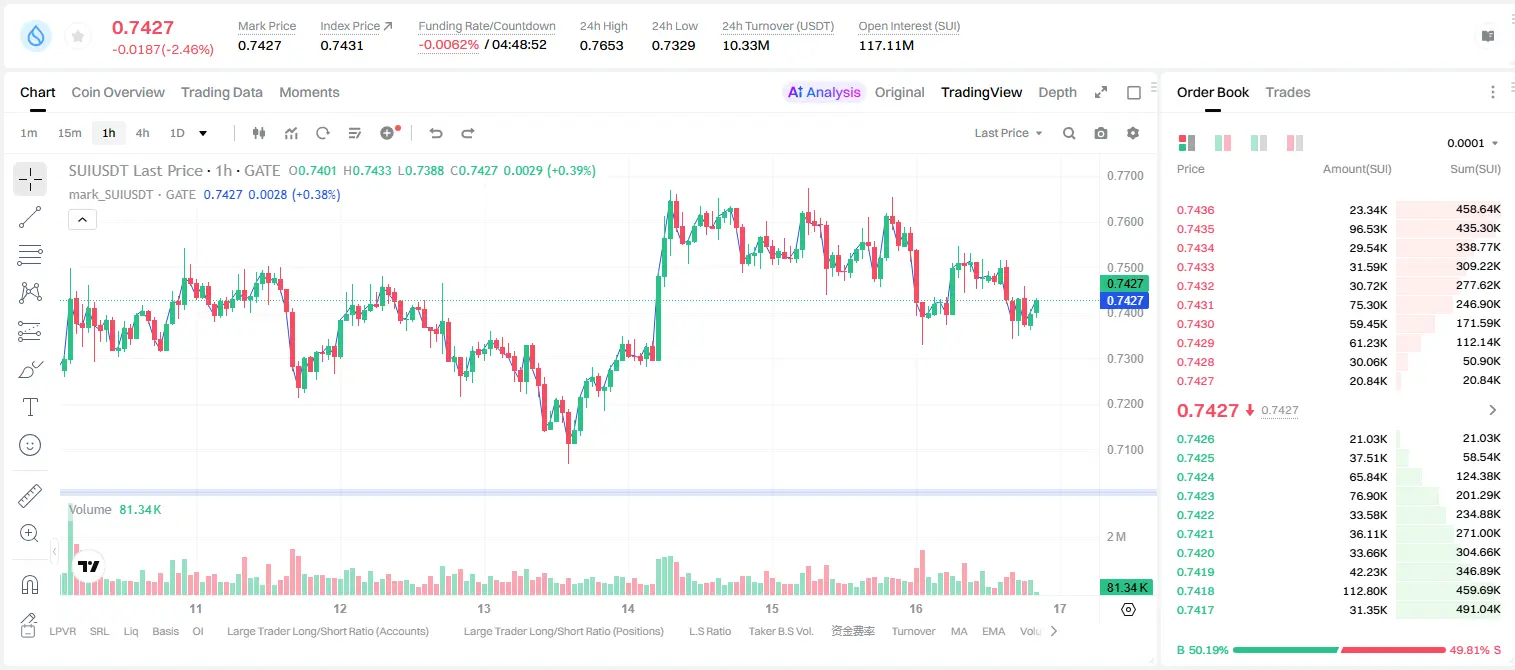
How much further can SUI fall? 4-hour shorts are gathering.

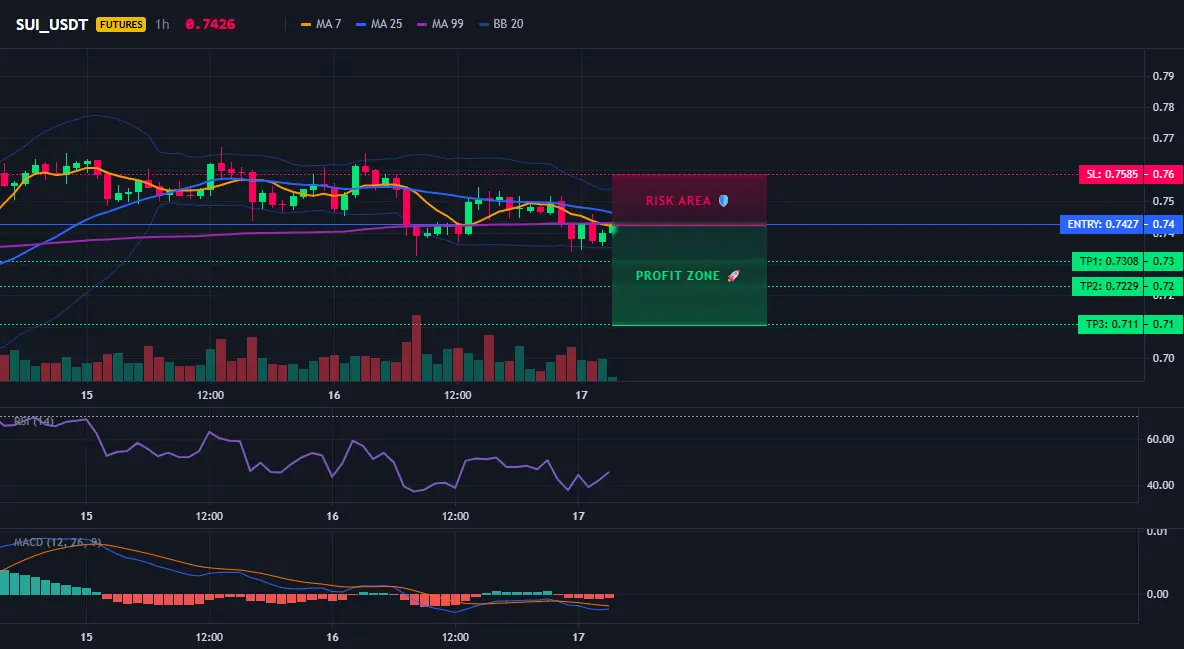
$SUI /USDT - SHORT

Trading plan:
Entry: 0.7410 – 0.7444
SL: 0.7585
TP1: 0.7308
TP2: 0.7229
TP3: 0.7110

Why focus on this setup?
- The trend is clearly bearish: 1D bearish, with a 95% confidence in the short signal.
- Current price is 0.7427 USDT; EMA and RSI (15m 50.77) show the bounce has no strength, and short momentum hasn’t been released.
- Why now? TP1 0.7308 is within reach; if it breaks, TP2 0.7229 and TP3 0.7110 are the next targets.
- The stop loss at 0.7585 is set—risk is controlled.

Discussion:
Will this wave
SUI-2.11%
View Original
post-image
post-image
  • Reward
  • 1
  • Repost
  • Share
612Ceros:
I see the entry is near the resistance zone, but the liquidity is too low—I’m worried about a fakeout. I’ll wait for confirmation of a break above the 0.73 level, then I’ll enter afterward to be safe.
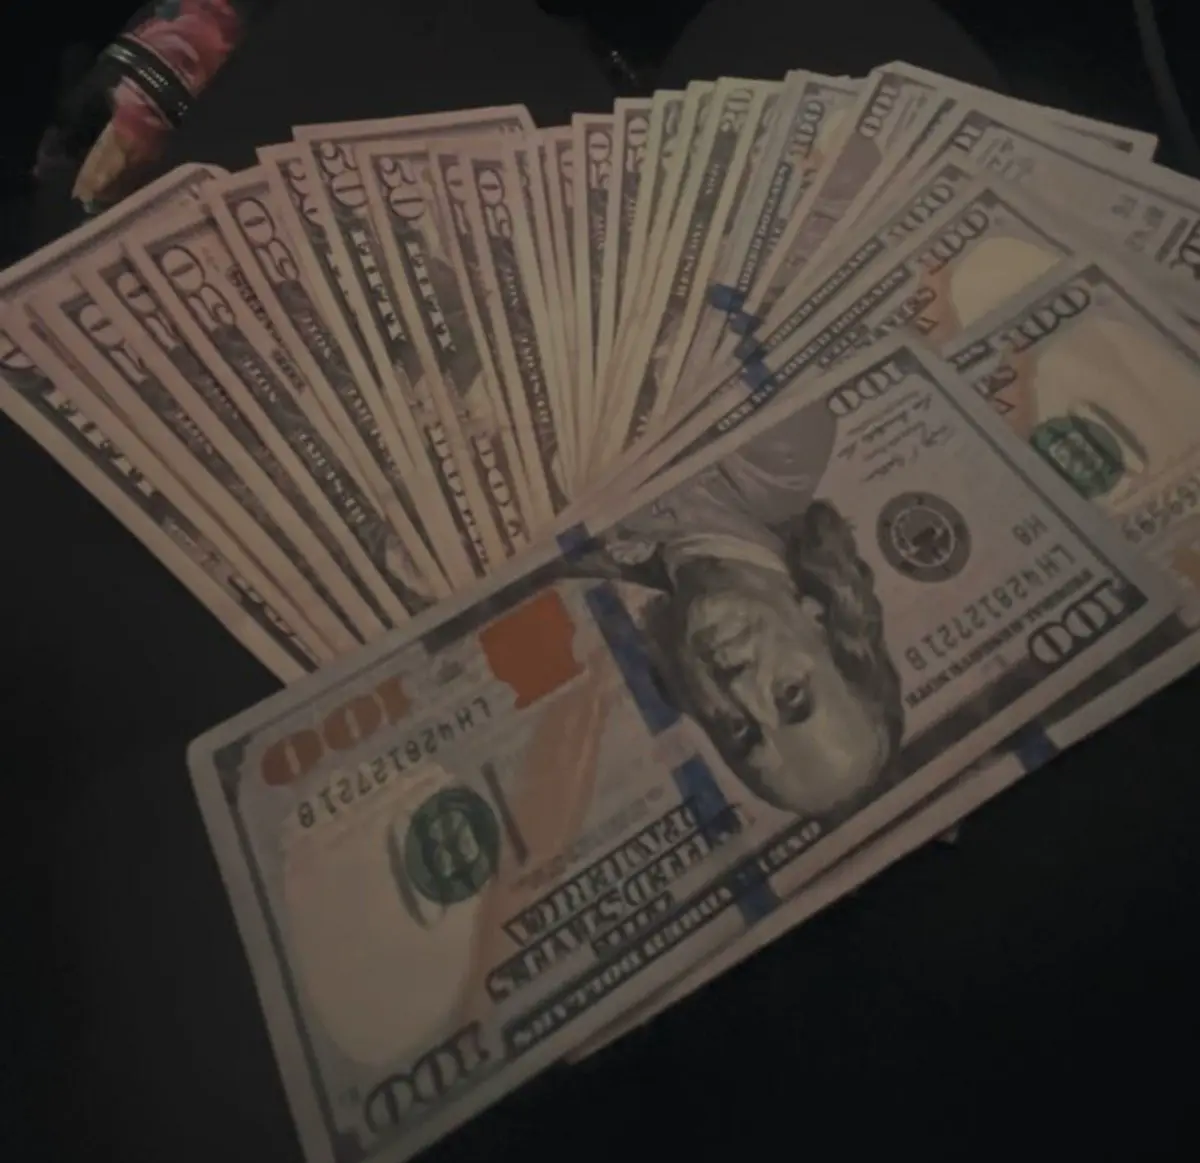
Who else is still heavily on the grind for the money?
post-image
  • Reward
  • Comment
  • Repost
  • Share
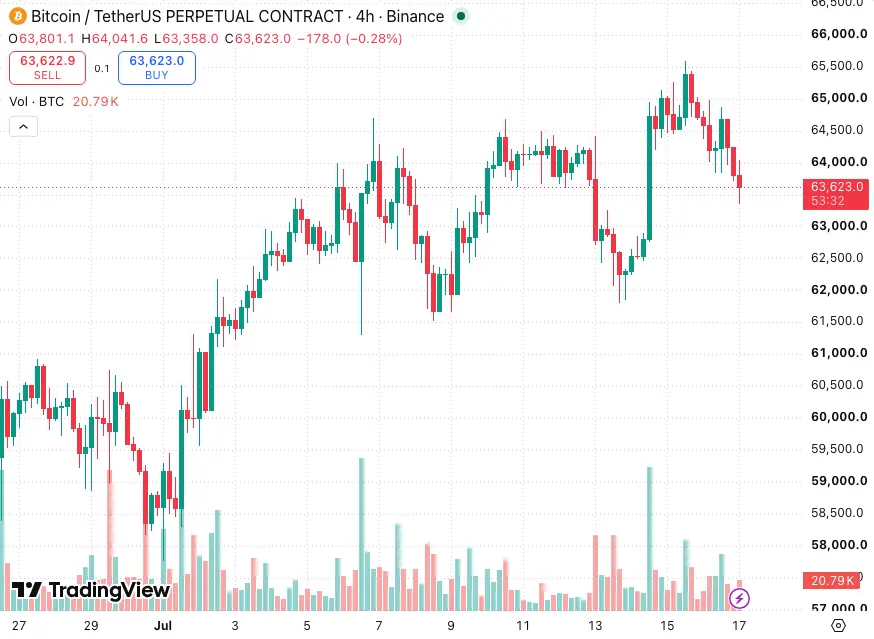
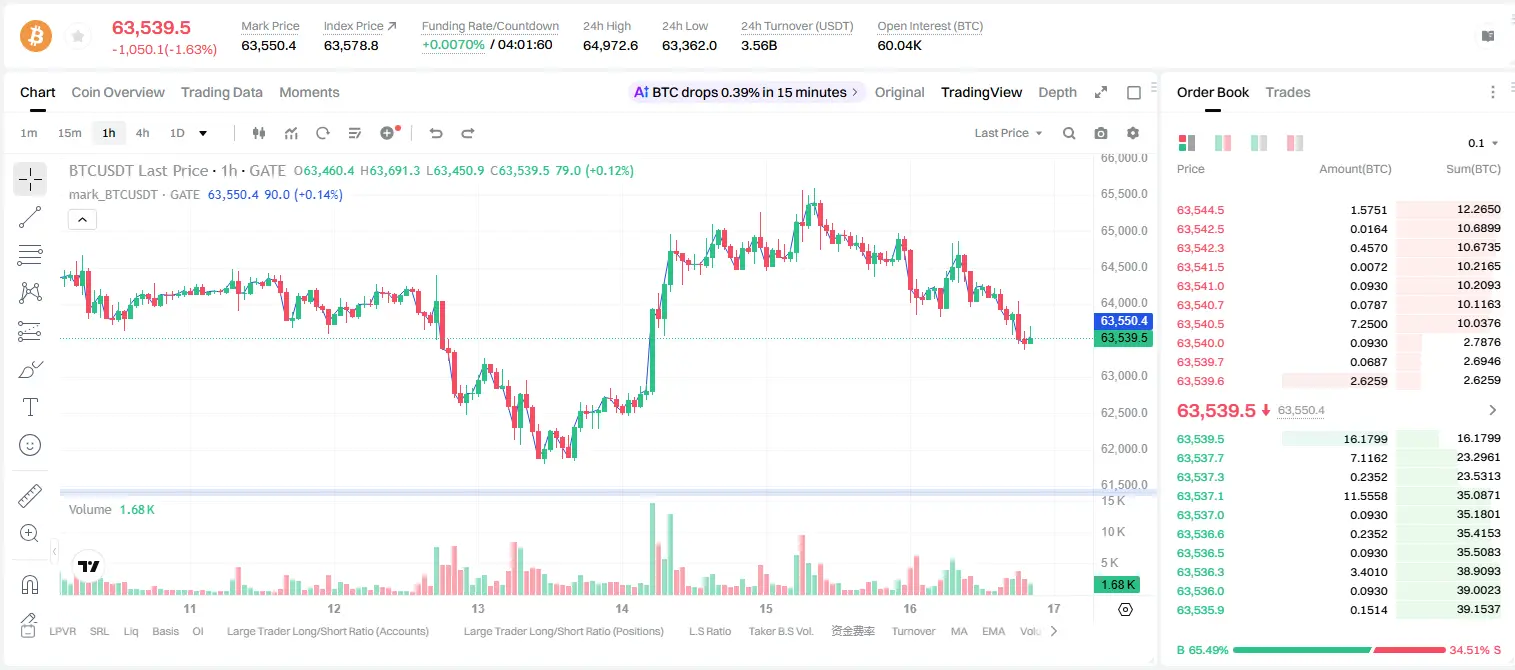
$BTC Continue to watch the choppy consolidation, $ETH and focus on defending key levels.
Last night, the market had a violent wipeout: funds fled from the US AI sector, and the leading stock SNDK crashed 40% in half a month. Combined with the escalation of the US-Iran conflict and rate-hike expectations, global financial markets are seeing a major pullback.
Bitcoin is currently around 63,450. Although it looks relatively resilient, in this kind of macro environment it’s hard to break out into an independent trend. It will most likely keep spending more time consolidating. For support, first
ETH-3.43%
View Original
post-image
  • Reward
  • Comment
  • Repost
  • Share
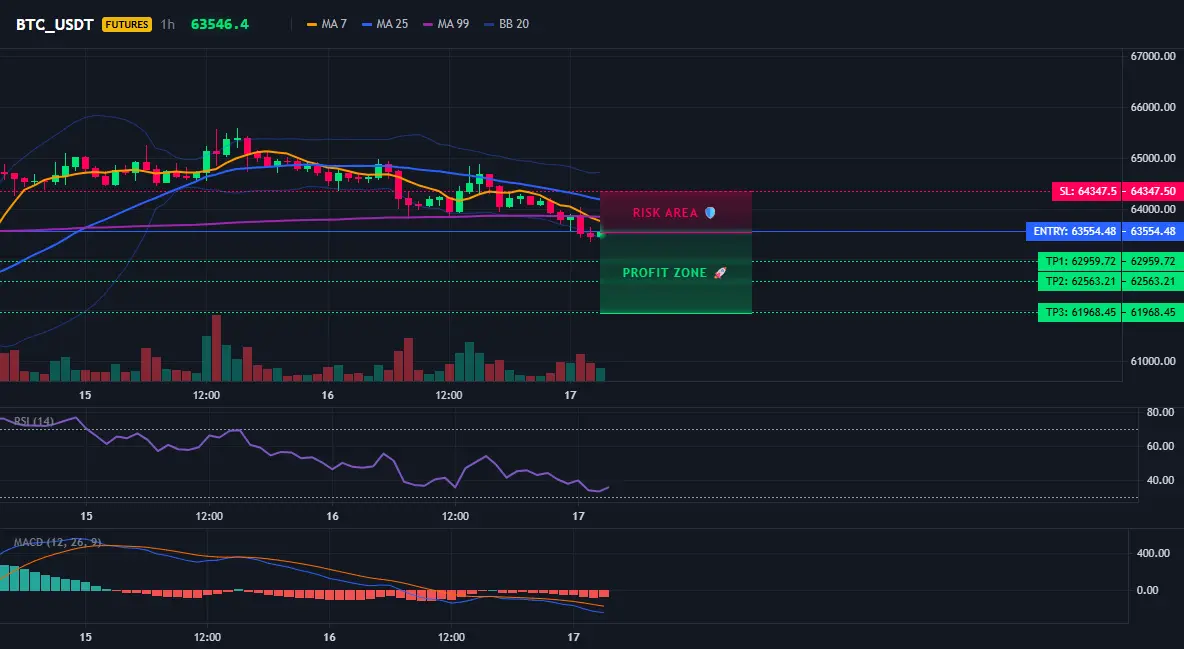
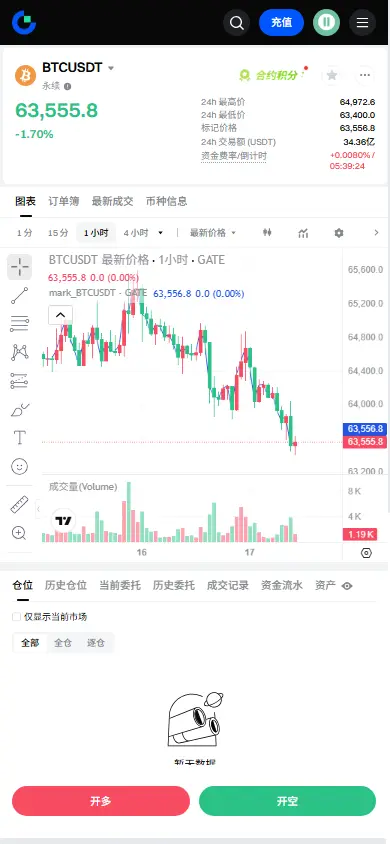
4-hour EMA death cross confirmed—BTC shorts with a 95% win rate, do you dare to follow?
$BTC /USDT - SHORT sell
Trading plan:
Entry: 63,471.87 – 63,637.09
SL: 64,347.50
TP1: 62,959.72
TP2: 62,563.21
TP3: 61,968.45
Why watch this structure?
- Current BTC 63,554: 1-hour EMA is bearish, and RSI on 15m is only 38.94—momentum exhaustion is obvious.
- Why now?: The 4-hour trend is downward, daily is bearish on a higher timeframe; 95% confidence for the shorts. TP1 at 62,959 is already in range.
- Key levels: If price breaks below 63,471, the short accelerates to TP2 62,563; the stop-loss at 64,347 i
BTC-1.60%
View Original
post-image
post-image
  • Reward
  • Comment
  • Repost
  • Share
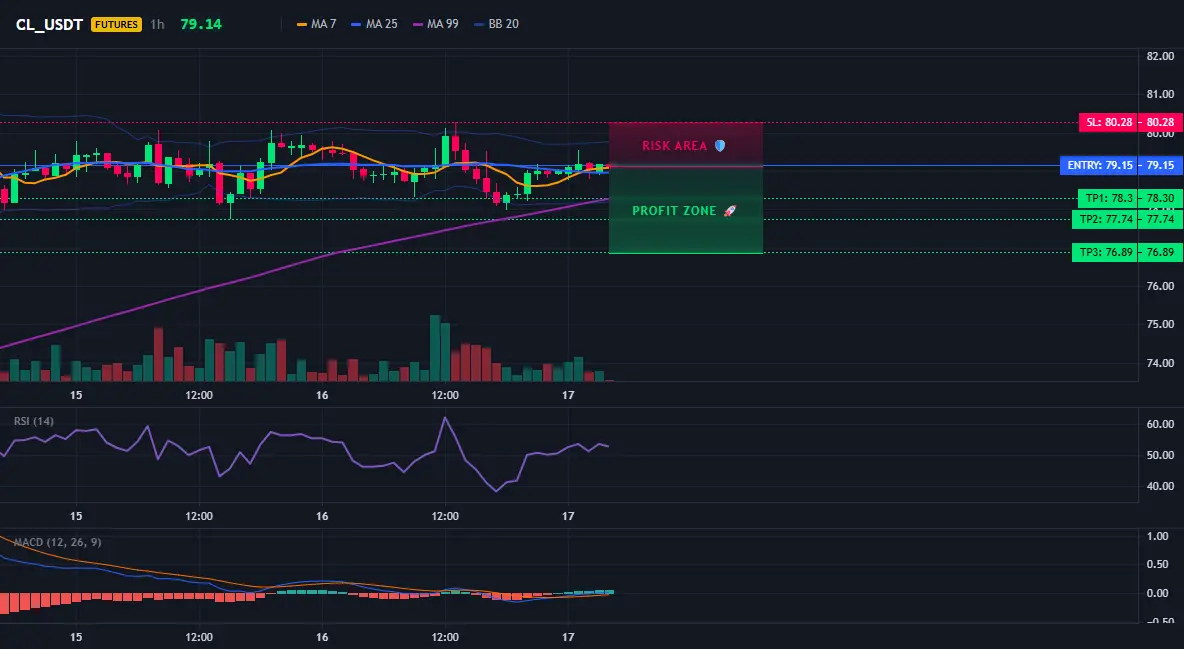
$CL /USDT Bear trap: this rebound may just be a trap

$CL /USDT - Short SHORT

Trading plan:
Entry: 79.03 – 79.27
SL: 80.28
TP1: 78.30
TP2: 77.74
TP3: 76.89

Why focus on this setup?
- Intraday RSI on 15m is only 54.49, rebound momentum is weak, and it hasn’t broken the overbought line.
- The 4H direction is clearly SHORT; on 1D it’s ranging, and the bulls lack continuity.
- Current price 79.15 is near the resistance zone; SL is set at 80.28, and the risk-reward ratio is reasonable.
- Why now? Range top + weak rebound = the best short entry window for bears.

Discussion:
Will this move fir
CL0.19%
View Original
post-image
post-image
  • Reward
  • Comment
  • Repost
  • Share
Tonight’s CPI: Full Coverage · Analysis
gate liveLIVE
3,090
  • Reward
  • 1
  • Repost
  • Share
SDyahaya:
let's support each other 💯
(New Streamer)BTC Update
gate liveLIVE
940
live-coin
  • Reward
  • Comment
  • Repost
  • Share
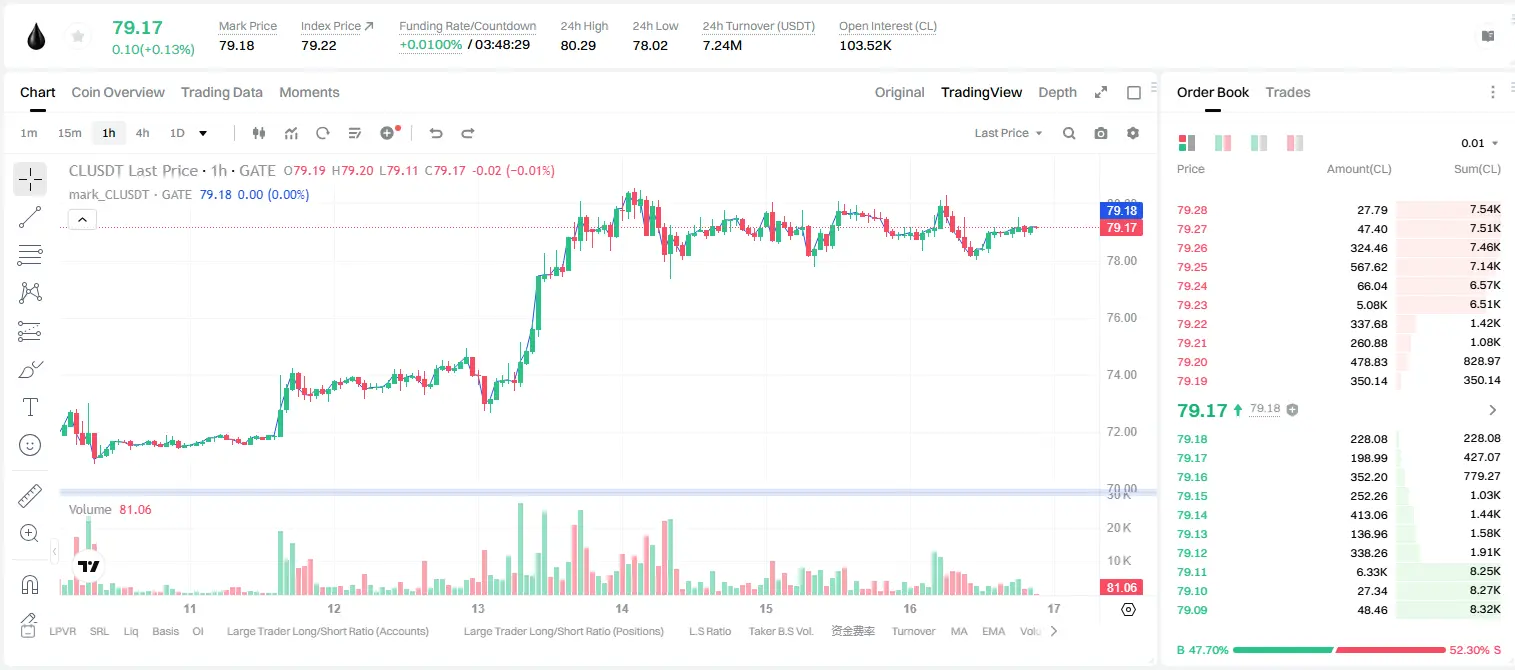
$CL Watch the short side. The current price has shown clear resistance in the 79.13 to 79.24 range; it may continue to be rejected and pull back. From the chart, the 4-hour short structure is still intact, and the daily timeframe as a whole is still range-bound. The 15-minute RSI is around 56 right now, giving the bears room to push downward. Also, the 15-minute volume has directly expanded by 4x, and sell orders are indeed coming in. For entry, look at the 79.13 to 79.24 range. The first downside target is around 78.79, with further levels at 78.53 and 78.15. For defense, you can set it arou
CL0.19%
View Original
post-image
  • Reward
  • Comment
  • Repost
  • Share
Previously, I had Claude and Cursor handle Word, Excel, and PPT mainly with:
Python libraries + XML + templates + a pile of prompts.
It works, but it’s especially easy to mess up.
Today I came across a GitHub project with 13 thousand stars, and the approach is completely different.
OfficeCLI directly turns Word, Excel, and PPT into a suite of AI Agent-callable CLIs.
The best part isn’t editing Office—it’s that it finally makes Office visible to AI.
Previously, when Agents changed PPT, they basically relied on guessing; after editing, you didn’t know what it looked like, so you had
View Original
post-image
  • Reward
  • Comment
  • Repost
  • Share
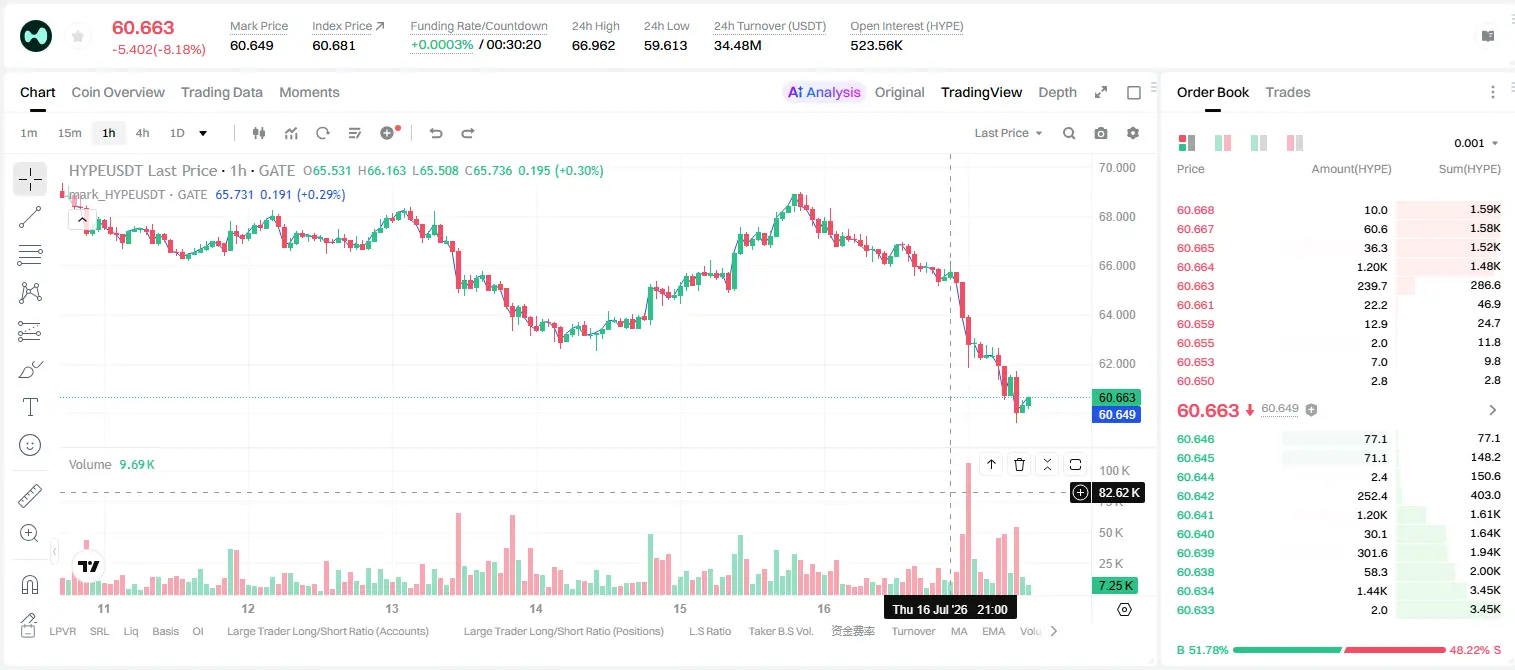
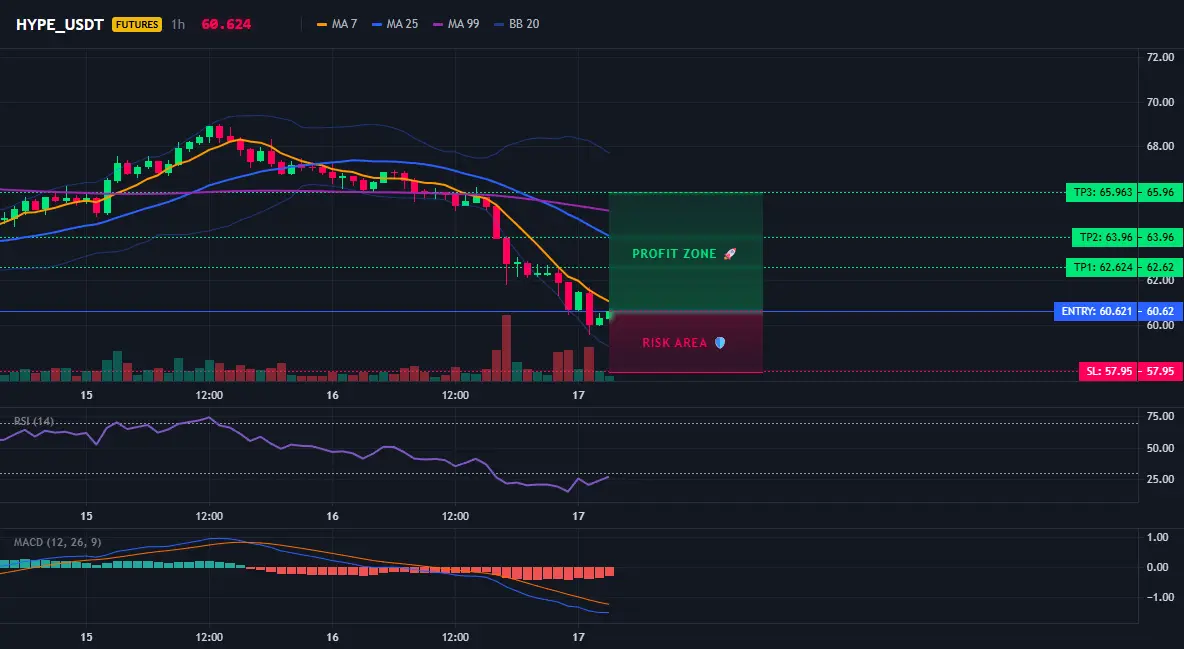
HYPE: 4-hour timeframe—buy signal right now. Are retail traders still hesitating?
$HYPE /USDT — go long (LONG)
Trading plan:
Entry: 60.407 – 60.835
SL: 57.950
TP1: 62.624
TP2: 63.960
TP3: 65.963
Why focus on this structure?
• RSI (15m) is only 39.92—oversold, with ample room for a rebound
• 1H EMA support at 60.621; entry zone is 60.407-60.835
• 1D trend is consolidating; for the short-term LONG, targets are TP1 62.624 and TP2 63.960
• Stop loss at 57.950; risk-reward ratio is reasonable
Discussion:
Will this move reach TP2 first, or is it a fake breakout followed by a pullback?
HYPE-9.04%
View Original
post-image
post-image
  • Reward
  • Comment
  • Repost
  • Share
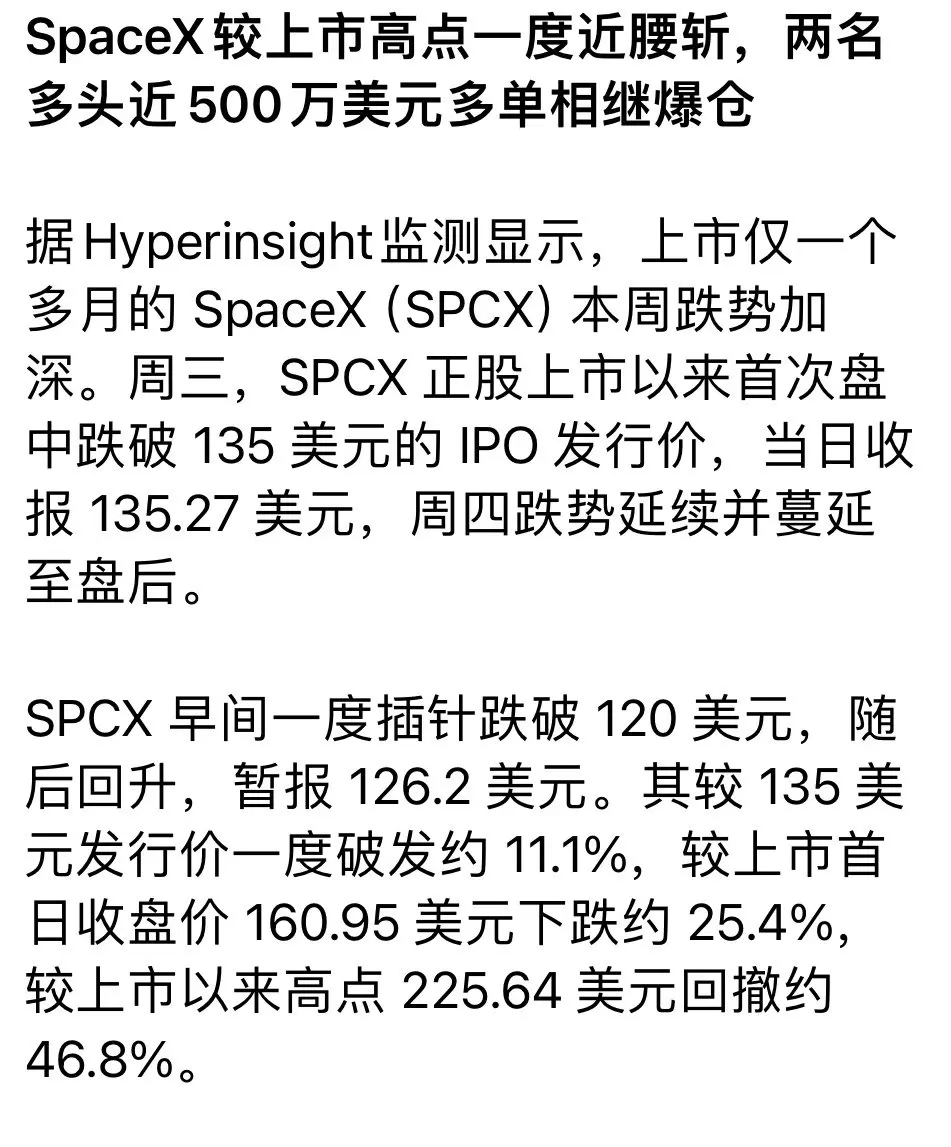
$SPCX To keep you in their grip, they didn’t just recover a rocket—they also canceled the launch.
View Original
post-image
  • Reward
  • Comment
  • Repost
  • Share
From 30k to zero, and then slowly from 1,500 USDT to over 30k—my biggest takeaway along this whole journey can be summed up in one sentence: in crypto, the first thing to be weeded out is people who can’t control themselves.
Six years ago, I caught the bull market and thought making money was too easy. I kept increasing my position size, and in the end, my last liquidation shattered my account, my confidence, and my life all at once.
Later, I restarted with only the remaining 1,500 USDT. Cat Brother only followed 9 rules: don’t go full position with small capital; take profits promptly when go
BTC-1.60%
View Original
post-image
  • Reward
  • Comment
  • Repost
  • Share
Master Ye yesterday openly “topped” the big pancake at 64,900. The current price of the big pancake is 63,500, and the entire process was public.
On the “艮” side, the brothers happened to catch a wave of about 1,500 points’ little waterfall—there’s still a short distance to what I expected.
Many people are still fantasizing about pushing on past 65,000.
But after trading for so many years, I know this truth:
At the position that everyone is expecting most, you must stay on high alert.
From 64,900 falling back to 63,500, the market once again confirmed a pattern:
Rising needs a reas
BTC-1.59%
View Original
post-image
post-image
  • Reward
  • Comment
  • Repost
  • Share
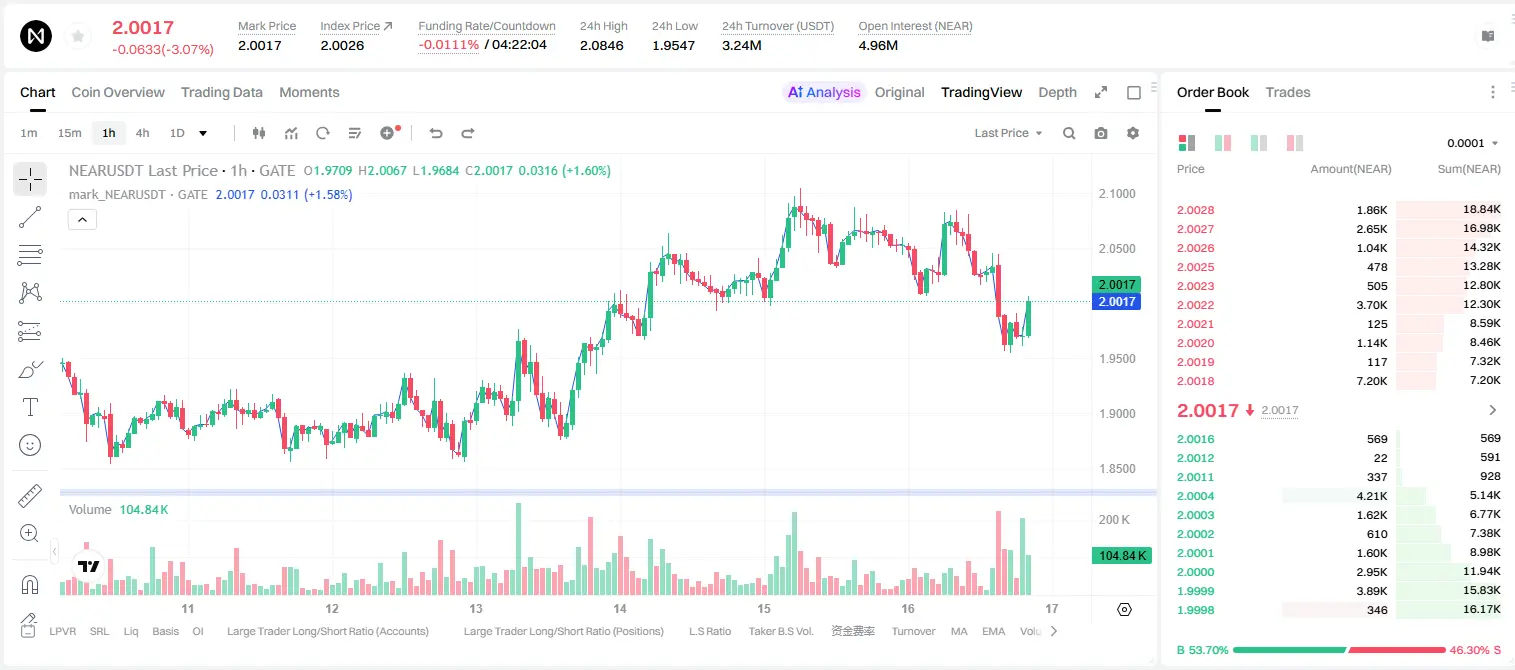
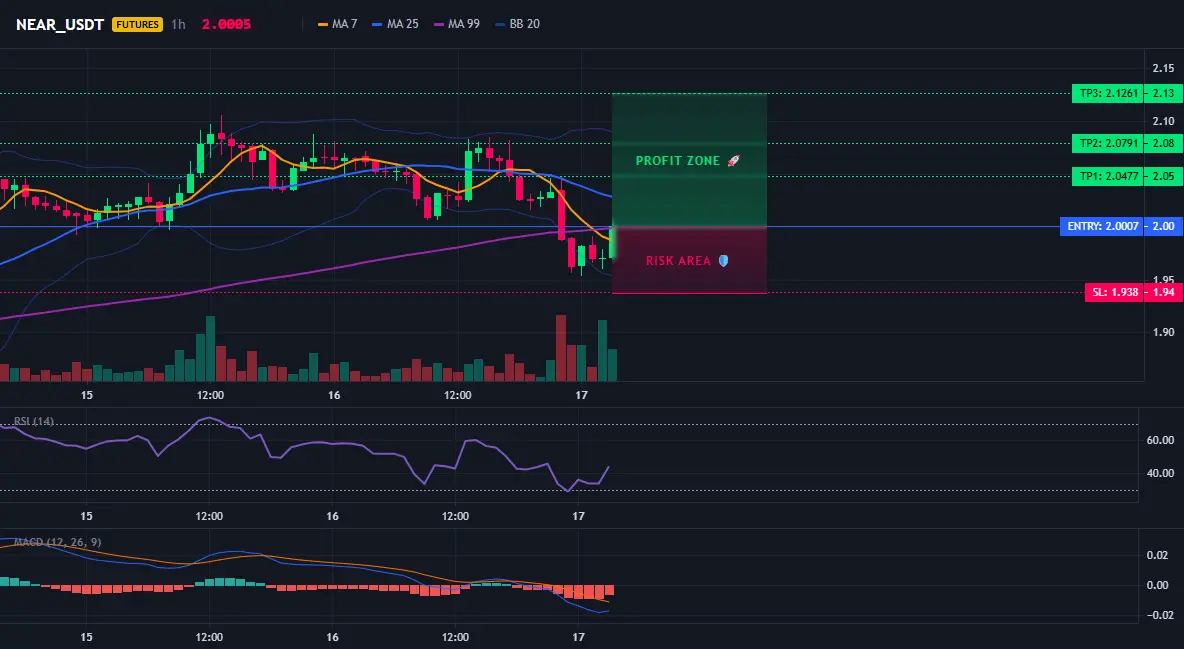
NEAR long signal 95%, who dares to follow this?
$NEAR /USDT - Go LONG
Trading plan:
Entry: 1.9942 – 2.0072
SL: 1.9380
TP1: 2.0477
TP2: 2.0791
TP3: 2.1261
Why focus on this structure?
- 4-hour bullish trend confirmed, 1D bullish, clear direction.
- Current price 2.0007, RSI 15m 54.14, not overheated, safe entry.
- TP1 2.0477, TP2 2.0791, risk-reward ratio >2:1.
- Why now? The trend has just started, EMA support is strong—don’t miss the move and wait for a pullback.
Discussion:
Will this wave hit TP2 first, or is it a bull trap? See you in the comments.
NEAR-3.61%
View Original
post-image
post-image
  • Reward
  • Comment
  • Repost
  • Share
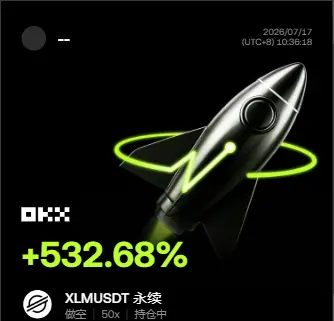
Positions are disclosed directly. I have a very clear read on the rhythm of this $UB short. From entry at 0.21896 to now 0.08132, the return is already +1542.58%. This move wasn’t guessed—it’s the result of step-by-step weakness after heavy pressure at the highs.
Before the signal came out, I’d already observed changes, but I didn’t rush to call the outcome. The real key was that multiple attempts above failed; each time price bounced back, it was smashed back down again, showing that the longs’ relay isn’t working. Many people are still waiting for it to keep pumping, but my feeling at the ti
UB3.23%
BTC-1.60%
ETH-3.43%
View Original
post-image
  • Reward
  • Comment
  • Repost
  • Share
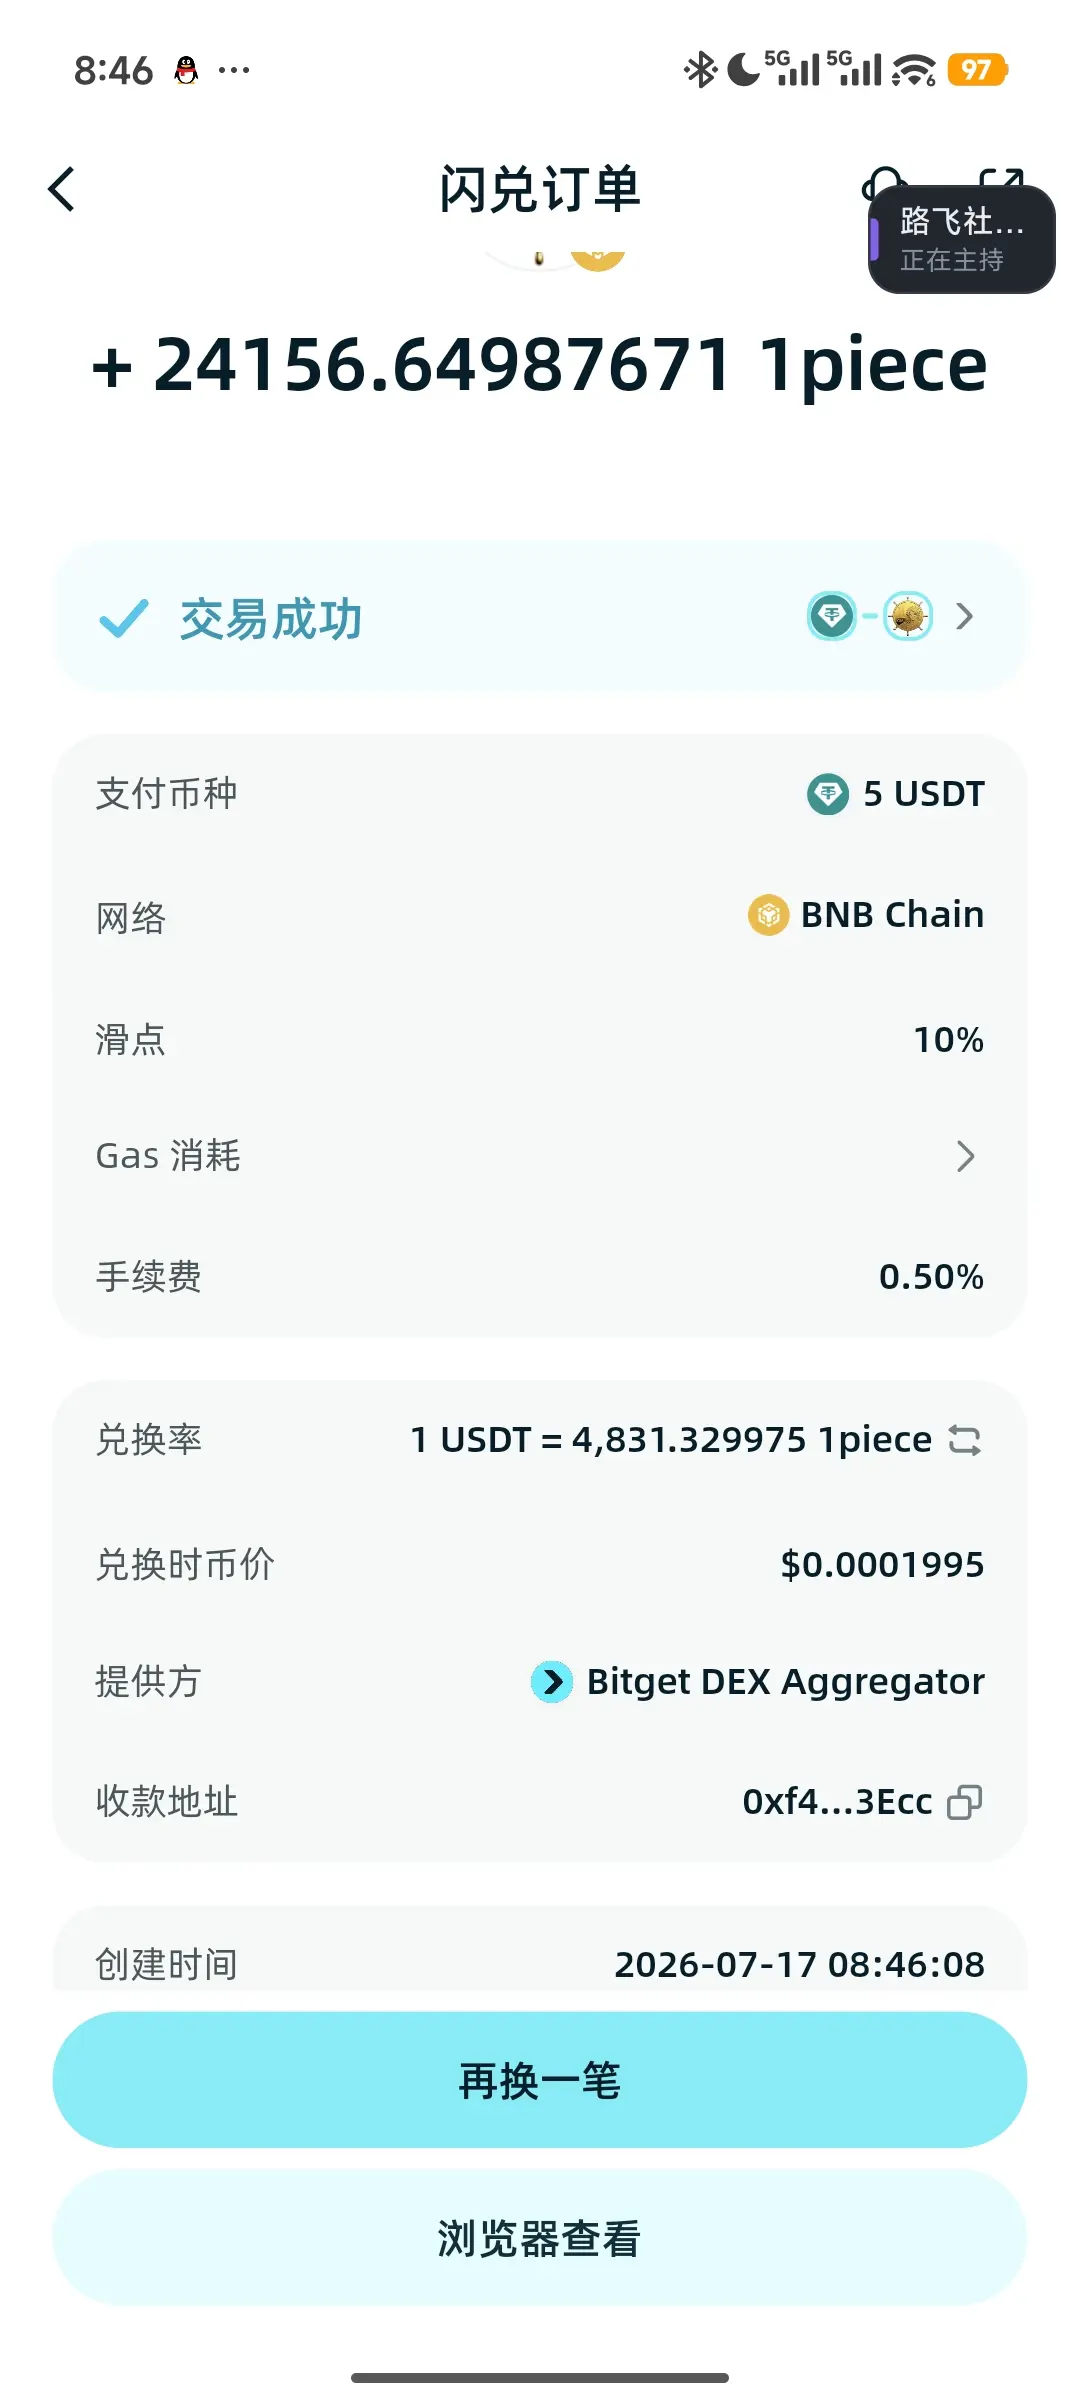
Piece 365 DCA Plan, Day 105
Stick to daily DCA to accumulate and hold coins,
seize the forging momentum to amplify returns.
All fellow travelers who stick to long-term investing will eventually gain their own ONE PIECE!
View Original
post-image
  • Reward
  • Comment
  • Repost
  • Share
The last glance before bed was still grinding, and when I woke up I directly settled the short! 📉🚀 A few days ago, $XAG was still chopping sideways at a high level before bed. It looked like it might try to push up, but what I cared about more then was whether anyone would step in to take it.
Before the order book fully got going, every rebound in XAG was really hard—it didn’t have the volume to back it up, and the follow-through/support wasn’t firm. 👀 Once the sell pressure overhead showed up, the price immediately went weak, so around 78.13 I went long, waiting for the pullback after it
XAG-3.12%
BTC-1.60%
ETH-3.43%
View Original
post-image
  • Reward
  • Comment
  • Repost
  • Share
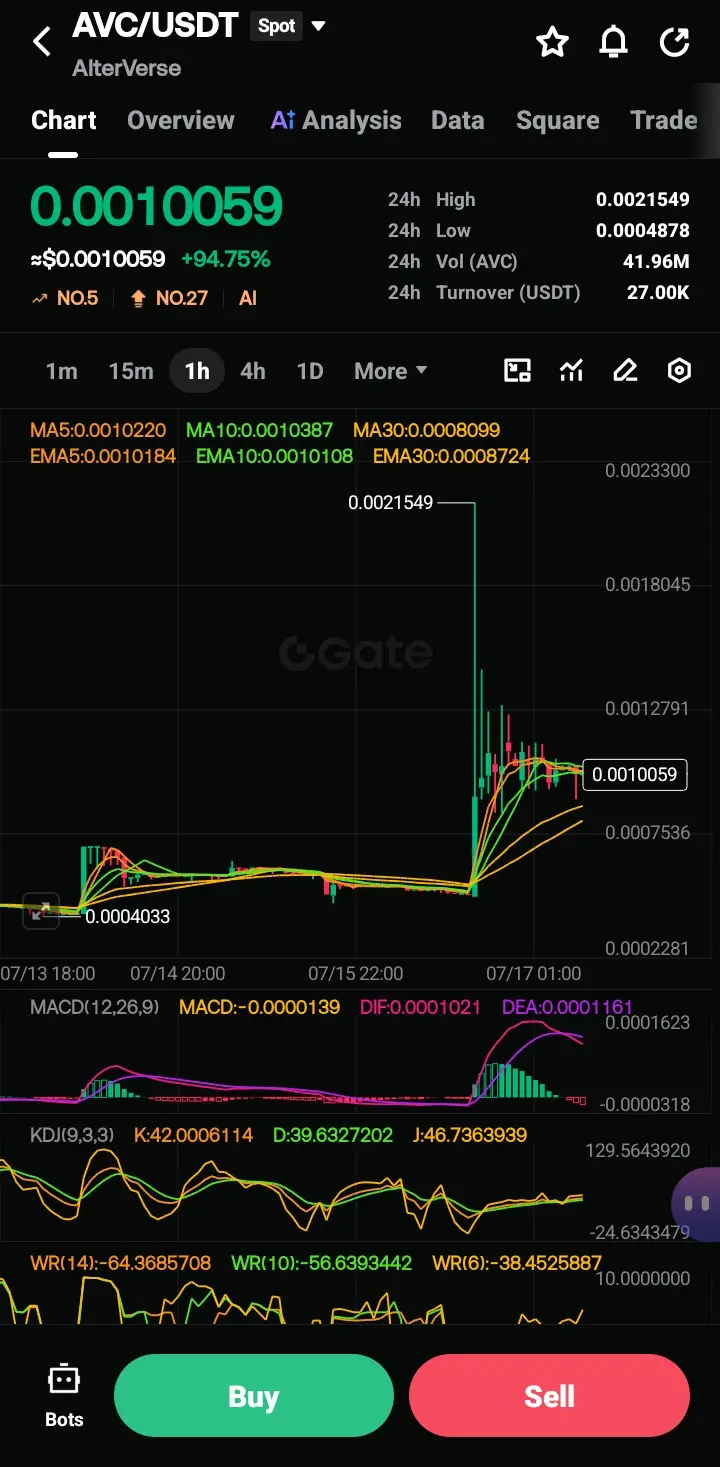
AVC/USDT (AlterVerse) — K-Line Analysis & Trade Plan
$AVC #SummerCreationCamp
📊 Candlestick Pattern Breakdown
Phase 1 — Accumulation (07/13–07/15)
Price flatlined near 0.0004033 with minimal volume
Very tight, compressed candles = classic pre-pump base
Phase 2 — Parabolic Spike (07/15–07/16)
Explosive vertical candle to 0.0021549 (+340% from base)
Classic single-candle pump with likely thin liquidity
Phase 3 — Current: Volatile Pullback & Consolidation
Price collapsed back to ~0.0007–0.0008 then bounced
Now at 0.0010059, forming choppy indecision candles
Long wicks on recent bars = buyer/s
AVC95.64%
post-image
  • Reward
  • Comment
  • Repost
  • Share
🚨 $BTC OCTOBER 9 MARK IT IN YOUR CALENDAR
Over a decade of data and this cycle clock has never missed
Bull phase: 1,064 days
Bear phase: 364 days
2015-2017 → 1,064 days up
2017-2018 → 364 days down
2018-2021 → 1,064 days up
2021-2022 → 364 days down
2022-2025 → 1,064 days up
2025-2026 → 364 days down
Pattern points to one date October 9 for the 2026 cycle bottom
Every cycle has followed this sequence without a single exception
I've called every major top and bottom for 15 years, including the $16K bottom and the $126K top both publicly, both before they happened
The next call will be even mor
BTC-1.60%
  • Reward
  • 1
  • Repost
  • Share
AlphaSiganl:
To The Moon 🌕
$BTC Signal】Bears continue + 1H weak breakdown
$BTC RSI 1H 36.16, price has broken below EMA20 for three consecutive bearish candles. In 4H, the MACD bearish histogram continues to expand, and the lower Bollinger Band is opening downward. Although the buy-side order book depth is high, sell-side actively pushes down, and the price can’t hold above 64,000.
🎯 Direction: short
⚡ Entry/limit orders: 63395.740 - 63586.500
🛑 Stop loss: 64222.365
🚀 Target 1: 62632.702
🚀 Target 2: 62155.804
🛡️ Trade management:
- Execution plan: After reaching Target 1, reduce position by 50% and move the stop
BTC-1.59%
View Original
post-image
  • Reward
  • Comment
  • Repost
  • Share
Load More

Join 40 M users in our growing community

⚡️ Join 40 M users in the crypto craze discussion
💬 Engage with your favorite top creators
👍 See what interests you
  • Pinned