Square
Following
Hot
News
Notifications
Profile
Share your thoughts
placeholder
Article
Bitcoin is facing a notable shift in institutional money flows.

U.S. spot BTC ETFs recorded $1.92 billion in net outflows between October 30 and November 6, putting pressure on the institutional demand narrative.

The biggest development is BlackRock’s IBIT, which reportedly lost $1.44 billion over six consecutive trading days.

Friday's figures were particularly interesting:

• IBIT: $403M outflow
• Total ETF outflows: $411.9M
• Fidelity FBTC: $42.8M inflow

One detail stands out: Fidelity was the only fund to record positive flows, showing that institutional investors aren't all moving in t
BTC-0.67%
ETH-1.26%
Trenches
ZIG
Z
bade
b
ZIG
0x8c...1145
Market Cap
$.
Change
.
24h Vol
$.
Holders
.
STONK
S
bade
b
STONK
6GmA...UNgx
Market Cap
$.
Change
.
24h Vol
$.
Holders
.
IDOL
I
bade
b
IDOL
0x3b...ab07
Market Cap
$.
Change
.
24h Vol
$.
Holders
.
CLAUDIA
C
bade
b
CLAUDIA
2j5S...W2ZM
Market Cap
$.
Change
.
24h Vol
$.
Holders
.
MAGGIE
M
bade
b
MAGGIE
8rHo...PmZV
Market Cap
$.
Change
.
24h Vol
$.
Holders
.
Why are so many female celebrities attracted to gray-market tycoons?
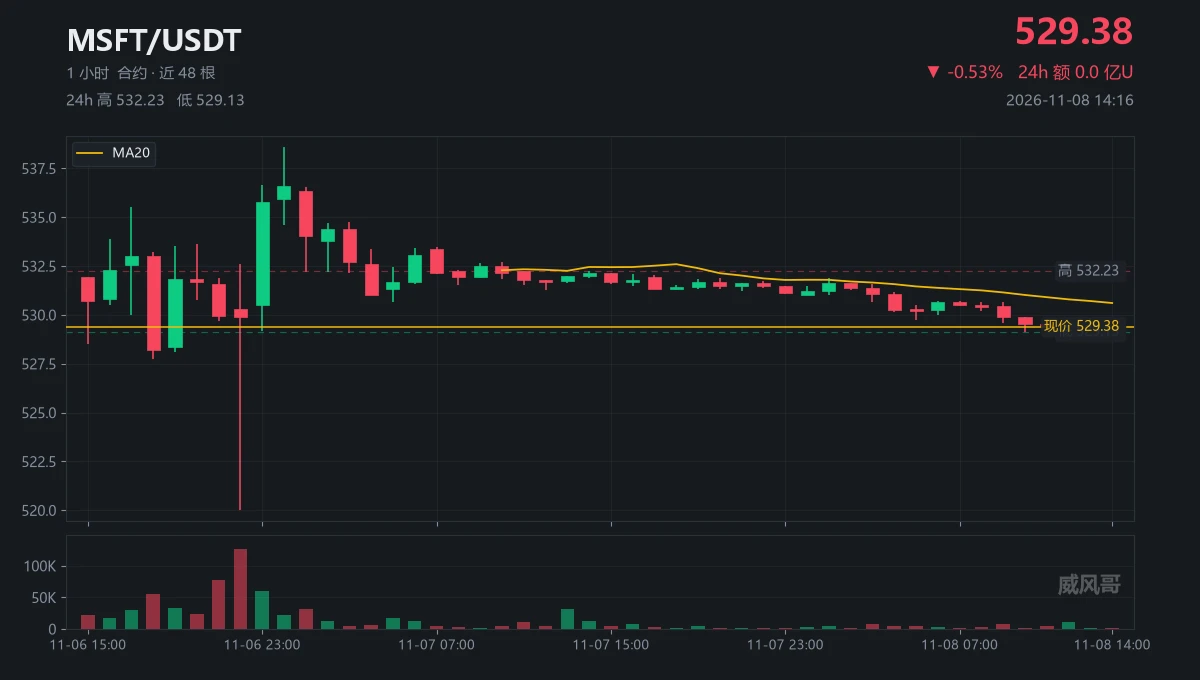
At 14:00, that candle had 1,110 lots, 30% of average volume. I checked twice.
· Position cost: stop-loss at 520.02, a $9.36 distance from 529.38.
· Reward cost: only 9.22 to 538.6, for odds of 0.98.
· Time cost: until Monday 22:30, the price won’t be determined by the market for thirty-two hours.
· Sweep cost: 1,110 lots move it $0.32; 11,541 lots move it $0.08.
· Trend cost: even after thirty-eight hours, it only recovered 9.22; it hasn’t touched 537 since 538.6.
With all five costs laid out, the gain is less than the loss. No need to run the numbers twice.
$MSFT 24-hour trading volume is $4
post-image
MSFT+0.59%
  • 1
#Ahr999EntersBottomBuyingZone
#ShareWeekly
AHR999 Indicator Enters Bitcoin’s Historical Bottom-Buying Zone: A Detailed Look at What It Means, Current Market Context, and Why Caution Remains Essential
As of early November 2026, the AHR999 indicator for Bitcoin has moved below the 0.45 threshold and entered the zone that historically has been associated with deeper value or potential accumulation opportunities. Recent readings have hovered around 0.43 (with reports citing approximately 0.429–0.431). This marks a return to the bottom-buying range for the first time since roughly August 20, 2026
🐋 WHALE WATCH : The US Treasury is buying back up to $95B of its own debt over the next three months. $70B targets older Treasuries to improve trading liquidity. $25B covers short-term Treasuries to manage cash balances.
Smoother Treasury markets push fresh liquidity into the financial system. Stocks and crypto tend to notice.
post-image
How do you read the balance of bulls and bears in BTC trading?

In BTC trading, when the price rises, many people think bulls have the upper hand; when the price falls, they think bears have taken control of the market. But the real battle between bulls and bears is not as simple as looking at whether a candlestick is red or green. You need to observe the relationship between price, trading volume, and market structure.

So how can you tell which side is currently in control?

First, observe the price structure. If BTC keeps forming higher highs and higher lows, it means buyers are continuousl
post-image
BTC-0.67%
In BTC trading, how can you develop a truly actionable trading plan?

Many BTC traders study the market every day, analyzing candlesticks, trading volume, and various technical indicators. They also often discuss whether the market will rise or fall next. But when it comes to actually trading, a common problem arises: there are no clear entry criteria, stop-losses are decided on the fly, and traders don’t know when to take profits.

That’s why some people can study the market for a long time yet still see inconsistent account performance.

To build a truly actionable trading plan, you can star
post-image
BTC-0.65%
Long-Term Investing or Short-Term Trading in BTC: Which Is Right for You?

In the BTC market, some people choose to hold for the long term, waiting for growth driven by market cycles; others study candlestick charts every day, looking for profit opportunities through short-term trading. Both approaches have their supporters, but which one is better suited to ordinary traders?

The answer isn’t which approach is guaranteed to make more money, but which one better fits your financial situation, available time and energy, and risk tolerance.

First, long-term investing focuses more on trends and
post-image
BTC-0.67%
SPOT TOKEN BEST SCALPING AND PREDICTION
live-cover
LIVE2,267
Don’t Let a Rally Go to Your Head! The More a Company Is Fawned Over, the More You Should Watch for These Warning Signs

What most easily makes people lose their sense of reason in the stock market isn’t a decline, but a rally.
When a stock keeps climbing, financial news reports on it every day, and everyone in your social circle is an investing expert. At times like this, it can feel as if not buying stocks means missing the last train to wealth.
But I think the more excitement there is, the more we should check the risks.
First, is the valuation too high? A stock price can rise for many reas
AMD+11.55%
  • 32
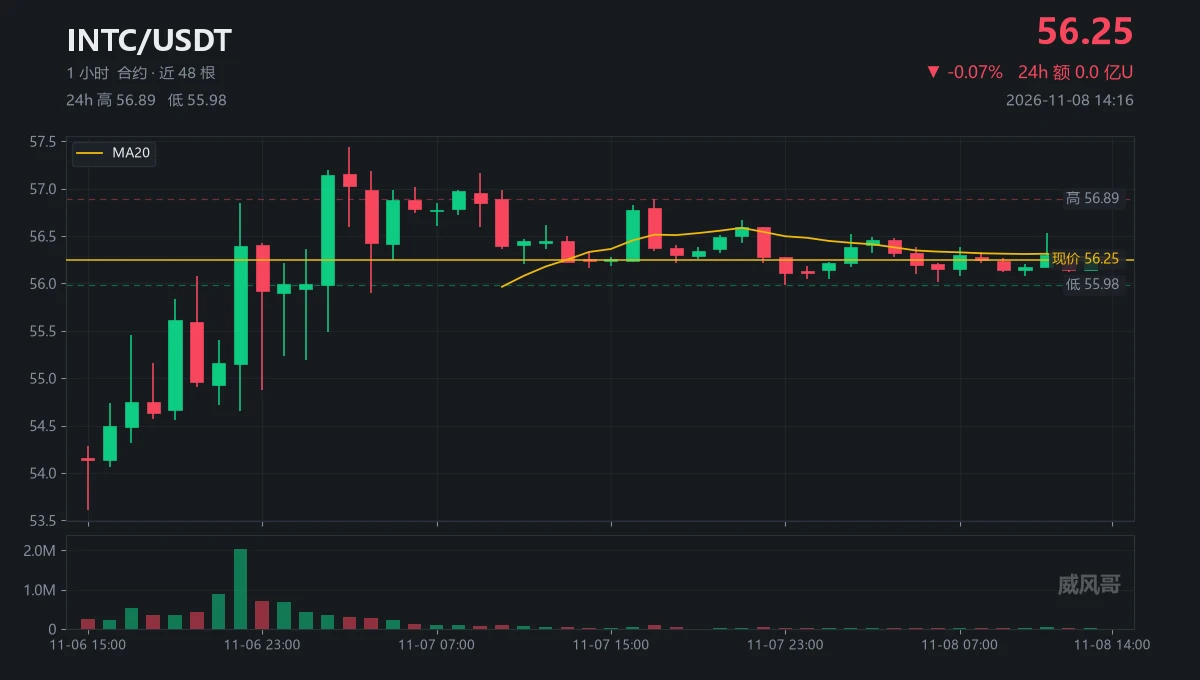
53.61 to 57.44
Twelve hours, 7.15%; this stretch had nothing to do with me.
$INTC That move happened while I had no signal; when I looked back, the price was already above 56.
The money from the second move wasn't mine; chasing in would just mean holding the bag for someone else.
Now it's 56.25, ma20 is 56.274, a difference of 0.024, right on this line.
The high of 57.44 was touched at 11-07 03:00, and it hasn't been touched again in the eleven hours since.
The low of 55.98 was at 11-07 23:00; it didn't manage to hold there either.
Funding rate: -0.0103%; shorts are paying overnight fees, but
post-image
INTC+0.05%
[new streamer]MARKET UPDATE
live-cover
LIVE1,437
#Gate股票畅聊季 U.S. stocks shed over $4 trillion in a week. When will the data center panic end?

Wall Street endured another turbulent week, with the combined market capitalization of the three major U.S. stock indexes falling by about $4.1 trillion.
The market panic stems from Democrats taking control of both chambers of Congress after the U.S. midterm elections. Investors fear tighter regulation of the artificial intelligence (AI) industry and slower approvals for data center construction, triggering a concentrated sell-off in tech stocks. Treasury yields surged after the latest nonfarm payroll
SPX+0.33%
JPMG+0.82%
HSBC-0.62%
  • 1
$IDOL Strong short: After a sharp rally, IDOL is facing strong resistance around $0.0345–$0.0355. A rejection here could trigger a deeper pullback toward lower support levels—if sellers take control, there could be substantial profits ahead. Short $IDOL Entry: $0.0338–$0.0348 Stop-loss: $0.0362 Take-profit 1: $0.0325 Take-profit 2: $0.0310 Take-profit 3: $0.0290 Take-profit 4: $0.0270 Trade here $IDOL : 👇
post-image
IDOL-6.71%
I mean, a target of 0.03 isn’t too much to ask, right
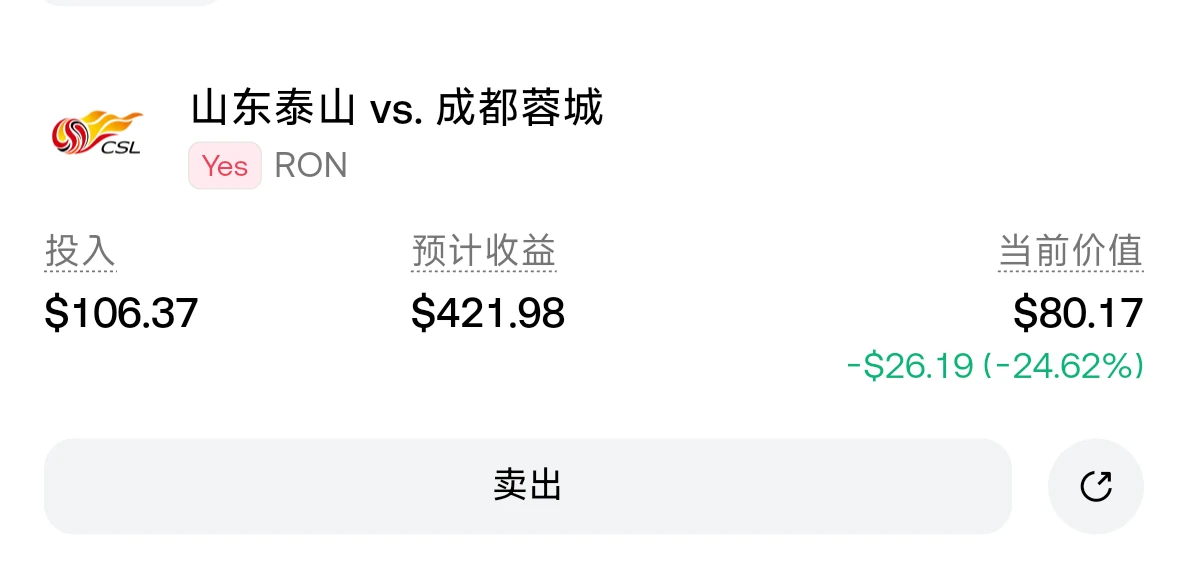
As a good citizen of Dalian, based on my real-world experience of losing no matter what match I bet on these past two days, I can only put myself in the game. Dalian, this is as far as I can help you: either you pull off a league miracle the likes of which the world has never seen, or I get 4x odds. I’ll stake 100 and accept the loss
post-image
#美股史诗级抛售 #Gate股票畅聊季 #每周来晒 The “Deleveraging” Moment in U.S. AI Stocks: A 1998 Replay Without Fed Rate Cuts to the Rescue!

This article analyzes the plunge in U.S. AI stocks and the wave of programmatic selling: at the market-structure level, leveraged ETFs and dealers’ negative Gamma triggered a mechanical selloff; at the valuation level, uncertainty over capex and returns created a rift; and at the macro level, the Fed was absent as a backstop through rate cuts. It examines whether the AI trade is replaying the 1998 LTCM crisis or heading toward a 2000-style bubble.

As buyers of AI computin
NVDA+2.80%
NDAQ+0.28%
CSCO-2.05%
CRWV+6.18%
SPX500+0.19%
#BTCETF资金持续流出 For now, continued ETF net outflows look more like short-term risk aversion and deleveraging than institutions collectively exiting Bitcoin. But the concentration of outflows in BlackRock's IBIT also shows that some large investors are adjusting their allocations.

Why this doesn't look like a collective institutional retreat
Outflows were highly concentrated: From November 2–5, cumulative outflows were about $869.8 million, of which IBIT alone accounted for about $806.5 million.
There were both inflows and outflows: On November 4, there was a net inflow of about $128 million, wi
BTC-0.31%
Load More

Join 40 M users in our growing community

⚡️ Join 40 M users in the crypto craze discussion

💬 Engage with your favorite top creators

👍 See what interests you

Trending Topics

USCPIDataIncoming

4.16k Views1.53k Discussing

The U.S. October CPI report will be released on November 10 at 8:30 a.m. ET. September CPI came in at 3.7% year over year, and markets will be watching closely for signs that inflation is cooling, especially in core CPI. A softer-than-expected reading could strengthen rate-cut expectations, while hotter inflation may pressure risk assets through higher Treasury yields and a stronger dollar. How do you think this CPI print will move $BTC, U.S. stocks and gold?

USAIStocksHitHard

24.99k Views3.71k Discussing

USNonfarmPayrolls

44.93k Views4.44k Discussing

View More