


#WeakNFPShakesRateHikeOdds
The Phantom Job Market: When Bad News Becomes Good News
The Number That Shook Wall Street
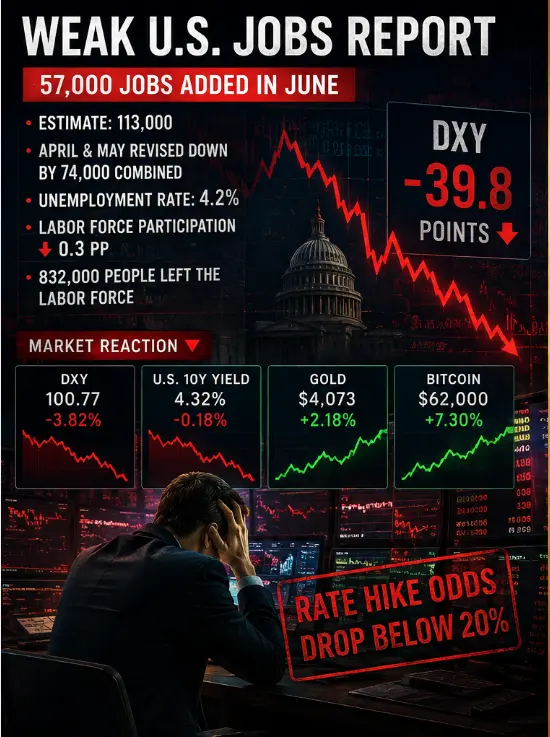
57,000.
That is not a typo. That is the number of jobs the U.S. economy added in June 2026, and it landed like a thunderclap across global markets. For context, economists had priced in 113,000 new positions. The actual figure came in at less than half that estimate, while April and May data were revised down by a combined 74,000 positions. What we witnessed was not just a miss. It was a fundamental reassessment of everything traders thought they knew about the American labor market.
The immediate market reaction was textbook macro trading. The dollar index cratered nearly 40 points. Gold surged over 2%, reclaiming ground it had lost during a brutal quarter. Bitcoin climbed from $57,750 to $62,000 in under 48 hours, a 7.3% recovery that caught many off guard. But beneath these headline moves lies something far more interesting, something I call the "Phantom Job Market Paradox."
The Phantom Job Market Paradox
Here is the uncomfortable truth the data reveals: the unemployment rate actually fell to 4.2% from 4.3%. On the surface, this looks like improvement. It is not. The decline was driven by 832,000 people leaving the labor force entirely, pushing participation to its lowest level in over five years. When nearly a million Americans stop even looking for work, that is not a healthy economy. That is surrender.
This creates a cognitive trap that catches even experienced traders. We see the unemployment rate drop and our pattern-recognition brains scream "strength." But the Phantom Job Market Paradox teaches us that headline unemployment can mask underlying deterioration. The Fed knows this. Markets are learning it the hard way.
What This Means for Fed Policy
The CME FedWatch Tool tells the story. Before this report, markets were pricing in roughly 65% odds of a September rate hike. Those probabilities have now collapsed to around 52%, with July hike odds plummeting below 20%. The expected timeline for any Fed action has shifted from October to December at the earliest.
This is the pivot point traders have been waiting for. Since the June 17 Fed meeting, the central bank has maintained a hawkish posture, driven by persistent inflation concerns and geopolitical uncertainty around the Middle East conflict. But the labor market just handed Chairman Powell an exit ramp. When employment data weakens this dramatically, the Fed's dual mandate forces a recalculation. Price stability matters, but so does maximum employment. Right now, one of those pillars is crumbling.
The Bull Case: Liquidity Is Coming
For risk assets, this is oxygen. Bitcoin's surge back above $61,000 was not coincidental. U.S. spot Bitcoin ETFs snapped a 10-day outflow streak with $222 million in fresh inflows on Thursday alone. That is institutional money returning to the table, sensing that the liquidity environment is about to shift.
The logic is straightforward. Weaker employment data reduces the probability of restrictive monetary policy. Reduced tightening expectations weaken the dollar. A weaker dollar makes dollar-denominated assets more attractive to global buyers. Gold understands this logic. Bitcoin understands it even better.
Dragon Fly Official has been tracking this divergence between traditional safe havens and digital assets. What we are seeing is the emergence of a new paradigm where Bitcoin and gold move in tandem during periods of dollar weakness, rather than competing for the same capital flows.
The Bear Case: This Is Not a Bottom
Before you rotate your entire portfolio into risk assets, consider the counterargument. The June NFP print may be a delayed response to the Middle East conflict and its impact on energy prices. Higher gasoline costs have squeezed consumer spending power and forced businesses to freeze hiring. If geopolitical tensions ease and energy prices normalize, we could see a snapback in employment data that reignites hawkish Fed expectations.
More importantly, inflation remains persistent. The Fed's 2% target is still a distant memory, and the central bank has repeatedly demonstrated its willingness to tolerate economic pain to achieve price stability. One weak jobs report does not change that calculus unless it becomes a trend.
Bitcoin's technical picture also warrants caution. While the bounce to $62,000 is impressive, we are still trading below key resistance levels. The 200-day moving average sits above current prices, and volume profiles suggest this move lacks the conviction of a genuine trend reversal. This looks more like short-covering and dip-buying than the start of a new bull run.
The Cognitive Bias at Play
Let me introduce a framework I have been developing called "Narrative Gravity." This describes how market participants overweight recent data points that confirm their existing beliefs while dismissing contradictory evidence. Right now, the crypto community is experiencing a surge of optimism because the NFP miss validates their desire for a dovish Fed pivot. But Narrative Gravity works both ways. If next month's data shows even modest improvement, the same voices celebrating this report will pivot to fear within hours.
The smart money is not making directional bets based on one data point. They are positioning for volatility. When the Fed's path becomes uncertain, option premiums expand and range-bound strategies outperform directional ones. Consider this before you FOMO into leveraged longs.
Key Levels to Watch
For Bitcoin, $60,000 has become the line in the sand. Hold above this level through the weekend, and we likely test $65,000 resistance next week. Break below, and the June lows around $53,000 come back into play. For gold, the $4,000 psychological level is now support, with resistance at the $4,200 zone that capped rallies earlier in the quarter.
The DXY dollar index at 100.77 is approaching critical support at 100.50. A break below that level would confirm the dollar's weakness and accelerate capital flows into alternative assets. Watch this level closely. It is the macro anchor for everything else.
The Road Ahead
We are entering a period of heightened uncertainty. The Fed's next move is genuinely unclear for the first time in months. Employment data has weakened, but inflation remains sticky. Geopolitical risks persist, but diplomatic channels are reportedly opening. In this environment, conviction is dangerous. Flexibility is survival.
Dragon Fly Official continues to monitor the interplay between traditional macro indicators and crypto-native flows. The ETF inflows this week are encouraging, but they represent a fraction of the capital that fled during June's drawdown. We need sustained institutional participation, not one-day wonders, to confirm a genuine trend change.
Final Thoughts
The June NFP report was a wake-up call. It reminded us that economic data can surprise in both directions, that the Fed's path is never as certain as markets assume, and that correlations between asset classes can shift faster than most traders can adapt. The Phantom Job Market Paradox is not just a clever name. It is a framework for understanding how headline statistics can mislead even sophisticated investors.
For traders, the lesson is clear: size your positions for uncertainty, not conviction. The path from here depends on whether this jobs weakness is a blip or the start of a trend. We will know more when July's data arrives. Until then, protect your capital, watch the dollar, and remember that in macro trading, being early is the same as being wrong.
Risk Warning: This analysis is for informational purposes only and does not constitute financial advice. Cryptocurrency trading carries substantial risk of loss. Past performance does not guarantee future results. Always conduct your own research and consider your risk tolerance before making investment decisions. Never trade with capital you cannot afford to lose.
The Phantom Job Market: When Bad News Becomes Good News
The Number That Shook Wall Street
57,000.
That is not a typo. That is the number of jobs the U.S. economy added in June 2026, and it landed like a thunderclap across global markets. For context, economists had priced in 113,000 new positions. The actual figure came in at less than half that estimate, while April and May data were revised down by a combined 74,000 positions. What we witnessed was not just a miss. It was a fundamental reassessment of everything traders thought they knew about the American labor market.
The immediate market reaction was textbook macro trading. The dollar index cratered nearly 40 points. Gold surged over 2%, reclaiming ground it had lost during a brutal quarter. Bitcoin climbed from $57,750 to $62,000 in under 48 hours, a 7.3% recovery that caught many off guard. But beneath these headline moves lies something far more interesting, something I call the "Phantom Job Market Paradox."
The Phantom Job Market Paradox
Here is the uncomfortable truth the data reveals: the unemployment rate actually fell to 4.2% from 4.3%. On the surface, this looks like improvement. It is not. The decline was driven by 832,000 people leaving the labor force entirely, pushing participation to its lowest level in over five years. When nearly a million Americans stop even looking for work, that is not a healthy economy. That is surrender.
This creates a cognitive trap that catches even experienced traders. We see the unemployment rate drop and our pattern-recognition brains scream "strength." But the Phantom Job Market Paradox teaches us that headline unemployment can mask underlying deterioration. The Fed knows this. Markets are learning it the hard way.
What This Means for Fed Policy
The CME FedWatch Tool tells the story. Before this report, markets were pricing in roughly 65% odds of a September rate hike. Those probabilities have now collapsed to around 52%, with July hike odds plummeting below 20%. The expected timeline for any Fed action has shifted from October to December at the earliest.
This is the pivot point traders have been waiting for. Since the June 17 Fed meeting, the central bank has maintained a hawkish posture, driven by persistent inflation concerns and geopolitical uncertainty around the Middle East conflict. But the labor market just handed Chairman Powell an exit ramp. When employment data weakens this dramatically, the Fed's dual mandate forces a recalculation. Price stability matters, but so does maximum employment. Right now, one of those pillars is crumbling.
The Bull Case: Liquidity Is Coming
For risk assets, this is oxygen. Bitcoin's surge back above $61,000 was not coincidental. U.S. spot Bitcoin ETFs snapped a 10-day outflow streak with $222 million in fresh inflows on Thursday alone. That is institutional money returning to the table, sensing that the liquidity environment is about to shift.
The logic is straightforward. Weaker employment data reduces the probability of restrictive monetary policy. Reduced tightening expectations weaken the dollar. A weaker dollar makes dollar-denominated assets more attractive to global buyers. Gold understands this logic. Bitcoin understands it even better.
Dragon Fly Official has been tracking this divergence between traditional safe havens and digital assets. What we are seeing is the emergence of a new paradigm where Bitcoin and gold move in tandem during periods of dollar weakness, rather than competing for the same capital flows.
The Bear Case: This Is Not a Bottom
Before you rotate your entire portfolio into risk assets, consider the counterargument. The June NFP print may be a delayed response to the Middle East conflict and its impact on energy prices. Higher gasoline costs have squeezed consumer spending power and forced businesses to freeze hiring. If geopolitical tensions ease and energy prices normalize, we could see a snapback in employment data that reignites hawkish Fed expectations.
More importantly, inflation remains persistent. The Fed's 2% target is still a distant memory, and the central bank has repeatedly demonstrated its willingness to tolerate economic pain to achieve price stability. One weak jobs report does not change that calculus unless it becomes a trend.
Bitcoin's technical picture also warrants caution. While the bounce to $62,000 is impressive, we are still trading below key resistance levels. The 200-day moving average sits above current prices, and volume profiles suggest this move lacks the conviction of a genuine trend reversal. This looks more like short-covering and dip-buying than the start of a new bull run.
The Cognitive Bias at Play
Let me introduce a framework I have been developing called "Narrative Gravity." This describes how market participants overweight recent data points that confirm their existing beliefs while dismissing contradictory evidence. Right now, the crypto community is experiencing a surge of optimism because the NFP miss validates their desire for a dovish Fed pivot. But Narrative Gravity works both ways. If next month's data shows even modest improvement, the same voices celebrating this report will pivot to fear within hours.
The smart money is not making directional bets based on one data point. They are positioning for volatility. When the Fed's path becomes uncertain, option premiums expand and range-bound strategies outperform directional ones. Consider this before you FOMO into leveraged longs.
Key Levels to Watch
For Bitcoin, $60,000 has become the line in the sand. Hold above this level through the weekend, and we likely test $65,000 resistance next week. Break below, and the June lows around $53,000 come back into play. For gold, the $4,000 psychological level is now support, with resistance at the $4,200 zone that capped rallies earlier in the quarter.
The DXY dollar index at 100.77 is approaching critical support at 100.50. A break below that level would confirm the dollar's weakness and accelerate capital flows into alternative assets. Watch this level closely. It is the macro anchor for everything else.
The Road Ahead
We are entering a period of heightened uncertainty. The Fed's next move is genuinely unclear for the first time in months. Employment data has weakened, but inflation remains sticky. Geopolitical risks persist, but diplomatic channels are reportedly opening. In this environment, conviction is dangerous. Flexibility is survival.
Dragon Fly Official continues to monitor the interplay between traditional macro indicators and crypto-native flows. The ETF inflows this week are encouraging, but they represent a fraction of the capital that fled during June's drawdown. We need sustained institutional participation, not one-day wonders, to confirm a genuine trend change.
Final Thoughts
The June NFP report was a wake-up call. It reminded us that economic data can surprise in both directions, that the Fed's path is never as certain as markets assume, and that correlations between asset classes can shift faster than most traders can adapt. The Phantom Job Market Paradox is not just a clever name. It is a framework for understanding how headline statistics can mislead even sophisticated investors.
For traders, the lesson is clear: size your positions for uncertainty, not conviction. The path from here depends on whether this jobs weakness is a blip or the start of a trend. We will know more when July's data arrives. Until then, protect your capital, watch the dollar, and remember that in macro trading, being early is the same as being wrong.
Risk Warning: This analysis is for informational purposes only and does not constitute financial advice. Cryptocurrency trading carries substantial risk of loss. Past performance does not guarantee future results. Always conduct your own research and consider your risk tolerance before making investment decisions. Never trade with capital you cannot afford to lose.