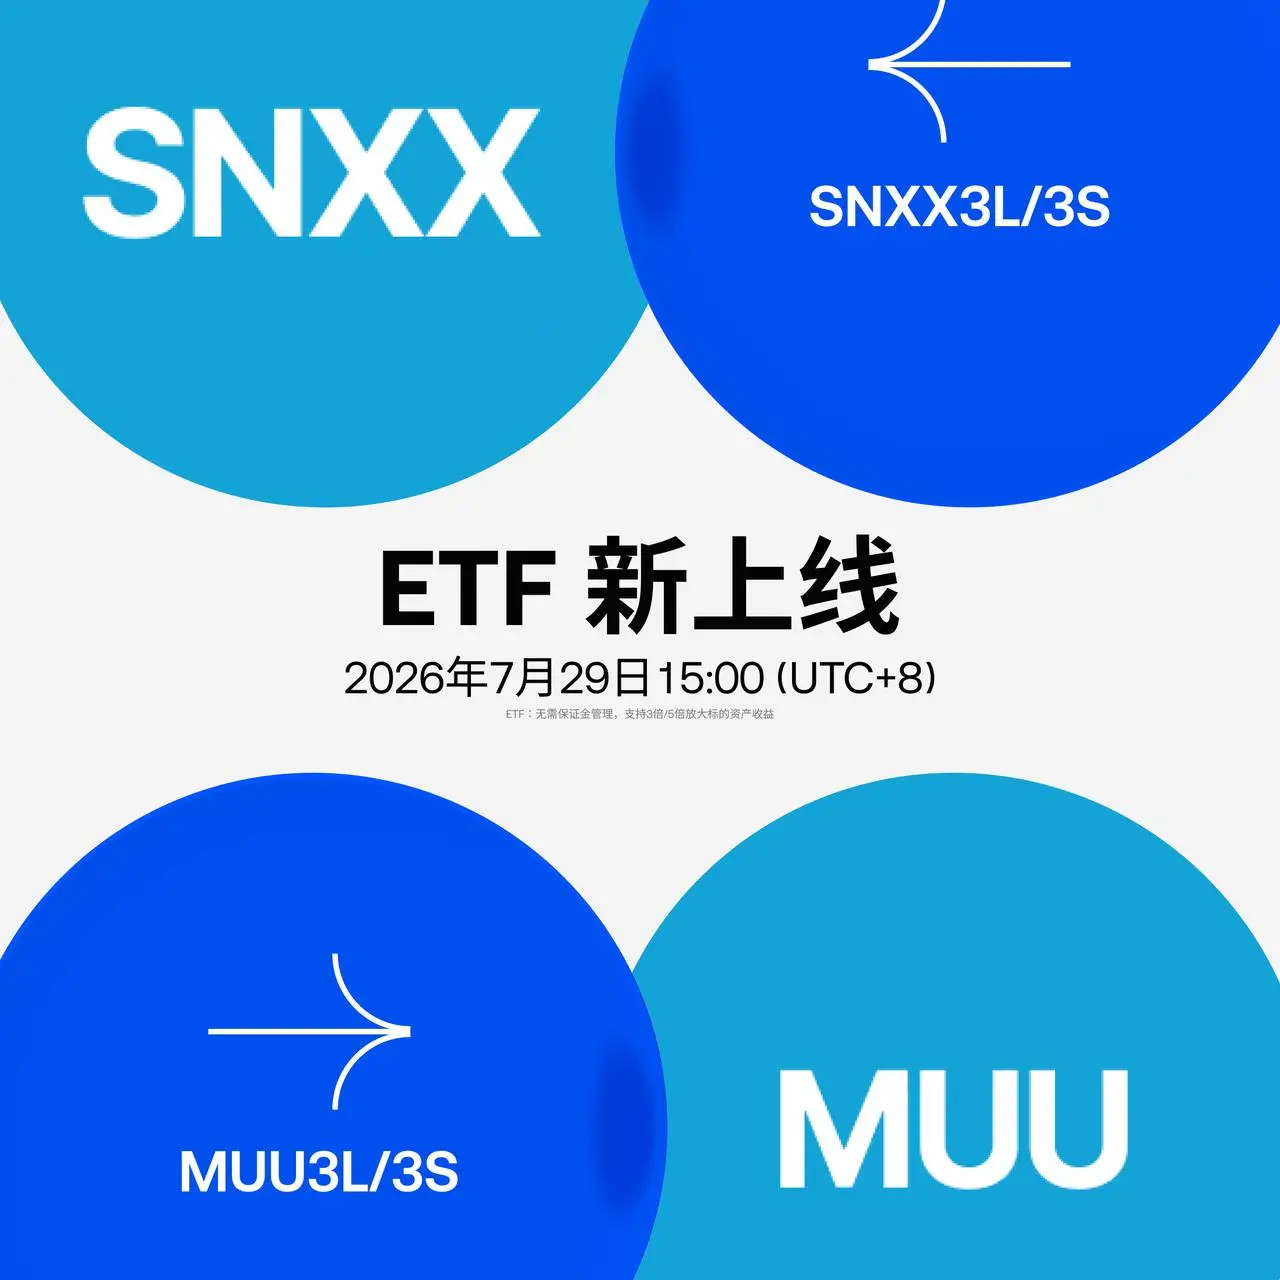
Share crypto content and earn up to 60% commissions through content mining.
placeholder
gatefun
Around four in the afternoon, the coffee shop downstairs wasn't crowded, and sunlight was slanting in, looking a bit pale.
A friend who works in foreign trade invited me to sit for a while; he just came back from the factory, still looking a bit tired.
He started by saying that this year's orders are much harder than last year's, but he's still planning to add a production line, saying as long as he holds on, the cycle will eventually return.
He spoke very naturally, with that typical judgment of "hang in there, it'll get better."
I didn't delve too deeply into this topic, just opened my phone
ETH0.29%
BTC-0.61%
View Original
post-image
  • Reward
  • Comment
  • Repost
  • Share
June 17 Morning Dawn Analysis:
Deep oscillation of candied oranges, the K-line weakens after reaching the 67,300 high point, forming a double top or M-head pattern, with the short-term trend shifting from strong to weak, currently undergoing a downward adjustment.
Around 66,100-66,700🈳, watch: around 66,100-65,300
Around 1,820-1,850🈳, watch: around 1,770-1,740
The above are all personal entertainment shares and do not constitute any investment advice.
If you choose incorrectly, then you choose incorrectly. Don’t always bully your past self; he was also very confused standing alone
BTC-0.61%
ETH0.30%
View Original
post-image
  • Reward
  • Comment
  • Repost
  • Share
The layout is in place: 2000 yuan cash red envelope
View Original
post-image
  • Reward
  • Comment
  • Repost
  • Share
Crypto Community ---- Analysis for June 17, 2026
The probability of a rate hike and the chance of maintaining a 50% rate cut are equal; only a sideways movement is possible.
As long as the speech mentions balance sheet reduction or inflation, it is a bearish outlook.
After this short-term surge, it is expected to fall back.
That day: The current price still has a divergence probability of pushing higher.
Today, the outlook is gradually bullish, with a pullback after breaking or not breaking the level...
Resistance levels: 1850, 1930, 67500, 68500
Support levels: 1730, 1680, 64500
ETH0.30%
BTC-0.61%
View Original
post-image
  • Reward
  • Comment
  • Repost
  • Share
6.17 Morning Big Cake Market Analysis
Reference Suggestions
Big Cake 65,800-66,000 bearish, target 64,500, defense 66,500
Big Cake price yesterday pulled back to a low of 65,329 and then rebounded slightly. In the early morning hours, it fell again, but did not break the previous low. In yesterday evening’s summary, the market outlook was: if the price falls below 65,500, the next step would look toward 64,500. Last night at around 10 o’clock, it dropped to the bottom, but throughout the night it remained along the lower Bollinger Band. Today, it is unlikely to have a clear direction. In the
BTC-0.61%
ETH0.29%
View Original
post-image
  • Reward
  • Comment
  • Repost
  • Share
BTC morning market
gate liveLIVE
832
  • Reward
  • 2
  • Repost
  • Share
User_any:
2026 GOGOGO 👊
View More
June 17 BTC/ETH Miken Strategy
Wosh's debut is imminent, at 2 a.m. Beijing time, the new Federal Reserve Chair Wosh will preside over his first FOMC meeting. Let's see what kind of feedback the global markets will have towards Wosh. There's an old Chinese saying: a new official makes three fires when taking office. Let's look forward to it together. Currently, both targets have entered the dense area of previous trapped positions, and there will be considerable pressure. The pace should be slowed appropriately, wait for signals, wait for confirmation, and do not chase.
BTC: The previous tw
ETH0.29%
View Original
post-image
post-image
  • Reward
  • 2
  • Repost
  • Share
IndianOldSparrow:
Where is Bitcoin's current support level?
What is the biggest risk?
View More
This wave of $ARKM 's pullback is very clear, and the profit margin for short positions has already opened.
Earlier, it was repeatedly testing around 0.1481, and the order book couldn't push higher, showing obvious signs of a pullback. It's more comfortable to go short with the trend, and my approach is to short.
The market has already pulled back to 0.1374, with a +71.65% profit—hold onto it, my previous judgment was not wrong.
Stay cautious for now, take 75% profits first, and keep the remaining 25% to see if there's a second wave.
Those who have already followed, set your stop-loss properly
ARKM6.50%
BTC-0.61%
ETH0.29%
View Original
post-image
  • Reward
  • Comment
  • Repost
  • Share
Why $H /USDT is signaling the same fakeout pattern that burned 80% of traders last month.

$H /USDT - SHORT

Trade Plan:
Entry: 0.28286 – 0.29898
SL: 0.36833
TP1: 0.23286
TP2: 0.19416
TP3: 0.13611

Why this setup?
SHORT bias at 55% confidence with 1D range trend. RSI on 15m sits at 54.85—neutral, not overbought. Entry at 0.29092 with TP1 at 0.23286 gives a 20% drop zone. ATR on 1h shows 0.032253 volatility, meaning the squeeze is tight. Why now? Range markets love sudden breakdowns when no one expects them.

Debate:
Is this a trap to the downside or the start of a real dump before the next
H24.10%
post-image
post-image
  • Reward
  • Comment
  • Repost
  • Share
Do you still believe in alt season
post-image
  • Reward
  • Comment
  • Repost
  • Share
#MyGateTradeStory
If I could go back to my first day of trading, I would tell myself these 3 things.
When I placed my first trade, I thought success in the market was all about finding the next big winner. I spent hours looking for price predictions, searching for "guaranteed" opportunities, and trying to identify which coin or stock would deliver the biggest gains. Like many beginners, I believed that making money in trading was mainly about being right.
Years later, after experiencing both profitable trades and painful losses, I realized something important: successful trading has very litt
post-image
post-image
post-image
  • Reward
  • 14
  • Repost
  • Share
ybaser:
To The Moon 🌕
View More
🚨 BOT 9: Active 15m upside momentum
Your view: momentum continuation or short-term overextension?
Symbol: $BSBUSDTDirection: LONGTimeframe: 15mScan period: last 24 hours
What the bot looks for:movement greater than 20% from the 24h low or high, while current price remains within 5% of the move extreme.
24h low: 0.26688High after low: 0.44163Move from 24h low: +65.48%Current close: 0.431Distance from high: 2.41%
Signal step: 60%Previous posted step: 50%Next repeat only after another 10% step.
The move is still active because price is within the allowed distance from the high.
Bot is in test mo
post-image
  • Reward
  • Comment
  • Repost
  • Share
$ESPORTS | 1H | Breakdown Fade
Bias: Short
Entry Zone: 0.0730 to 0.0740
Stop Loss: 0.0765
Targets:
TP1: 0.0670
TP2: 0.0645
TP3: 0.0607
Invalidation:
Close above 0.0765
Why This Setup:
I’m fading the rebound into the prior breakdown area, where price is still trading below the recent swing high and major resistance remains overhead. The structure is weak, and a failed retest of the 0.0730 to 0.0740 zone gives me a clean short back toward the lower range.
#GateSquareMayTradingShare
ESPORTS41.08%
post-image
  • Reward
  • Comment
  • Repost
  • Share
SpaceX goes public, how should we strategize? Who will be the winner in tonights game?
gate liveLIVE
861
live-coin
  • Reward
  • 1
  • Repost
  • Share
User_any:
To The Moon 🌕
$BEAT It's getting more and more, sisters.
BEAT-44.61%
View Original
post-image
  • Reward
  • Comment
  • Repost
  • Share
1. Market Review: From Sharp Drop to Rebound, Strength Doubtful
In early June, Bitcoin experienced a brutal sell-off. On June 5th, BTC first broke below the $60k psychological level in over four years, dropping as low as $59,207; that week, it fell 16%, marking the most severe weekly decline since the FTT collapse in November 2022. Since then, prices have oscillated weakly within the $61,000-$64,000 range.
A turning point occurred on June 14th—when the US and Iran announced a temporary peace agreement and the Strait of Hormuz would reopen. Boosted by this, Bitcoin quickly rebounded, rising to
BTC-0.61%
View Original
post-image
FatYa888
1. Market Review: From Sharp Drop to Rebound, Strength Doubtful
In early June, Bitcoin experienced a fierce sell-off. On June 5th, BTC first broke below the $60k psychological level in over four years, dropping as low as $59,207; that week, it fell 16%, marking the most severe weekly decline since the FTT collapse in November 2022. Since then, prices have oscillated weakly in the $61,000-$64,000 range.
A turning point occurred on June 14th—when the US and Iran announced a temporary peace agreement, and the Strait of Hormuz would reopen. Boosted by this, Bitcoin quickly rebounded, rising to $66,805 on June 15th, and further climbing above $66,000 on June 16th, reaching the highest level since the sharp decline in early June. As of June 16th, BTC hovered around $66,000, with a high of $67,217 intraday before retreating.
The current rebound was mainly driven by a temporary easing of geopolitical risks, but its strength and sustainability are doubtful. Compared to the Nasdaq 100 futures rising 2.5% and S&P 500 futures up 1.6%, Bitcoin’s rebound appears relatively restrained.
---
2. Technical Analysis: Major Cycle Under Pressure, Short Cycle Rebound
On the daily chart, Bitcoin remains below the 20-day moving average (about $66,700), with all cycle moving averages in a bearish alignment—20-day EMA ($66,600), 50-day EMA ($70,600), 100-day EMA ($73,200), 200-day EMA ($78,600)—forming a typical bearish structure. The daily RSI is around 42, in a neutral to weak zone, neither oversold enough to trigger a strong rebound nor showing momentum for sustained upward movement. The overall downtrend remains unbroken.
On the shorter cycle, the hourly chart shows a clear upward channel, with prices above short-term moving averages. Key resistance zones are between $66,000 and $68,000—areas that were heavily traded bottoms in February and April. Bulls need to break through and hold above this zone with increased volume to confirm a reversal of the downtrend since May; otherwise, it may just be a corrective rebound.
For short-term support, there is a bullish trendline near $64,200 built from active support structures; the critical bottom support zone is between $60,000 and $59,900. A confirmed break below this level could target liquidity levels around $56,000-$52,000.
---
3. Market Liquidity and Sentiment: Institutions Have Not Truly Returned
ETF outflows remain the biggest structural headwind. Since mid-May, US spot Bitcoin ETFs have net outflows exceeding $4.75 billion; in June alone, about $2.1 billion has been withdrawn, with BlackRock experiencing redemptions for five consecutive weeks. Although there was a single-day net inflow of $85.85 million on June 12th, this was more of a tentative dip-buying attempt, and the long-term capital exit trend has not fundamentally reversed.
Stablecoin liquidity continues to shrink. The total reserves of exchange-held stablecoins dropped from a peak of $75.12 billion in November 2025 to $62.81 billion on June 10th, a decline of nearly 16%, indicating that new funds have yet to re-enter the market.
Market sentiment, as measured by the crypto fear and greed index, remains in "extreme fear." In the derivatives market, the total liquidation amount over 24 hours reached $339 million, with over 70% of liquidations being shorts—indicating that this rebound is more driven by short covering pulses rather than fresh capital inflows causing a fundamental reversal.
---
4. Key Macro Variables: Three "Boots" Awaiting Drop
First, the Federal Reserve FOMC meeting (June 17-18). The market prices in a 98.2% probability of holding rates steady, but with US CPI year-over-year rising to 4.2% in May—its highest in three years—expectations for a rate cut have been pushed back to 2027. If the meeting signals a hawkish stance, the rebound could quickly fizzle.
Second, the formal signing of the US-Iran agreement (June 19). Previous ceasefires in April and June 9 failed, with all gains erased. Israeli strikes on Lebanon suggest the Middle East tinderbox remains untripped, and execution risks of the agreement still exist.
Third, Japan’s central bank raising interest rates. On June 16th, the Bank of Japan increased its policy rate by 25 basis points to 1%, the highest since 1995. Yen carry trades are tightening, potentially triggering chain reactions in high-leverage assets.
---
5. Diverging Institutional Views
· Bullish (Standard Chartered): Believes $59,000 has essentially formed a bottom, maintaining a target of $100k by the end of 2026.
· Bearish: Points out that the market has not yet shown typical "capitulation selling," and the true bottom may be in the $40,000-$46,000 range.
· Fidelity emphasizes that the market is currently in a "volatility narrowing" phase.
---
6. Summary
Currently, Bitcoin is in a contradictory pattern of "major cycle under pressure, short cycle rebound." Around $60,000, some analysts see a "behavioral pressure zone," while $48k is viewed as a "structural risk boundary." The short-term rebound is driven by geopolitical news, resembling an event-driven pulse rather than a trend reversal.
Key variables for future movement include: Federal Reserve policy signals, whether ETF capital flows can sustain positive momentum, and the implementation of the US-Iran agreement. Before the $66,700 resistance is effectively broken and ETF inflows are confirmed, blindly chasing the rally carries significant risk, and traders should watch out for a secondary correction after the rebound. #我的Gate交易时刻
repost-content-media
  • Reward
  • 2
  • Repost
  • Share
ybaser:
Just charge forward 👊
View More
#MyGateTradeStory
ETH Trading Strategy and Key Levels
Current ETH Price: 1794
Key Support Levels
Immediate support is at 1758, which matches today's low. If this level breaks, the next support zone falls between 1700 and 1725. This range has shown buyer interest and forms a strong accumulation zone. Should the market weaken further, the 1650 level becomes the next major support where heavy buying was observed in previous weeks. The most critical support is 1505, which was the recent crash bottom. If this breaks, the bearish scenario could extend to 1400. Traders should remain watchful at thes
ETH0.30%
BTC-0.61%
post-image
post-image
  • Reward
  • 7
  • Repost
  • Share
ybaser:
Just charge forward 👊
View More
The market retreated from around 66,300 to around 65,500 in the early morning and then maintained a small range of fluctuation. There is still resistance above.
Wednesday morning:
The market is around 66,000-66,500, look towards 65,000-64,500.
The market is around 18:10-18:35, look towards #我的Gate交易时刻 17:65-17:35.
ETH0.30%
BTC-0.61%
View Original
post-image
post-image
post-image
  • Reward
  • 1
  • Repost
  • Share
PrinceZhaoHodl1:
Just charge forward 👊
Xiaohongshu is worth recommending, you can watch the World Cup while enjoying beautiful women.
View Original
post-image
post-image
post-image
post-image
  • Reward
  • Comment
  • Repost
  • Share
$BTC Next Best Short Oppurtunity Coming Up!?
Looking for another pump up to test the 15 minute 200MA.
NFA, DYOR ⚠️
#Crypto #Trading #BTC
BTC-0.61%
post-image
  • Reward
  • Comment
  • Repost
  • Share
Load More