





#夏日创作营 U.S. stock market crash drags Bitcoin below $64k; Ethereum loses $1,900—before the Fed’s rate decision, bulls and bears go to battle
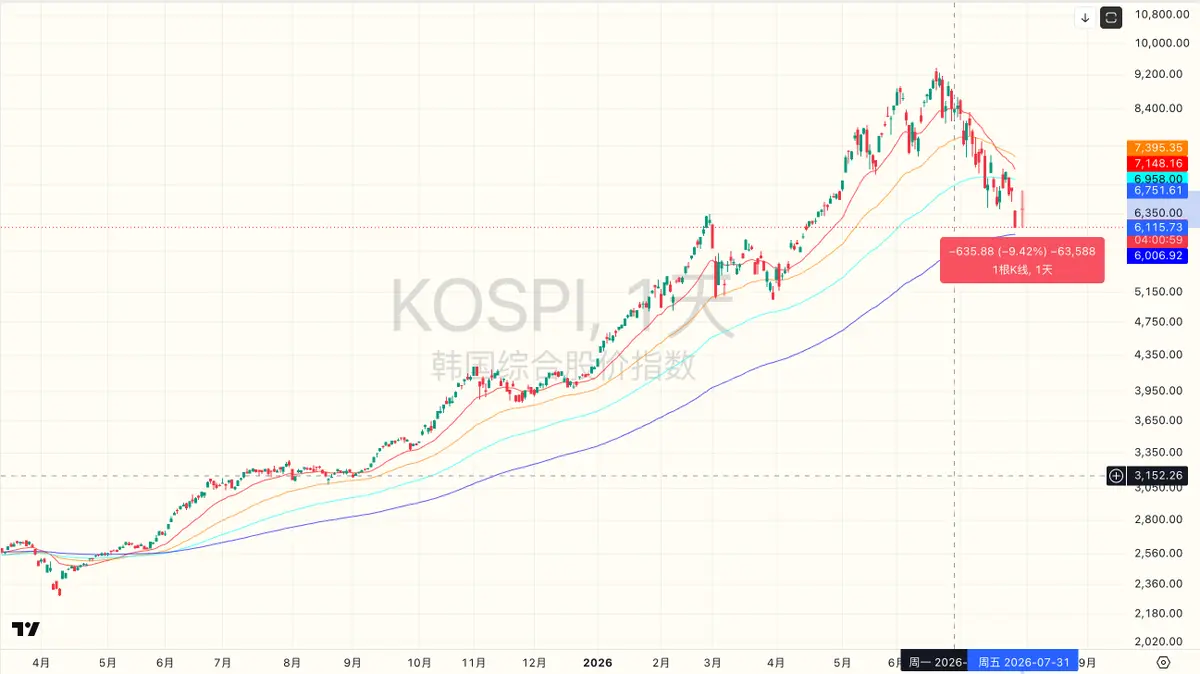
Oil prices plunged 8%, which should be a positive. But the panic sell-off in U.S. tech stocks is dragging the crypto market into the abyss. Bitcoin fell below $64,000, Ethereum slipped under the $1,900 mark, and nearly 100k liquidations wiped out positions and pushed traders to exit. With the countdown to the Federal Reserve’s rate decision underway, the hawkish “zero tolerance” remarks from Waller hang over the market like a sword—so is this the start of a deep retracement, or the last drop before the decision?
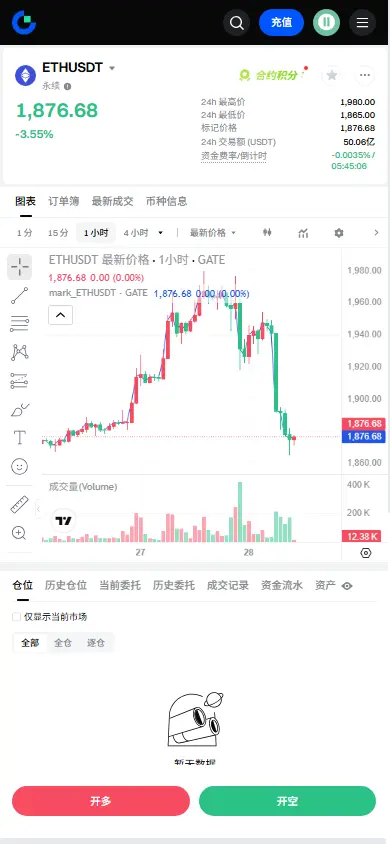
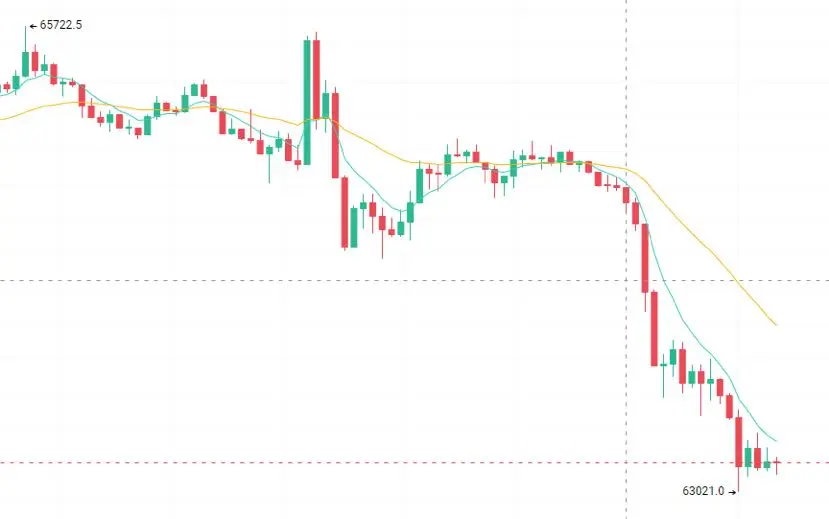
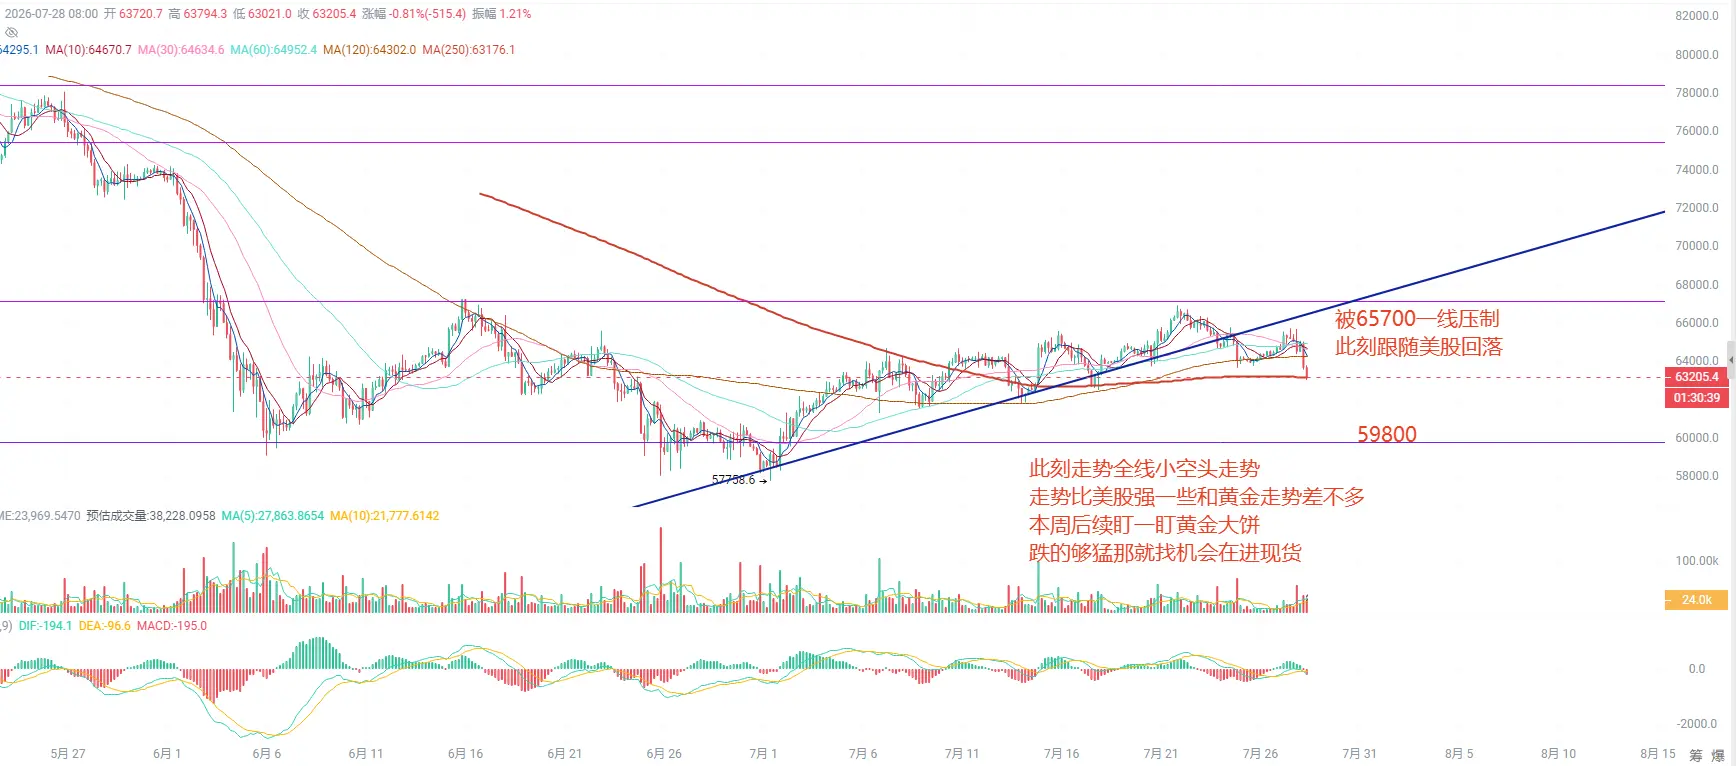
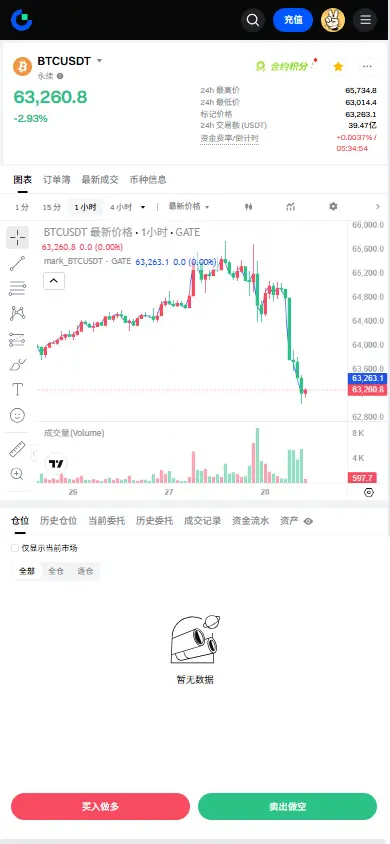
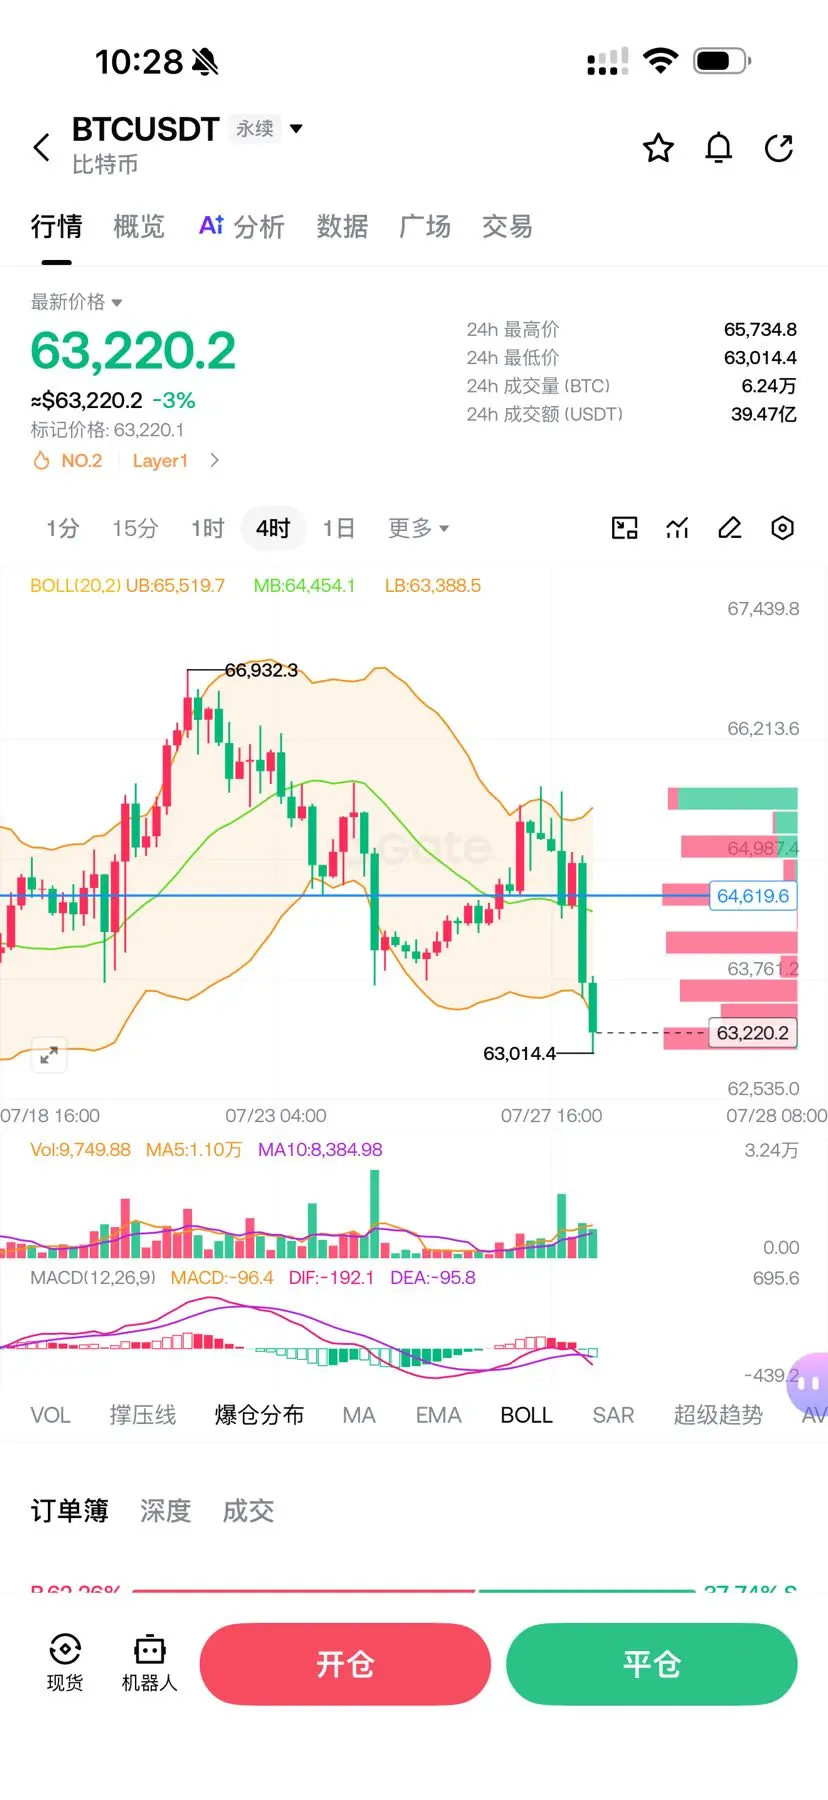
As of the time of writing on July 28, 2026, Bitcoin (BTC) is trading in the $63,988–$64,850 range, down about 0.89%-2.56% over 24 hours. It briefly dipped below the $64,000 mark during the day. Ethereum (ETH) is at $1,887–$1,939, down about 2.4%-3.5% over 24 hours, and briefly fell below the $1,900 level. The Fear and Greed Index is 37, still in the “Fear” zone.
I. Market snapshot: Panic transmission from U.S. tech stocks, both coins under pressure and down
On July 28, the crypto market saw a broad pullback as it was weighed down by panic selling in U.S. tech stocks. Bitcoin briefly surged above $65,600 early in the U.S. session, then quickly turned lower as tech stocks plunged across the board. As of the time of writing, BTC is in the $63,988–$64,850 range, down 0.89%-2.56% over 24 hours. Bitcoin’s market cap is about $1.27 trillion, having retreated about 4.5% from the July 22 high of $66,900. Ethereum’s decline is more pronounced, trading in the $1,887–$1,939 range, down about 2.4%-3.5% over 24 hours. ETH has already broken below the $1,900 integer level, with an intraday low near $1,885. The ETH/BTC ratio has edged lower, and capital rotation has been temporarily hindered. Altcoins also fell in sync. Solana is down 2.79% to $74.44, XRP down 3.83% to $1.06, BNB down 1.40% to $567.29, and HYPE has crashed 5.8% to $56.17. Total crypto market cap is below about $2.2 trillion. Liquidation data shows that over the past 24 hours, liquidation amounts across the market have significantly expanded, with longs becoming the main victims of this leg down. Under the dual pressure of panic in U.S. markets and uncertainty ahead of the Fed’s rate decision, leveraged positions are being passively liquidated. On sentiment, the Fear and Greed Index is 37, slightly down from the past few days, and remains in the “Fear” zone. South Korea’s “inverse kimchi premium” widened further; Korea’s “Up premium index” fell to -0.19%, indicating domestic investors are more bearish than overseas investors.
II. The driver of the plunge: The logic chain is rather contradictory—oil prices plunged 8% (should be supportive), yet it was completely overwhelmed by tech-stock panic
Oil prices plunged 8%: geopolitically driven risk premium fades quickly
From July 27 to July 28, international oil prices saw a rare sharp drop. Brent crude futures fell 8.7% from the prior trading day to $88.36 per barrel, while WTI crude plunged 7.5% to $82.61 per barrel. The key reason for the oil plunge was that U.S. air strikes against Iran saw a temporary pause, sharply easing market worries about disruptions to supply through the Strait of Hormuz. Under the traditional logic—oil prices plunge → inflation expectations cool → Fed rate-hike expectations weaken → valuation repair for risk assets—this should benefit crypto. But this time, the transmission chain was cut off in the second leg.
Panic in U.S. tech: concern over the AI bubble fully erupts and truly crushes the market—what really weighed the market down is the collective collapse of U.S. tech stocks. After Alphabet raised its full-year capital expenditure guidance to $205 billion, free cash flow turned negative for the first time in a decade. Tesla also sparked broad concern about the returns on AI investment as profits slid and cash flow turned negative. Panic selling in tech stocks spread throughout the entire risk-asset market, and crypto—being a high-beta asset—was hit first. Senior derivatives trader Ivan Lim said: “Macroeconomic uncertainty is expected to persist this week, but Bitcoin’s structural outlook is still optimistic. Recent outflows from spot ETF funds and market turmoil are largely reactions to delays in the CLARITY Act legislation and accelerated expectations for Fed rate hikes.”
III. The macro storm’s eye: the Fed meeting is in the countdown
On July 28-29, the Fed will hold its rate decision meeting—this is the second policy meeting since Waller took office, and the biggest uncertainty variable for the current market. While the probability of rate hikes has decreased, the hawkish tone has not changed. Although both June CPI and PPI cooled and market expectations for a July hike have already fallen sharply, Fed Chair Waller has recently reiterated a hardline stance of “zero tolerance” toward inflation, keeping concerns about hikes in September from fading. Analysts clearly pointed out that part of the market volatility comes from “accelerated expectations of Fed rate hikes.”
Dot-plot suspense: Is the door to September hikes closing?
The focus of this meeting is not on the July interest rate itself (the market has essentially priced in no change), but rather on hints about the Fed’s policy path in September and afterward. If the dot plot or Waller’s press conference releases any signal that the hiking cycle is not over, risk assets could face fresh waves of selling pressure; conversely, if any hint of a shift toward a dovish stance appears, it could trigger a retaliatory rebound. Meanwhile, the shadow of the delayed CLARITY Act continues: the legislative progress of the CLARITY Act is still dragging. The market had expected it could break through before the Senate’s summer recess on August 7, but as of now there is still no substantive progress. The ongoing presence of this regulatory uncertainty is suppressing institutions’ willingness to enter the market.
IV. Technical outlook: key support levels face a test
Bitcoin: $64,000 is the pivot between bulls and bears
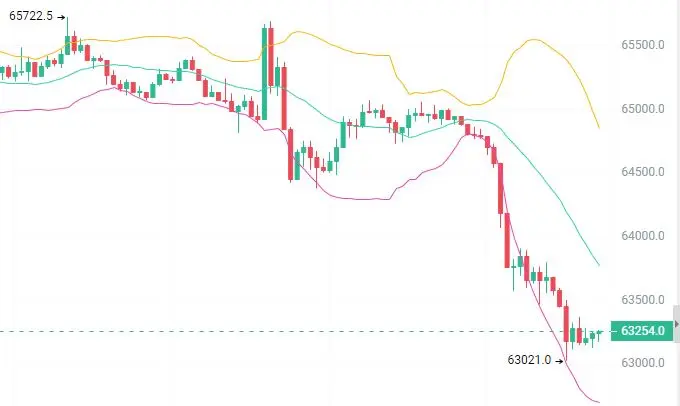
BTC has broken below the $65,000 integer level and is testing the validity of support near $64,000.
Key supports:
$63,700–$64,000: the zone currently being tested; also today’s low area
$63k–$63,500: the 200-week moving average region
$62,000: a key lifeline for medium-term longs
If $63K fails, the next defense is critical resistance:
$64,800–$65,000: the primary target for a rebound; recovering would likely require U.S. stocks to stabilize
$65,600–$66,000: the high area before the early U.S. session plunge
$66,500–$67,000: a strong medium-term resistance zone
Gate analysts noted that after BTC surged to and touched the upper Bollinger Band on the 15-minute timeframe, it came under pressure; it quickly pulled back to seek support at the lower band, with the low reaching $64,418. On the hourly timeframe, after a “false break” below $64,600 support, price consolidated briefly and rebounded quickly, and is now trading within the $65,700–$64,600 range. The market is in a critical window for directional selection.
Ethereum: whether it holds or loses the $1,900 level decides the short-term direction
ETH has broken below the $1,900 integer level.
Key supports:
$1,880–$1,900: the zone currently being tested
$1,850–$1,870: next defense if $1,880 is lost
$1,797: the MA144 area; a strong support zone
Key resistances:
$1,920–$1,940: primary rebound target
$1,960–$2,000: the psychological level and a medium-term resistance area
Analysts noted that ETH received temporary support near $1,928 at the lower Bollinger Band, but price is trading tightly along the lower band, and bearish momentum remains dominant. The key support below is around $1,878; if the lower band holds, ETH may form a short-term bottom. Traders should stay patient and wait for signs of stabilization.
V. Outlook: three major things decide the direction
Over the next 48 hours, three core variables will determine where the crypto market goes:
Variable 1: the July 28-29 FOMC meeting (most core). There’s not much suspense in the rate decision itself, but the wording in Waller’s press conference and the direction of the dot plot will determine the policy tone for the second half of the year. If hawkish signals are released, crypto may continue to face pressure; if a pivot toward a more dovish stance appears, it could trigger a retaliatory rebound.
Variable 2: whether panic in U.S. tech stocks can subside. Concerns about AI spending sparked by Alphabet and Tesla are still unfolding. If tech stocks continue falling, crypto, as a high-beta asset, is unlikely to escape.
Variable 3: CLARITY Act legislative progress. With only about 10 working days left before the Senate’s summer recess, if the bill makes a breakthrough, it will become a key catalyst for the medium-term行情.
VI. Trading advice: look more, move less before the rate decision
For short-term traders
The current market is in a wait-and-see period before the Fed’s rate decision; it is advised to stay highly alert and avoid heavy positioning until the direction becomes clear.
BTC strategy: Watch how the $64,000 support holds. If it holds and U.S. stocks stabilize, you can cautiously participate in a rebound with targets of $64,800–$65,000. If there is a clear breakdown below $63,700, be wary of further downside toward $63,000. Before the outcome of the rate decision is released, it is recommended to look more and trade less.
ETH strategy: Watch the $1,880–$1,900 support zone. The KDJ has entered oversold territory, and a technical short-term rebound is possible. If it holds, you can cautiously participate with targets of $1,920–$1,940; if it breaks below $1,850, cut losses decisively.
For medium- to long-term investors
Although the short term is under pressure, analysts noted that “Bitcoin’s structural outlook remains optimistic.” The logic behind the cooling of inflation expectations from the oil price plunge, potential inflows of ETF funds, and the long-term positive outlook from the CLARITY Act has not changed. The $63,000–$64,000 zone still offers value for staged allocations from a long-term perspective. It is recommended to wait until the FOMC outcome becomes clearer before reassessing opportunities to position.
Risk warnings:
Hawkish FOMC risk: If Waller releases a strong hawkish signal, the crypto market could face another round of selling pressure
Continued decline in U.S. tech stocks: If concerns about the AI bubble keep building, risk appetite may stay under pressure
CLARITY Act delay: If legislative progress cannot be pushed forward before the recess, it may further suppress market sentiment
Risk of a break of $64,000: If it breaks clearly, it could open the door to further downside toward $63,000 or even lower
Oil prices plunged 8%, which should be a positive. But the panic sell-off in U.S. tech stocks is dragging the crypto market into the abyss. Bitcoin fell below $64,000, Ethereum slipped under the $1,900 mark, and nearly 100k liquidations wiped out positions and pushed traders to exit. With the countdown to the Federal Reserve’s rate decision underway, the hawkish “zero tolerance” remarks from Waller hang over the market like a sword—so is this the start of a deep retracement, or the last drop before the decision?
As of the time of writing on July 28, 2026, Bitcoin (BTC) is trading in the $63,988–$64,850 range, down about 0.89%-2.56% over 24 hours. It briefly dipped below the $64,000 mark during the day. Ethereum (ETH) is at $1,887–$1,939, down about 2.4%-3.5% over 24 hours, and briefly fell below the $1,900 level. The Fear and Greed Index is 37, still in the “Fear” zone.
I. Market snapshot: Panic transmission from U.S. tech stocks, both coins under pressure and down
On July 28, the crypto market saw a broad pullback as it was weighed down by panic selling in U.S. tech stocks. Bitcoin briefly surged above $65,600 early in the U.S. session, then quickly turned lower as tech stocks plunged across the board. As of the time of writing, BTC is in the $63,988–$64,850 range, down 0.89%-2.56% over 24 hours. Bitcoin’s market cap is about $1.27 trillion, having retreated about 4.5% from the July 22 high of $66,900. Ethereum’s decline is more pronounced, trading in the $1,887–$1,939 range, down about 2.4%-3.5% over 24 hours. ETH has already broken below the $1,900 integer level, with an intraday low near $1,885. The ETH/BTC ratio has edged lower, and capital rotation has been temporarily hindered. Altcoins also fell in sync. Solana is down 2.79% to $74.44, XRP down 3.83% to $1.06, BNB down 1.40% to $567.29, and HYPE has crashed 5.8% to $56.17. Total crypto market cap is below about $2.2 trillion. Liquidation data shows that over the past 24 hours, liquidation amounts across the market have significantly expanded, with longs becoming the main victims of this leg down. Under the dual pressure of panic in U.S. markets and uncertainty ahead of the Fed’s rate decision, leveraged positions are being passively liquidated. On sentiment, the Fear and Greed Index is 37, slightly down from the past few days, and remains in the “Fear” zone. South Korea’s “inverse kimchi premium” widened further; Korea’s “Up premium index” fell to -0.19%, indicating domestic investors are more bearish than overseas investors.
II. The driver of the plunge: The logic chain is rather contradictory—oil prices plunged 8% (should be supportive), yet it was completely overwhelmed by tech-stock panic
Oil prices plunged 8%: geopolitically driven risk premium fades quickly
From July 27 to July 28, international oil prices saw a rare sharp drop. Brent crude futures fell 8.7% from the prior trading day to $88.36 per barrel, while WTI crude plunged 7.5% to $82.61 per barrel. The key reason for the oil plunge was that U.S. air strikes against Iran saw a temporary pause, sharply easing market worries about disruptions to supply through the Strait of Hormuz. Under the traditional logic—oil prices plunge → inflation expectations cool → Fed rate-hike expectations weaken → valuation repair for risk assets—this should benefit crypto. But this time, the transmission chain was cut off in the second leg.
Panic in U.S. tech: concern over the AI bubble fully erupts and truly crushes the market—what really weighed the market down is the collective collapse of U.S. tech stocks. After Alphabet raised its full-year capital expenditure guidance to $205 billion, free cash flow turned negative for the first time in a decade. Tesla also sparked broad concern about the returns on AI investment as profits slid and cash flow turned negative. Panic selling in tech stocks spread throughout the entire risk-asset market, and crypto—being a high-beta asset—was hit first. Senior derivatives trader Ivan Lim said: “Macroeconomic uncertainty is expected to persist this week, but Bitcoin’s structural outlook is still optimistic. Recent outflows from spot ETF funds and market turmoil are largely reactions to delays in the CLARITY Act legislation and accelerated expectations for Fed rate hikes.”
III. The macro storm’s eye: the Fed meeting is in the countdown
On July 28-29, the Fed will hold its rate decision meeting—this is the second policy meeting since Waller took office, and the biggest uncertainty variable for the current market. While the probability of rate hikes has decreased, the hawkish tone has not changed. Although both June CPI and PPI cooled and market expectations for a July hike have already fallen sharply, Fed Chair Waller has recently reiterated a hardline stance of “zero tolerance” toward inflation, keeping concerns about hikes in September from fading. Analysts clearly pointed out that part of the market volatility comes from “accelerated expectations of Fed rate hikes.”
Dot-plot suspense: Is the door to September hikes closing?
The focus of this meeting is not on the July interest rate itself (the market has essentially priced in no change), but rather on hints about the Fed’s policy path in September and afterward. If the dot plot or Waller’s press conference releases any signal that the hiking cycle is not over, risk assets could face fresh waves of selling pressure; conversely, if any hint of a shift toward a dovish stance appears, it could trigger a retaliatory rebound. Meanwhile, the shadow of the delayed CLARITY Act continues: the legislative progress of the CLARITY Act is still dragging. The market had expected it could break through before the Senate’s summer recess on August 7, but as of now there is still no substantive progress. The ongoing presence of this regulatory uncertainty is suppressing institutions’ willingness to enter the market.
IV. Technical outlook: key support levels face a test
Bitcoin: $64,000 is the pivot between bulls and bears
BTC has broken below the $65,000 integer level and is testing the validity of support near $64,000.
Key supports:
$63,700–$64,000: the zone currently being tested; also today’s low area
$63k–$63,500: the 200-week moving average region
$62,000: a key lifeline for medium-term longs
If $63K fails, the next defense is critical resistance:
$64,800–$65,000: the primary target for a rebound; recovering would likely require U.S. stocks to stabilize
$65,600–$66,000: the high area before the early U.S. session plunge
$66,500–$67,000: a strong medium-term resistance zone
Gate analysts noted that after BTC surged to and touched the upper Bollinger Band on the 15-minute timeframe, it came under pressure; it quickly pulled back to seek support at the lower band, with the low reaching $64,418. On the hourly timeframe, after a “false break” below $64,600 support, price consolidated briefly and rebounded quickly, and is now trading within the $65,700–$64,600 range. The market is in a critical window for directional selection.
Ethereum: whether it holds or loses the $1,900 level decides the short-term direction
ETH has broken below the $1,900 integer level.
Key supports:
$1,880–$1,900: the zone currently being tested
$1,850–$1,870: next defense if $1,880 is lost
$1,797: the MA144 area; a strong support zone
Key resistances:
$1,920–$1,940: primary rebound target
$1,960–$2,000: the psychological level and a medium-term resistance area
Analysts noted that ETH received temporary support near $1,928 at the lower Bollinger Band, but price is trading tightly along the lower band, and bearish momentum remains dominant. The key support below is around $1,878; if the lower band holds, ETH may form a short-term bottom. Traders should stay patient and wait for signs of stabilization.
V. Outlook: three major things decide the direction
Over the next 48 hours, three core variables will determine where the crypto market goes:
Variable 1: the July 28-29 FOMC meeting (most core). There’s not much suspense in the rate decision itself, but the wording in Waller’s press conference and the direction of the dot plot will determine the policy tone for the second half of the year. If hawkish signals are released, crypto may continue to face pressure; if a pivot toward a more dovish stance appears, it could trigger a retaliatory rebound.
Variable 2: whether panic in U.S. tech stocks can subside. Concerns about AI spending sparked by Alphabet and Tesla are still unfolding. If tech stocks continue falling, crypto, as a high-beta asset, is unlikely to escape.
Variable 3: CLARITY Act legislative progress. With only about 10 working days left before the Senate’s summer recess, if the bill makes a breakthrough, it will become a key catalyst for the medium-term行情.
VI. Trading advice: look more, move less before the rate decision
For short-term traders
The current market is in a wait-and-see period before the Fed’s rate decision; it is advised to stay highly alert and avoid heavy positioning until the direction becomes clear.
BTC strategy: Watch how the $64,000 support holds. If it holds and U.S. stocks stabilize, you can cautiously participate in a rebound with targets of $64,800–$65,000. If there is a clear breakdown below $63,700, be wary of further downside toward $63,000. Before the outcome of the rate decision is released, it is recommended to look more and trade less.
ETH strategy: Watch the $1,880–$1,900 support zone. The KDJ has entered oversold territory, and a technical short-term rebound is possible. If it holds, you can cautiously participate with targets of $1,920–$1,940; if it breaks below $1,850, cut losses decisively.
For medium- to long-term investors
Although the short term is under pressure, analysts noted that “Bitcoin’s structural outlook remains optimistic.” The logic behind the cooling of inflation expectations from the oil price plunge, potential inflows of ETF funds, and the long-term positive outlook from the CLARITY Act has not changed. The $63,000–$64,000 zone still offers value for staged allocations from a long-term perspective. It is recommended to wait until the FOMC outcome becomes clearer before reassessing opportunities to position.
Risk warnings:
Hawkish FOMC risk: If Waller releases a strong hawkish signal, the crypto market could face another round of selling pressure
Continued decline in U.S. tech stocks: If concerns about the AI bubble keep building, risk appetite may stay under pressure
CLARITY Act delay: If legislative progress cannot be pushed forward before the recess, it may further suppress market sentiment
Risk of a break of $64,000: If it breaks clearly, it could open the door to further downside toward $63,000 or even lower