Futures
Access hundreds of perpetual contracts
TradFi
Gold
One platform for global traditional assets
Options
Hot
Trade European-style vanilla options
Unified Account
Maximize your capital efficiency
Demo Trading
Introduction to Futures Trading
Learn the basics of futures trading
Futures Events
Join events to earn rewards
Demo Trading
Use virtual funds to practice risk-free trading
Launch
CandyDrop
Collect candies to earn airdrops
Launchpool
Quick staking, earn potential new tokens
HODLer Airdrop
Hold GT and get massive airdrops for free
Pre-IPOs
Unlock full access to global stock IPOs
Alpha Points
Trade on-chain assets and earn airdrops
Futures Points
Earn futures points and claim airdrop rewards
Promotions
AI
Gate AI
Your all-in-one conversational AI partner
Gate AI Bot
Use Gate AI directly in your social App
GateClaw
Gate Blue Lobster, ready to go
Gate for AI Agent
AI infrastructure, Gate MCP, Skills, and CLI
Gate Skills Hub
10K+ Skills
From office tasks to trading, the all-in-one skill hub makes AI even more useful.
GateRouter
Smartly choose from 40+ AI models, with 0% extra fees
[cryptoassets] Dollar-denominated Bitcoin breaks its all-time high, will it stabilize in the 15 million yen range for yen-denominated? | Learn about charts of Bitcoin and other [cryptoassets] (virtual coins) | Manekuri Monex Securities' investment information and media useful for money.
BTC (Bitcoin) is strong. While there are signs of deteriorating fundamentals in the stock and foreign exchange markets, leading to a risk-off reaction, the impact on BTC appears limited, and the pullbacks seem to be providing buying opportunities. The overseas BTC spot market is seeing buying almost daily. It seems that the thin trading in the derivatives market may be inducing minor short covering in places, which is pushing up BTC prices.
In addition, the long positions in the derivatives market are not overly skewed towards buying, and there is a fairly healthy position balance near the all-time high. This environment can be considered very favorable. Large sudden drops are unlikely, and there is a possibility that a gradually rising market trend will continue.
In MACD, divergence is occurring, but there are also expectations for further increases.
[Figure 1] BTC/JPY Daily Chart Source: MONEX TRADER CRYPTO (iPhone app)
This is an analysis of the BTC/JPY daily chart. The price has not yet touched the rising trend, and a strong upward movement continues. The trend line and SMA30 (yellow) are positioned at the same point, and depending on the pullback situation from tomorrow onward, there is a possibility that the 15 million yen line could become more solid.
Source: MONEX TRADER CRYPTO (iPhone app)
This is an analysis of the BTC/JPY daily chart. The price has not yet touched the rising trend, and a strong upward movement continues. The trend line and SMA30 (yellow) are positioned at the same point, and depending on the pullback situation from tomorrow onward, there is a possibility that the 15 million yen line could become more solid.
The point of caution is that the MACD is showing divergence. From an oscillator perspective, this signals a potential pullback, so I would like to focus on buying trades while maintaining a cautious stance. If there is an excessively strong rise, this divergence will be negated and the MACD will exceed the previous high, in which case further increases can be expected.
The 4-hour MACD has already fallen to around 0.00. Does it suggest that the adjustment is complete?
[Chart 2] BTC/JPY 4-hour candlestick chart Source: MONEX TRADER CRYPTO (iPhone app)
This is an analysis of the BTC/JPY 4-hour chart. Currently, it has rebounded around the support level of 15.2 million yen. Since the SMA90 (light blue) is also at this point, I believe it was technically an easy point for a rebound.
Source: MONEX TRADER CRYPTO (iPhone app)
This is an analysis of the BTC/JPY 4-hour chart. Currently, it has rebounded around the support level of 15.2 million yen. Since the SMA90 (light blue) is also at this point, I believe it was technically an easy point for a rebound.
Currently, the upside is being held down by SMA30, but if it breaks above this point, it is likely to gain momentum for the upside. Again, there is a high possibility that a trend will occur in the direction of 16 million yen. The 4-hours MACD has already fallen to the 0.00 area, indicating that a correction is complete. In contrast to the daily timeframe, the 4-hour chart suggests entering an uptrend again.
ETH (Ethereum) is approaching the upper target of the 200-day moving average.
[Figure 3] ETH/JPY Daily Chart Source: MONEX TRADER CRYPTO (iPhone app)
This is an analysis of the ETH/JPY daily chart. The SMA200 (orange) will be the immediate resistance. ETH/JPY may be capped at just over 400,000 yen, but there is still more than a 10% buffer, so there seems to be room for an increase. However, since it lacks the strength to rise like BTC, it may be better to prioritize a wait-and-see approach, although it also appears to be forming a triangular consolidation pattern that could lead to a delayed increase.
Source: MONEX TRADER CRYPTO (iPhone app)
This is an analysis of the ETH/JPY daily chart. The SMA200 (orange) will be the immediate resistance. ETH/JPY may be capped at just over 400,000 yen, but there is still more than a 10% buffer, so there seems to be room for an increase. However, since it lacks the strength to rise like BTC, it may be better to prioritize a wait-and-see approach, although it also appears to be forming a triangular consolidation pattern that could lead to a delayed increase.
The 4-hour chart of ETH/JPY is forming a triangular consolidation.
[Figure 4] ETH/JPY 4-hour candlestick chart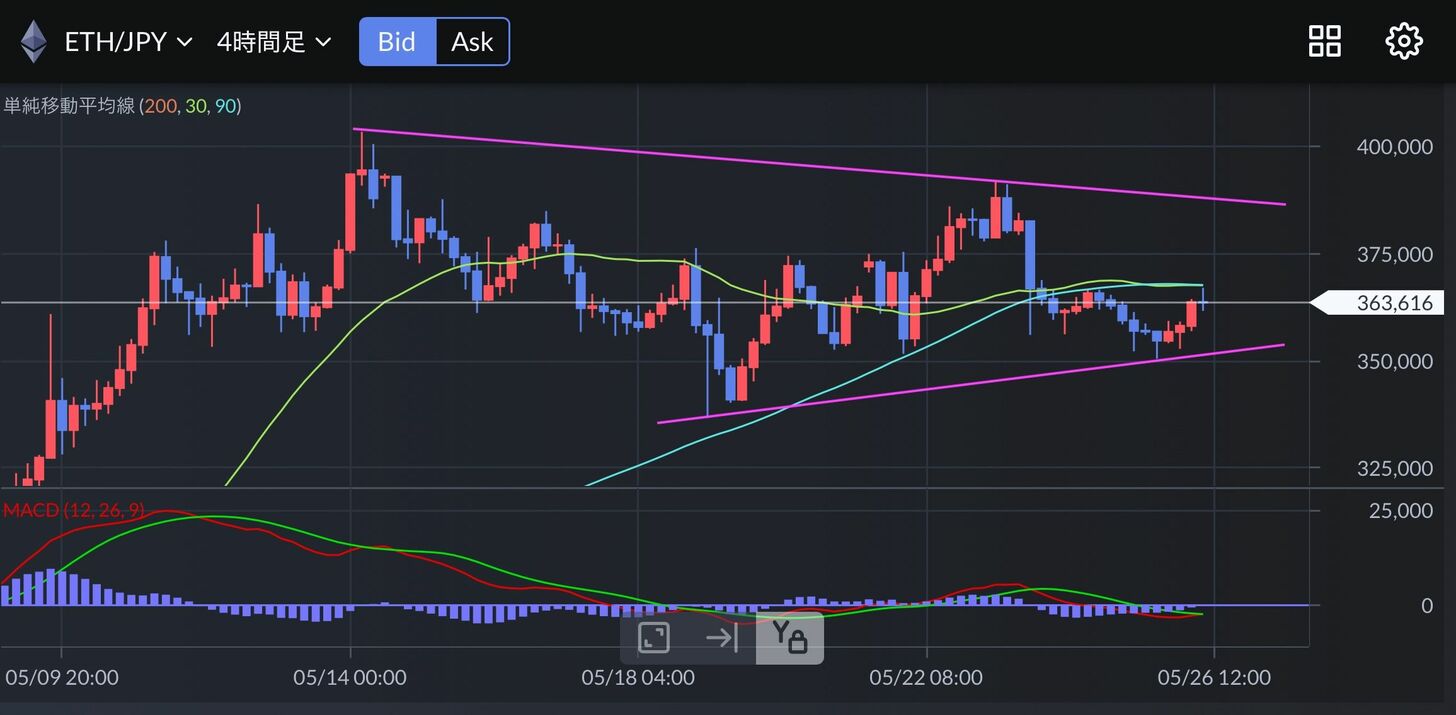 Source: MONEX TRADER CRYPTO (iPhone app)
This is the 4-hour chart for ETH/JPY. I have drawn the triangular consolidation line. Currently, it is being capped by the SMA30 (yellow) and SMA90 (light blue), and it seems that the key point will be whether it can firmly break above around 365,000 yen.
Source: MONEX TRADER CRYPTO (iPhone app)
This is the 4-hour chart for ETH/JPY. I have drawn the triangular consolidation line. Currently, it is being capped by the SMA30 (yellow) and SMA90 (light blue), and it seems that the key point will be whether it can firmly break above around 365,000 yen.
The MACD has already completed its adjustment, but it is also true that there is a lack of direction. It is forming a triangular consolidation, and I imagine it may break above the highs around a week from now. For the time being, I want to consider a strategy of targeting a profit-taking level of around 380,000 JPY for ETH/JPY, picking up dips again and aiming for a breakout.
As for my overall policy regarding cryptocurrency assets, it is basically centered around BTC, with ETH positioned as a sub-trade.