For traders trying to separate a genuine intraday trend from ordinary price fluctuations, the EMA 20 can make the chart easier to read. Its slope, the location of price around the line, and reactions near it can help identify trend conditions and potential entries. The catch is that EMA 20 is a trend filter, not a standalone buy or sell signal.
Key Takeaways
-
EMA 20 is a 20-period exponential moving average that gives recent price data more influence than older observations.
-
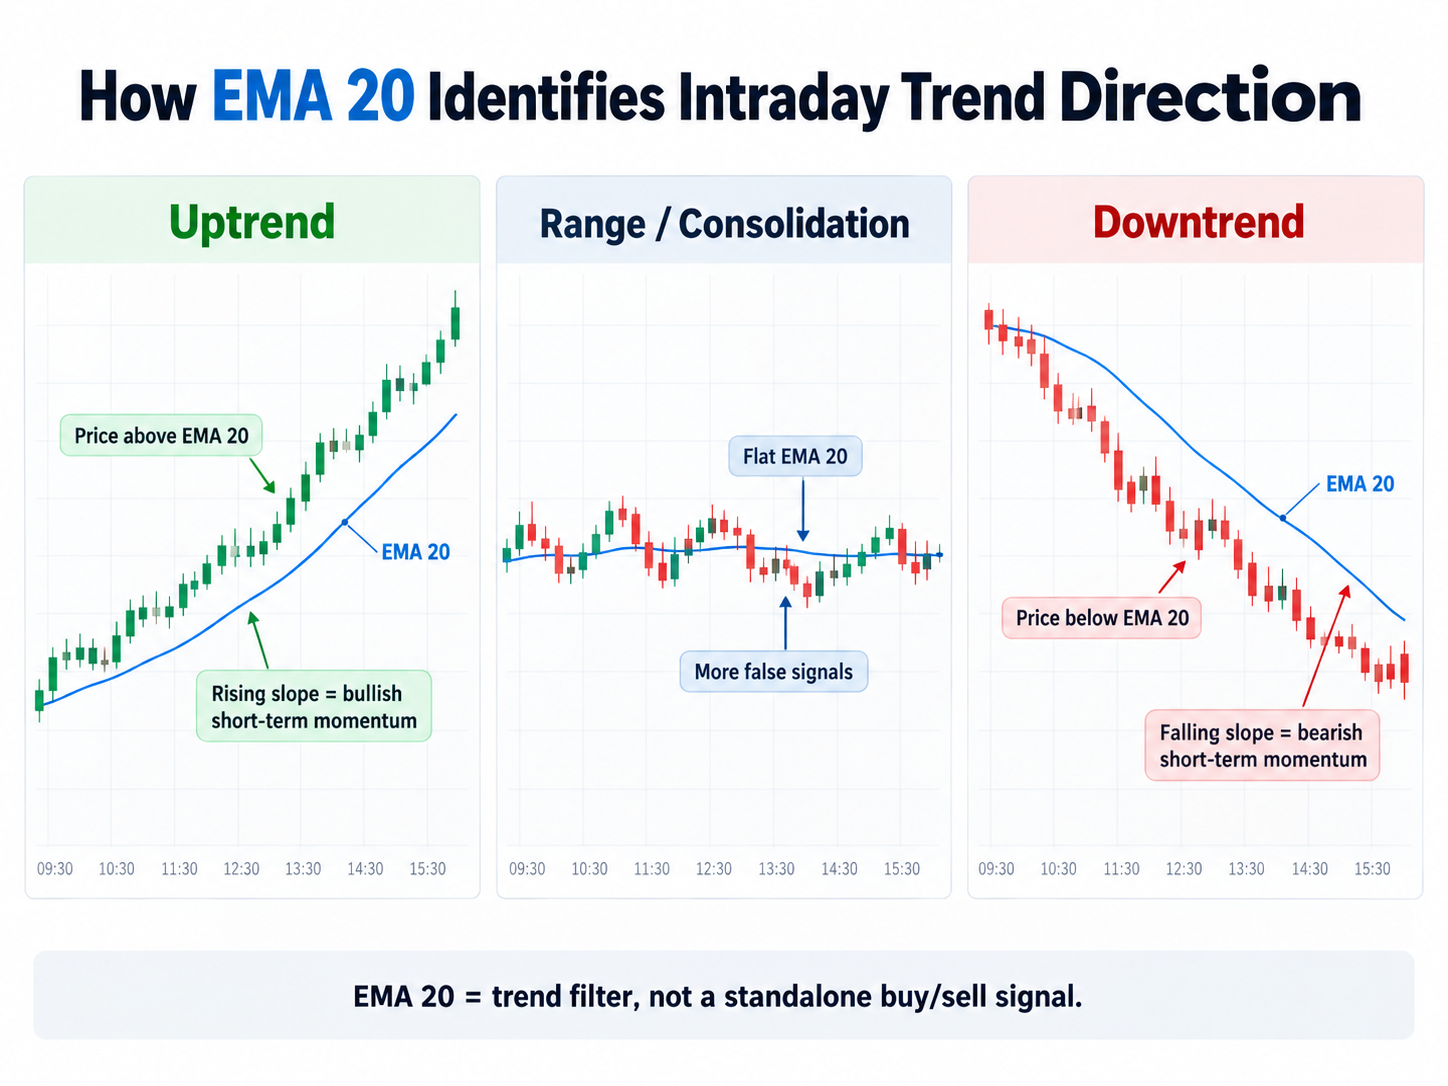
A rising EMA 20 with price trading above it generally indicates a short-term uptrend; a falling line with price below it suggests a short-term downtrend.
-
EMA 20 reacts faster to recent price changes than SMA 20 and EMA 50.
-
In established trends, the EMA can behave as dynamic support or resistance, although price may cross it without reversing.
-
A flat EMA 20 often appears during consolidation, where repeated crosses can produce false signals.
What Is the EMA 20 Indicator?
EMA 20 is a technical analysis tool that calculates an exponentially weighted average price over 20 periods. Unlike a simple moving average, which gives the selected data points equal weight, an exponential moving average places more weight on recent data and progressively less weight on older historical price data.
That weighting makes the EMA more responsive to new price movement. Fidelity describes the EMA as a moving average in which the newest price data has the greatest effect, while increasingly old prices have progressively less influence.
“20” refers to the selected period, not automatically to 20 days. On a five-minute chart, EMA 20 tracks 20 five-minute candles. On an hourly chart, it uses 20 hourly periods. A 20-day EMA on a daily chart reflects roughly 20 trading sessions.
Moving averages are widely used to smooth short-term price fluctuations and make the direction of a trend easier to see. The U.S. SEC’s Investor.gov also defines a moving average as an average that changes as new observations are added and earlier observations move out of the calculation window.
How Is EMA 20 Calculated?
EMA calculation uses a smoothing multiplier:
Multiplier = 2 ÷ (Number of periods + 1)
For a 20-period EMA:
2 ÷ (20 + 1) = 0.0952
The current EMA can then be expressed as:
EMA = Previous EMA + [Multiplier × (Current Closing Price − Previous EMA)]
The multiplier of approximately 9.52% gives each new closing price more influence than it would receive in a 20-period simple moving average. The previous EMA carries forward information from earlier periods, so historical data still affects the line, but its influence declines over time. Fidelity uses the equivalent calculation EMA = K × (current price − previous EMA) + previous EMA.
That difference in weighting explains why the EMA reacts more quickly than the SMA when price changes sharply. The distinction is especially useful when comparing SMA vs. EMA for trend analysis: SMA assigns equal weight across its selected period, while EMA prioritizes more recent price movements.
How EMA 20 Identifies Intraday Trend Direction
EMA 20 becomes more useful when traders consider three things together: slope, price position, and price structure.
| EMA 20 condition |
Common interpretation |
| EMA rising, price above |
Short-term bullish trend |
| EMA falling, price below |
Short-term bearish trend |
| EMA nearly flat |
Range or consolidation |
| Price repeatedly crosses EMA |
Weak directional structure or market noise |
| Pullback holds near rising EMA |
Possible dynamic support |
| Rally stalls near falling EMA |
Possible dynamic resistance |
A rising EMA slope means recent data points are pulling the moving average upward. If price also remains above the line and continues forming higher highs and higher lows, the current trend has stronger bullish confirmation.
A falling EMA slope works in reverse. Recent price changes are pulling the average lower, and price staying below that falling line supports a bearish short-term bias.
Slope matters. Price can momentarily cross above a falling EMA without establishing a new trend. Likewise, a brief move below a rising EMA may simply be a pullback rather than a bearish reversal.
A flat EMA deserves particular caution. When the market trades sideways, price may cross the average repeatedly because neither buyers nor sellers have established sustained direction. FINRA notes more broadly that attempts to exploit anticipated short-term price movements carry the risk that temporary volatility is mistaken for a lasting market move.
EMA 20 as Dynamic Support and Resistance
In a strong uptrend, price may pull back toward a rising EMA 20, attract demand and continue higher. Traders often describe the line in this situation as dynamic support because the potential support level changes with every new candle instead of remaining at one fixed price.
During a downtrend, a falling EMA 20 can act as dynamic resistance. Price may rebound toward the average before sellers regain control.
This behavior isn't guaranteed. An EMA is calculated from historical price data; it doesn't create support or resistance by itself. Traders typically look for confirmation from price action, swing highs and lows, volume, or another technical indicator before making a trading decision.
For example, Pivot Points provide predefined horizontal support and resistance levels, while EMA 20 continuously changes with recent price. Using both can distinguish a moving trend reference from a fixed intraday level.
EMA 20 vs. EMA 9, EMA 50 and SMA 20
Different moving averages answer different questions.
EMA 9 is a shorter-term moving average and reacts more quickly to recent price changes. The 9/20 EMA combination is therefore popular in short-term trading: EMA 9 can represent faster momentum while EMA 20 provides a slower trend reference. A crossover, however, is still based on historical price and can generate false signals.
EMA 20 sits between very fast and slower moving averages. It responds quickly enough for intraday trend identification without tracking every small price fluctuation as closely as a shorter-period EMA.
EMA 50 is slower because each new data point has less influence on the calculation. The practical tradeoff becomes clear when comparing EMA 20 vs. EMA 50: EMA 20 responds earlier, while EMA 50 filters more short-term market noise.
SMA 20 uses the same 20-period window but gives each observation equal weight. EMA 20 therefore responds faster when the most recent price changes sharply. Faster isn't automatically better; greater responsiveness can also create more false signals during volatile or sideways markets.
How Day Traders Use EMA 20
A trader might begin by checking whether EMA 20 has a clear slope. Next comes price position: is price consistently above or below the line, or crossing it every few candles?
Suppose BTC is producing higher intraday highs and lows while EMA 20 is rising. Price then pulls back toward the EMA without breaking the previous swing low. If buyers regain control around the moving average, the trader has several pieces of evidence pointing in the same direction rather than relying on an EMA touch alone.
For a live chart, a trader using BTC/USDT market data on Gate.com can apply EMA 20 to different time frames and compare the line with current price action. Gate’s public market interfaces also expose BTC/USDT trades and candlestick data, allowing recent market data to be examined rather than relying on a static example.
EMA 20 can also be paired with VWAP for intraday price analysis. VWAP weights prices by trading volume and normally acts as a session-based benchmark, whereas EMA 20 continuously weights recent prices without incorporating volume. If price is above both a rising EMA 20 and the session VWAP, the indicators are describing different aspects of the same bullish environment rather than duplicating exactly the same calculation.
Limitations of EMA 20
EMA 20 is a lagging indicator. It can respond quickly, but only after price has changed. Fidelity notes that moving averages aren't designed to identify exact market tops or bottoms, and even EMA signals involve some delay.
Sideways markets create another problem. A flat EMA can be crossed repeatedly, producing apparent direction changes that never develop into a sustained trend. Sudden volatility can also pull the EMA sharply toward price before the broader market structure changes.
Adding more indicators doesn't automatically solve this. Several indicators may use the same underlying price data and therefore provide correlated rather than independent confirmation. For instance, SuperTrend and EMA approach trend direction differently because SuperTrend includes ATR-based volatility while EMA is based on weighted price data.
Conclusion
EMA 20 identifies intraday trend direction by giving recent price data more influence and converting those changes into a smooth, continuously updating line. Price above a rising EMA supports a bullish short-term interpretation; price below a falling EMA supports a bearish one. A flat line generally signals that directional conviction is weaker.
Its strongest use is as a trend filter and dynamic reference, not an automatic trade signal. Slope, price structure, support and resistance, volume, volatility and the chosen time frame all affect how an EMA 20 signal should be interpreted.
FAQ
What does EMA 20 tell traders?
EMA 20 shows the exponentially weighted average of price over the latest 20 periods. Traders mainly use its slope and the position of price relative to the line to judge short-term trend direction and momentum.
Is EMA 20 good for day trading?
EMA 20 is commonly suited to intraday trend analysis because it reacts relatively quickly to new data while smoothing some short-term price fluctuations. Its usefulness depends on the market, time frame and trading strategy, and it shouldn't be treated as a standalone entry signal.
What happens when price is above EMA 20?
Price above a rising EMA 20 generally supports an upward short-term trend. Price merely crossing above a flat or falling EMA is weaker evidence because the broader direction hasn't necessarily changed.
Is EMA 20 better than EMA 50?
They measure different horizons. EMA 20 reacts faster and is useful for shorter-term price movements, while EMA 50 is slower and filters more noise. Traders can also use two moving averages together to compare short-term momentum with a broader trend.
Does EMA 20 act as support and resistance?
It can behave as dynamic support during an uptrend and dynamic resistance during a downtrend. These areas aren't fixed or guaranteed, so traders commonly check price action and other evidence before treating an EMA reaction as significant.
Does EMA 20 predict future prices?
No. EMA 20 is calculated from historical and recent price data, so it describes the existing trend rather than predicting future price movement. Technical indicators and historical patterns do not guarantee future trading results.
Disclaimer: This content is for educational purposes only and does not constitute financial or investment advice. Technical indicators can produce false signals, particularly during volatile, low-liquidity or ranging markets. Digital-asset prices can change rapidly, and historical price behavior does not guarantee future results.