That distinction matters when seconds or minutes can change a setup. A breakout trader may care most about price reaching the session high, while a pullback trader may wait for price to return to the VWAP line. Knowing what each reference actually measures helps scalpers avoid using the same signal for two different jobs.
Key Takeaways
-
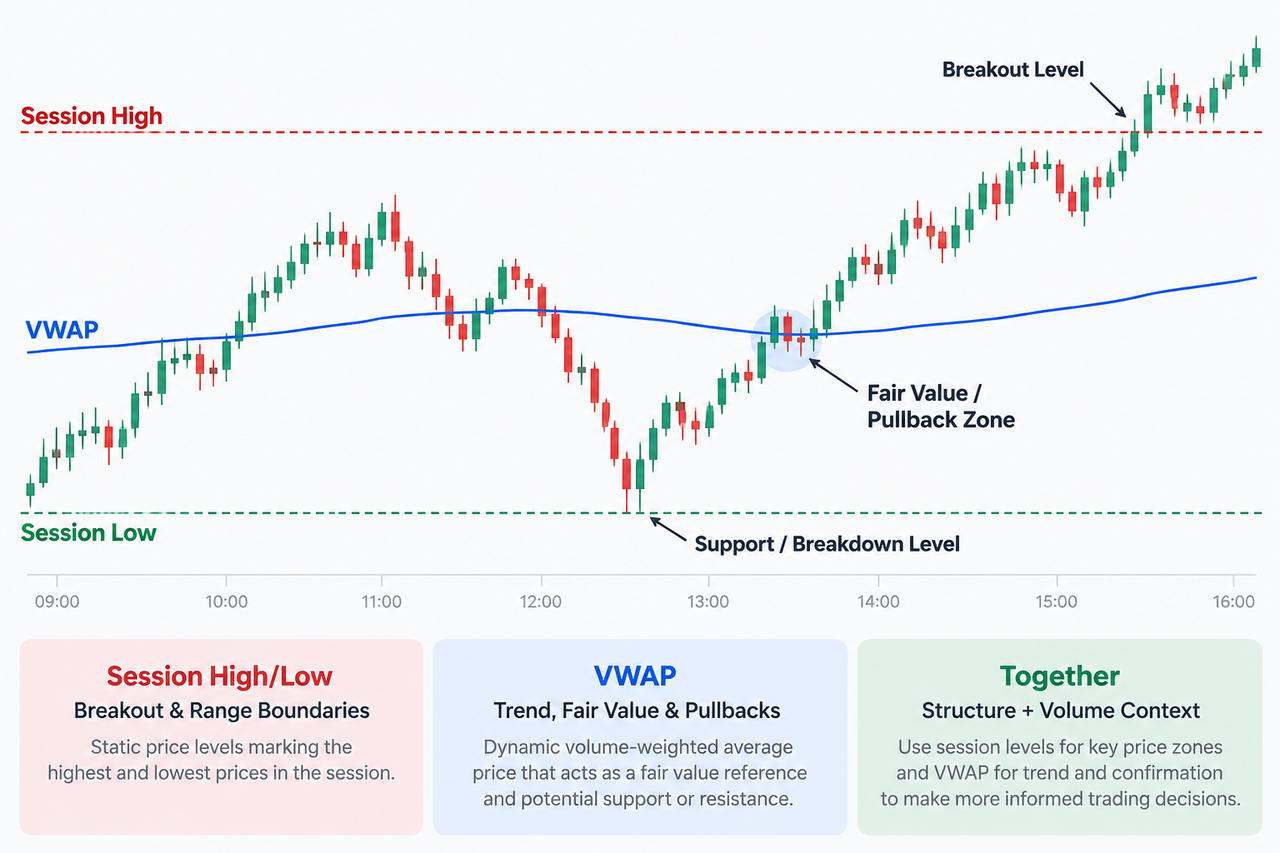
Session High/Low marks static price boundaries, showing the highest and lowest prices traded during a defined trading session.
-
VWAP is a dynamic volume-weighted average price that changes as price and trading volume accumulate through the session.
-
Session highs and lows are generally stronger for locating breakout levels; VWAP is more useful for fair-value analysis, trend confirmation, and pullbacks.
-
Price holding above VWAP can support a bullish intraday interpretation, while price remaining below VWAP can indicate bearish pressure.
-
Combining Session High/Low with VWAP can give scalpers both market structure and volume confirmation, but neither signal guarantees future results.
Session High/Low vs. VWAP: The Core Difference
The simplest difference is price boundary versus average price.
A Session High/Low records the highest and lowest prices reached within a chosen session. Once established, those levels become visible support and resistance references. A break above the session high can signal aggressive buying momentum, while a break below the session low can reflect stronger selling pressure.
VWAP works differently. The VWAP indicator calculates an average price while giving more weight to prices where greater volume traded. This makes VWAP responsive to both price action and participation.
| Feature |
Session High/Low |
VWAP |
| Main input |
Price |
Price + volume |
| Level type |
Static session boundary |
Dynamic average |
| Main scalping use |
Breakouts and rejection |
Trend, fair value, pullbacks |
| Resets |
New defined session |
Typically each trading session |
| Support/resistance |
Horizontal reference |
Dynamic support/resistance |
| Volume confirmation |
No |
Built into calculation |
| Common weakness |
False breakouts |
Lag in fast or choppy markets |
Session levels also differ from Daily High/Low. A daily high or low covers the full trading day, while a session high or low may isolate a particular market window.
How VWAP Calculates the Average Price and Fair Value
VWAP stands for Volume Weighted Average Price. Its basic formula is:
VWAP = Σ(Price × Volume) / Σ(Volume)
Charts commonly use a typical price derived from the high, low, and close for each interval before multiplying that figure by volume. The cumulative price-volume value is then divided by cumulative volume.
That volume weighting is important. A simple moving average only uses historical prices, while VWAP incorporates trading volume as well. As a result, two price moves of the same size don't necessarily influence VWAP equally.
The U.S. SEC's Investor.gov includes Volume-Weighted Average Price (VWAP) in its investor glossary, while CME Group uses VWAP-based calculations for multiple market fixing prices, showing how volume-weighted pricing is also used in professional market infrastructure.
Unlike a conventional moving average, session VWAP normally resets at the start of each trading session. An anchored VWAP changes that starting point, allowing traders to calculate the weighted average from a chosen event, swing high, swing low, or other reference.
Is VWAP Better for Intraday Trading and Identifying Market Trends?
VWAP is primarily an intraday trading tool because its session reset makes the current day's trading activity central to the calculation.
If price remains above the VWAP line, traders often interpret the session as having a bullish bias. If price remains below it, the interpretation is generally bearish. Price repeatedly crossing VWAP with little follow-through can instead indicate a choppy market.
This makes VWAP useful as a trend confirmation tool, but it is still a lagging indicator because it is calculated from transactions that have already occurred.
For example, imagine BTC pushes above VWAP shortly after the market becomes active, pulls back, and then price bounces from VWAP on increasing volume. A scalper may view that VWAP bounce differently from a simple touch because price action and volume confirmation point in the same direction.
A trader testing that setup on a live pair such as the BTC/USDT market on Gate.com can compare the VWAP line with current price, volume data, and nearby session levels rather than evaluating the indicator in isolation.
Why Session High/Low Matters for Scalping and Forex Trading
Session High/Low tells a scalper where price has already failed to move farther during a trading session.
That makes these levels particularly useful around breakouts. If price rallies toward the session high several times before finally breaking through with increasing volume, buyers may be becoming more aggressive. A break of the session low can show the opposite market dynamic.
Previous session highs and lows can remain important too. Market participants often watch them as potential support and resistance levels because previous extremes are obvious price references where stop-losses, breakout orders, or resting liquidity may cluster.
The concept is also common in forex trading, where market participants distinguish Asian, London, and New York trading sessions. Crypto trades around the clock, so the exact session definition depends on the trader's chart settings and strategy.
Neither tool needs to be used alone.
A practical Session High/Low vs. VWAP setup uses the session boundary to define where something important is happening and VWAP to assess the broader intraday condition.
Suppose price remains above VWAP and gradually approaches the session high. A breakout above that level carries different information from a breakout occurring while price is repeatedly falling below VWAP. The first setup has trend alignment; the second has conflicting signals.
The reverse applies near a session low. Price breaking the low while remaining below VWAP can support a bearish trend interpretation. If price breaks the low briefly and then quickly recovers above both the level and VWAP, the apparent breakout may have failed.
This complementary approach is similar to using SuperTrend with VWAP: one reference helps establish direction while another adds context about price location.
Does VWAP Work as Dynamic Support and Resistance?
VWAP can behave as dynamic support or resistance, particularly when market participants are already respecting the prevailing intraday trend.
During an upward move, price pulls toward VWAP may attract buyers. In a downward move, rallies into the VWAP line may meet selling pressure. A VWAP pullback strategy generally waits for price to reach VWAP and then looks for a reaction rather than entering simply because the line was touched.
Some traders plot VWAP bands above and below the central line. These price zones can help identify stretched moves or potential mean-reversion areas, somewhat like volatility envelopes. The logic differs from Bollinger Bands, however: Bollinger Bands are derived from price history and standard deviation, while VWAP is anchored to volume-weighted session activity.
Traders comparing dynamic intraday tools may also use VWAP versus EMA, since an EMA emphasizes recent price observations but doesn't weight them by traded volume.
Incorporating VWAP as an Execution Benchmark
VWAP isn't used only for chart signals. Institutional investors, hedge funds, and other professional traders can use VWAP as an execution benchmark when evaluating whether large orders were filled efficiently.
Conceptually, a buyer obtaining an average fill below the relevant VWAP has executed below the volume-weighted benchmark for that measurement period. A seller generally looks at the benchmark from the opposite direction.
CME Group explicitly uses VWAP in market-price calculations and recognizes VWAP as a predefined hedging methodology for certain transactions. Nasdaq methodology likewise demonstrates the underlying calculation principle: traded prices are multiplied by their corresponding volume before the total is divided by overall traded volume.
That institutional use doesn't mean VWAP reveals exactly what institutional traders paid or guarantees institutional fair value. It means volume-weighted pricing can serve as a practical reference for execution quality and market impact.
Risks and Limitations
Session High/Low can generate false breakout signals. Price may briefly trade beyond a session boundary, trigger breakout orders or stops, and then return inside the previous range.
VWAP has a different problem: lag. Because each new value incorporates cumulative session data, the line can respond slowly when price moves sharply. In choppy markets, repeated VWAP crosses may create several apparent signals without a sustained trend.
Volume quality also matters. In centralized crypto markets, VWAP calculated on one venue reflects that venue's transactions rather than all global crypto trading volume. Forex platforms may rely on tick volume rather than consolidated exchange volume.
Scalpers also face spread, slippage, fees, liquidity, and execution risk. Technical indicators describe historical and current market behavior; they don't guarantee future results.
Conclusion
For scalping, Session High/Low is usually the clearer tool for breakout location, while VWAP gives stronger context about intraday average price, fair value, and trend direction.
They become more informative when combined. A session high or low shows where the market is testing an established boundary; VWAP helps show whether the surrounding price action has broader volume-weighted trend support.
A scalper can therefore use Session High/Low to define the price level, then use VWAP, volume, and actual price reaction to judge the setup. Neither should replace risk controls or execution discipline.
FAQ
Is VWAP a leading or lagging indicator?
VWAP is a lagging indicator because its current value is calculated from price and volume that have already traded. It can still be useful for real-time intraday decisions because the VWAP line updates as new transactions occur.
Does VWAP reset every trading day?
Standard session VWAP normally resets when a new trading session begins. Anchored VWAP is different because the trader selects a specific starting point from which the calculation continues.
Which is better for breakout scalping: Session High/Low or VWAP?
Session High/Low is generally more direct for identifying breakout levels because it marks actual price extremes. VWAP can then help determine whether the breakout agrees with the broader intraday trend.
What happens when price reaches VWAP?
Price reaching VWAP doesn't automatically create a buy or sell signal. Traders commonly watch whether price bounces, breaks through, closes across the line, or repeatedly oscillates around it before interpreting the reaction.
Can Session High/Low and VWAP be used together?
Yes. Many trading setups use the session high or low as a static support or resistance reference and VWAP as a dynamic trend and fair-value reference. Volume, liquidity, and price reaction can provide additional confirmation.
Is VWAP better than a moving average for scalping?
VWAP can be more informative for intraday trading when volume-weighted activity matters because it incorporates both price and volume and normally resets each session. Moving averages can remain useful when traders want a continuously calculated trend measure across multiple sessions, such as the EMA 9, EMA 20, and EMA 50.
Disclaimer: This content is for educational purposes only and does not constitute financial advice. Trading cryptocurrencies involves market, liquidity, and execution risks. Technical indicators and historical price behavior do not guarantee future results.







