For crypto futures traders, comparing these changes with trading volume and funding rates helps distinguish sustainable trends from liquidation-driven moves. Neither signal guarantees a reversal.
Key Takeaways
-
Open interest divergence reveals when price trends and outstanding futures positions move in opposite directions.
-
Rising prices alongside declining open interest may reflect short covering rather than fresh bullish conviction.
-
Falling prices with rising open interest can suggest new bearish positions, especially when funding rates are negative.
-
Trading volume, funding rates, and support or resistance levels help validate divergence signals.
-
Open interest alone cannot predict market movements or identify whether buyers or sellers control the market.
What Is Open Interest Divergence in Crypto Trading?
Open interest divergence describes a mismatch between price action and changes in outstanding futures contracts.
Open interest measures the number of contracts that remain active, including futures and options positions that haven't been closed or settled. Each contract has both a long and short side, but it's counted only once.
Price reveals where the market trades. Open interest reveals whether the number of outstanding contracts is growing or shrinking.
This distinction matters because a price increase can occur without more positions entering the market. Short sellers closing existing contracts may help push prices higher even as overall market participation declines.
The CFTC's definition of open interest confirms that total outstanding long and short contract counts are equal. Open interest therefore measures positioning, not net bullish sentiment.
How Is Open Interest Calculated?
Open interest changes according to whether traders open new positions or close existing ones.
Open Interest Change = Newly Opened Contracts − Closed Contracts
When two counterparties establish new positions, open interest increases by one contract. When both close existing positions against each other, it decreases by one. If an existing position transfers to another trader, open interest stays unchanged.
For example, if 10,000 contracts remain outstanding and 1,500 net new contracts are created, open interest rises to 11,500.
Unlike open interest, trading volume measures contracts traded during a specified period, including transactions involving existing positions.
The CME Group's open interest methodology explains how these measures reflect different aspects of market activity.
Traditional futures exchanges commonly publish official open interest data after the trading day. Crypto derivatives platforms may update figures much more frequently.
Open Interest vs. Price Divergence: How to Read the Signal
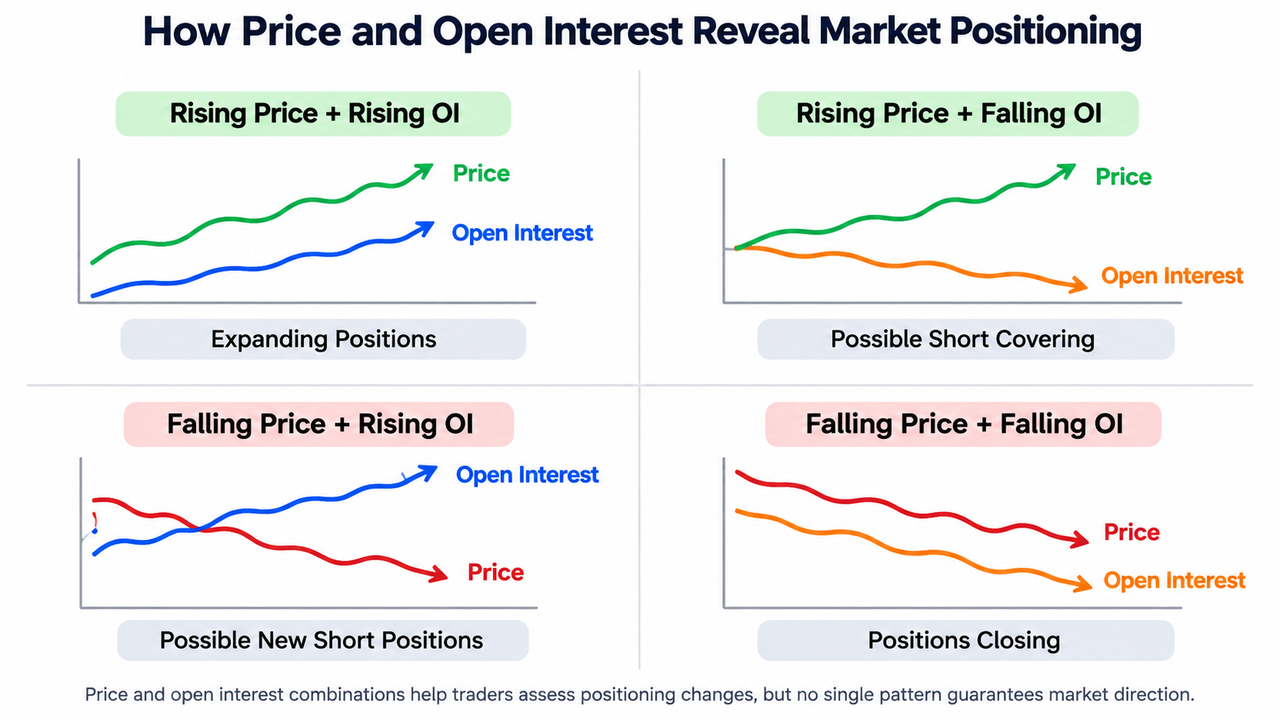
Four combinations help traders interpret market trends, although none identifies position direction with certainty.
| Price movement |
Open interest movement |
Possible interpretation |
| Rising price |
Rising OI |
New positioning supports the rally |
| Rising price |
Falling OI |
Short covering or position reduction |
| Falling price |
Rising OI |
Fresh bearish positioning may be building |
| Falling price |
Falling OI |
Long liquidation or broader position closures |
Rising Price With Rising Open Interest
When open interest rises alongside price, additional contracts support an advancing market.
This can indicate strong bullish conviction, particularly when trading volume increases and prices break above established resistance levels.
But rising OI doesn't prove that new money is exclusively entering long positions. Every newly created futures contract includes a short counterparty.
Rising Price With Falling Open Interest
A rally accompanied by decreasing open interest suggests fewer outstanding contracts despite higher prices.
Short covering is one possible explanation. Traders exit bearish positions by buying contracts, contributing to upward pressure without necessarily establishing fresh long exposure.
Such divergence signals can identify weak bullish trends, although a rally may continue after excessive leverage disappears.
Falling Price With Rising Open Interest
Falling prices alongside rising OI can indicate aggressive short-selling and growing bearish exposure.
Negative funding rates strengthen that interpretation when accompanied by sustained selling pressure.
Still, new long positions may also be accumulating against those shorts. The direction of fresh positioning cannot be determined from OI alone.
Falling Price With Falling Open Interest
Declining prices and shrinking OI often suggest traders are reducing exposure.
Long liquidations may accelerate the decline, especially during high-leverage market movements.
A sharp drop in open interest can eventually reduce forced-selling pressure. That doesn't establish a market bottom.
How Funding Rates Confirm Open Interest Divergence Signals
Funding rates add context by showing the cost of maintaining positions in perpetual futures markets.
Positive funding generally means long positions pay short positions. Negative funding reverses that payment direction.
The Bank for International Settlements' research on crypto perpetual futures describes how funding payments reflect conditions in leveraged derivatives markets.
Consider two situations:
-
Price falls, OI rises, and funding turns negative: Bearish positioning may be increasing, supporting a possible downward continuation.
-
Price rises, OI falls, and funding remains negative: Short covering may be contributing to the rally, potentially exposing additional shorts to liquidation.
Extreme funding can also indicate crowded positioning and squeeze risk. Funding rates aren't a direct measurement of how many traders hold long or short positions.
For example, traders examining BTC/USDT perpetual futures on Gate.com can compare open interest, funding rates, and price movements within the same derivatives market.
Historical Examples of Open Interest Divergence and Market Movements
The following hypothetical examples illustrate common patterns rather than verified historical events.
Weak Rally Example
Bitcoin rises from $80,000 to $84,000 while open interest declines from 100,000 to 85,000 contracts.
Price gains 5%, but outstanding contracts fall 15%.
This divergence suggests position reductions accompany the rally. A reversal remains possible, although continued spot buying could sustain higher prices.
Capitulation Example
Suppose an asset falls 20% while open interest crashes 50% during a liquidation event.
Such a mismatch may indicate widespread leveraged-position closures, sometimes described as capitulation divergence.
If trading volume spikes and funding rates normalize, forced selling might be easing. However, neither percentage is a universal capitulation threshold, and further declines remain possible.
How to Use Open Interest Data in Trading Strategies
A practical open interest divergence setup combines positioning, price structure, and confirmation.
-
Identify price trends. Determine whether price makes higher highs, lower lows, or consolidates around established levels.
-
Compare open interest changes. Check whether OI confirms the direction or moves against it.
-
Examine trading volume. Higher volume may strengthen the significance of a breakout or breakdown, without proving its sustainability.
-
Check funding rates. Look for signs of crowded bullish or bearish positioning.
-
Wait for price confirmation. A failed breakout, resistance rejection, or support breakdown offers more context than divergence alone.
A multiple-timeframe trading approach can reveal whether an apparent intraday divergence conflicts with the broader market trend.
Meanwhile, price and volume analysis helps distinguish genuine participation from temporary price spikes.
For potential reversals, support and resistance validation provides useful reference levels for evaluating whether divergence develops into a confirmed change in direction.
Limitations of Open Interest Divergence
Open interest reveals outstanding positioning, but several factors complicate interpretation.
Exchange differences: Data from major exchanges may cover different contracts, trading activity, and reporting intervals. A single exchange doesn't represent the entire market.
Notional distortion: Total notional open interest can rise because prices increase, even when the underlying number of contracts stays unchanged.
Liquidity uncertainty: High open interest suggests substantial market participation but doesn't guarantee greater liquidity or tight spreads.
False signals: Flat open interest during consolidation may precede major market moves, but cannot reliably predict their direction.
Sudden OI spikes followed by sharp declines may indicate liquidation cascades. Funding, volume, and price confirmation remain essential.
The difference between open interest and trading volume becomes particularly important during volatile sessions because heavy trading can occur even while outstanding positions shrink.
Conclusion
Open interest divergence helps traders judge whether price movements are accompanied by expanding or contracting derivatives exposure.
Rising prices with falling OI may signal short covering. Falling prices with rising OI may suggest bearish positioning. But market sentiment, funding rates, and price structure determine how useful these interpretations become.
Use divergence to investigate a move, not predict its outcome.
Frequently Asked Questions
What does open interest divergence indicate?
Open interest divergence indicates that price movements and outstanding derivatives positions aren't moving together. It may suggest weakening trend participation, short covering, fresh bearish positioning, or liquidation activity, depending on market conditions.
Does rising open interest mean bullish sentiment?
No. Rising open interest means more contracts remain outstanding. Both long and short positions are involved, so price direction, funding rates, and trading volume are needed to assess market sentiment.
Can open interest divergence predict market reversals?
Open interest divergence can highlight conditions associated with potential reversals, but it cannot predict them reliably. Strong market trends can continue despite declining open interest.
What happens when price falls but open interest increases?
Falling prices with increasing open interest may indicate new short positions entering the market. Negative funding rates and sustained selling volume can support a bearish interpretation, although buyers may also be accumulating contracts.
How often should crypto traders check open interest?
Intraday traders may monitor changes across short intervals, while swing traders may focus on four-hour and daily trends. The useful frequency depends on market liquidity, contract data, and trading strategy.
Is high open interest good for crypto trading?
High open interest indicates substantial outstanding derivatives exposure. It may accompany active markets, but excessive leverage can increase liquidation risk and volatility. High OI alone doesn't guarantee liquidity or favorable trading conditions.
Disclaimer: Futures and leveraged crypto trading involve substantial risks, including liquidation and potential loss of capital. Technical indicators and historical patterns do not guarantee future performance.