The Commodity Channel Index (CCI) is a technical momentum oscillator that measures how far an asset's price deviates from its historical average. For beginner and intermediate crypto traders, understanding CCI calculations, momentum comparisons, divergences, overbought and oversold conditions, and multi-timeframe confirmation provides a practical foundation for developing informed trading strategies.
Key Takeaways
-
The Commodity Channel Index measures price deviation from its historical average.
-
Comparing consecutive CCI peaks and troughs reveals changes in relative momentum.
-
Readings above +100 indicate bullish strength, while readings below −100 suggest bearish pressure.
-
Divergences between price and CCI can warn of weakening trends.
-
Higher timeframes and additional technical indicators help filter short-term market noise.
How the Commodity Channel Index Measures Market Momentum
The Commodity Channel Index (CCI) is a technical analysis indicator introduced by Donald Lambert in 1980. Originally designed for commodities, it is now applied across stocks, forex, indices, and cryptocurrencies.
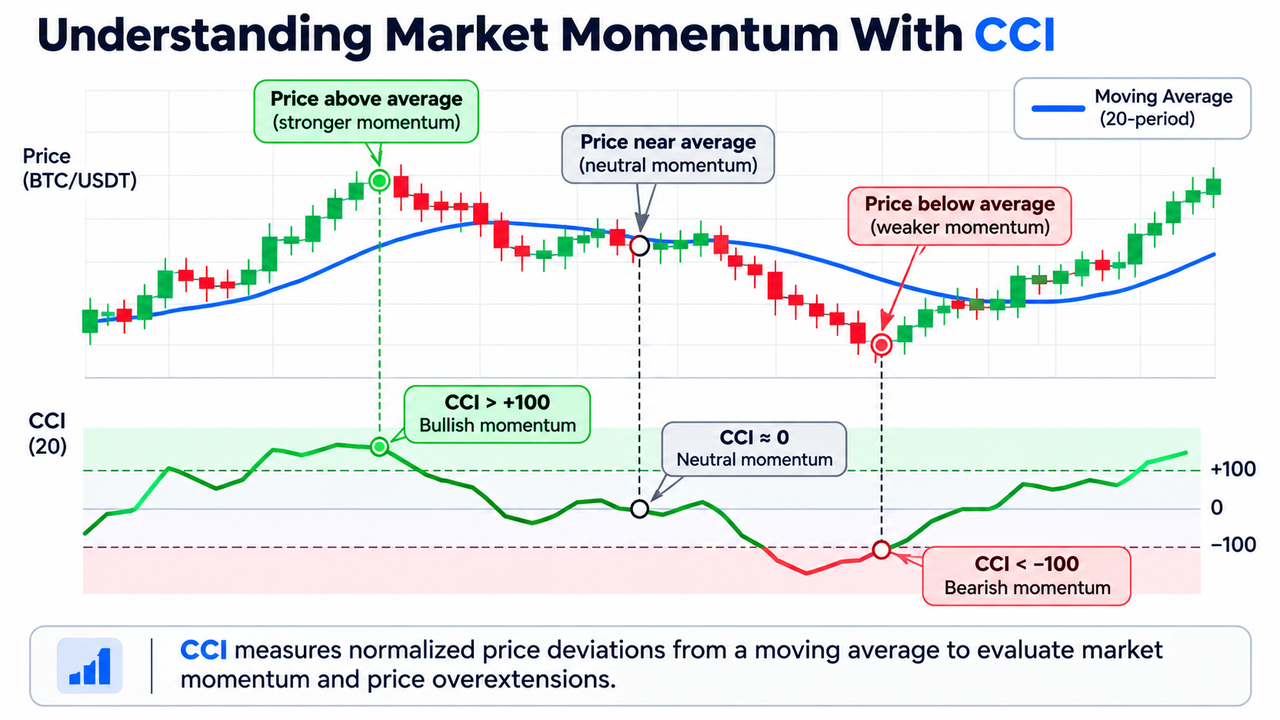
Momentum generally measures the rate of price changes over a selected time period. CCI takes a different approach by measuring how far current prices deviate from their recent average, adjusted for typical price dispersion.
A rising CCI suggests increasing relative buying strength. A falling reading suggests growing selling pressure.
Unlike bounded oscillators, CCI has no fixed upper or lower limit. This makes it useful for identifying market overextensions during strong cryptocurrency trends.
CCI Formula and Moving Average Calculation
According to the TradingView CCI technical documentation, the standard calculation uses typical price, a simple moving average, and mean deviation.
Typical Price = (High + Low + Close) / 3
CCI = (Typical Price − SMA of Typical Price) / (0.015 × Mean Deviation)
The conventional setting is 20 periods.
Mean deviation measures the average absolute distance between each typical price and the selected period's average.
This adjustment helps traders evaluate whether price movements are unusually large relative to recent market conditions.
How to Compare CCI Momentum Across Market Trends
The most useful CCI momentum comparison involves examining consecutive price swings rather than individual readings.
Compare swing highs during uptrends and swing lows during downtrends. The relationship between price structure and corresponding CCI readings can reveal whether momentum supports the prevailing trend.
| Price Structure |
CCI Structure |
Momentum Interpretation |
| Higher highs |
Higher highs |
Strengthening bullish momentum |
| Higher highs |
Lower highs |
Weakening bullish momentum |
| Lower lows |
Lower lows |
Strengthening bearish momentum |
| Lower lows |
Higher lows |
Weakening bearish momentum |
| Sideways price |
Fluctuating CCI |
Uncertain directional momentum |
An uptrend reflects sustained demand through rising prices, while a downtrend generally reflects stronger selling activity.
Still, price direction alone doesn't determine momentum quality. A cryptocurrency can continue rising even as its underlying momentum weakens.
Comparing Consecutive CCI Peaks
Consider a hypothetical Bitcoin price chart:
| Swing |
BTC Price |
CCI Reading |
| First high |
$90,000 |
145 |
| Second high |
$93,000 |
210 |
| Third high |
$95,000 |
125 |
The second swing shows expanding momentum. The third reaches a higher price but produces a substantially weaker CCI reading.
Buying pressure may be losing strength relative to recent price dispersion, despite continued gains.
A similar approach to comparing MACD momentum across consecutive price swings helps distinguish trend continuation from momentum deterioration.
Identifying Overbought and Oversold Conditions
CCI commonly uses +100 and −100 as reference thresholds.
| CCI Reading |
Common Interpretation |
| Above +200 |
Significant bullish overextension |
| Above +100 |
Strong bullish momentum |
| Around zero |
Price near its recent average |
| Below −100 |
Strong bearish momentum |
| Below −200 |
Significant bearish overextension |
These levels help identify overbought and oversold conditions, but they aren't automatic trading signals.
A cryptocurrency trading above +100 may continue rising during strong demand. Similarly, falling below the lower band at −100 doesn't establish that an asset is undervalued.
The market may simply be experiencing a sustained directional move.
Traders should distinguish an overextension from an actual reversal by examining price rejection, support, resistance, and changes in momentum direction.
Using CCI Divergences for Potential Trend Reversals
CCI divergences occur when the indicator's swing structure differs from price action.
Bullish Divergence
Bullish divergence develops when price forms lower lows while CCI produces higher lows.
For example, Bitcoin falls from $85,000 to $82,000, but CCI rises from −220 to −140.
Selling pressure appears less pronounced relative to recent price behavior, suggesting a possible recovery.
A break above nearby resistance provides stronger confirmation than divergence alone.
Bearish Divergence
Bearish divergence occurs when price makes higher highs while CCI records lower highs.
This pattern suggests weakening bullish momentum and may highlight potential selling opportunities.
Neither divergence guarantees trend reversals. Continued institutional participation, changing market sentiment, or unexpected news can sustain the existing trend.
Combining CCI With Relative Strength Index and Other Technical Indicators
CCI and the Relative Strength Index (RSI) are popular indicators, but their calculations capture different aspects of momentum.
| Feature |
CCI |
RSI |
| Measurement |
Normalized price deviation |
Relative gains and losses |
| Standard period |
20 |
14 |
| Range |
Unbounded |
0–100 |
| Overbought threshold |
100 |
70 |
| Oversold threshold |
−100 |
30 |
The StockCharts CCI documentation explains how extreme readings can indicate emerging trends as well as stretched market conditions.
Combining CCI with the stochastic oscillator, RSI, or rate of change can provide additional momentum context.
Volume and market trend strength analysis offer confirmation from different market characteristics. Agreement between several price-based indicators alone doesn't establish an independent trading signal.
Improving Market Timing With Short-Term and Long-Term Timeframes
Lower crypto timeframes often generate substantial noise. Sudden volatility, liquidations, and temporary liquidity imbalances can produce misleading CCI extremes.
A multiple-timeframe trading strategy helps separate directional analysis from entry timing.
| Timeframe |
Primary Purpose |
| Daily |
Long-term market direction |
| 4-hour |
Trend and momentum comparison |
| 1-hour |
Pullback confirmation |
| 15-minute |
Short-term entry observation |
For example, when daily CCI remains positive, a temporary negative reading on the hourly chart may reflect a pullback rather than a broader reversal.
Using multiple timeframes to confirm pullbacks helps traders interpret these differences without treating every conflicting reading as a new trend.
A Practical CCI Momentum Comparison Trading Strategy
Traders can apply the following workflow to an asset such as Bitcoin using the BTC/USDT spot chart on Gate.com.
-
Identify the prevailing trend using market structure and moving averages.
-
Apply a 20-period CCI to the price chart.
-
Compare the indicator readings at two completed price swings.
-
Check whether momentum confirms the latest price movement.
-
Observe trading volume, order-book liquidity, and support or resistance.
-
Establish an invalidation level before considering an entry.
Volume spikes can support the interpretation of a strong move, particularly when market depth also improves. Liquidation-driven spikes, however, can produce temporary momentum extremes.
A predefined price target and stop-loss help structure the strategy without depending entirely on CCI.
Technical Analysis, Fundamental Analysis, and Risk Management
CCI evaluates historical price behavior, not fundamental value.
Market capitalization indicates an asset's relative size but doesn't guarantee stability or liquidity. High trading volume may reflect market acceptance, speculative activity, or exceptional volatility.
Fundamental analysis, community sentiment, and token supply changes provide context beyond technical indicators.
The CFTC's virtual currency risk advisory emphasizes the risks associated with volatile cryptocurrency markets.
Common risk management practices include limiting planned losses per trade, using stop-loss orders, and diversifying investments. A conservative example is risking less than 1% of trading capital per position, recognizing that slippage can increase actual losses.
Conclusion
CCI momentum comparison helps traders determine whether successive cryptocurrency price swings exhibit expanding or weakening momentum. Its unbounded scale is particularly useful for evaluating market overextensions and divergences. The strongest practical application combines CCI with price structure, volume, and higher-timeframe trends. No indicator can independently predict price direction or eliminate trading risks.
Frequently Asked Questions
What is CCI momentum comparison?
CCI momentum comparison evaluates indicator readings across consecutive price swings to determine whether relative bullish or bearish momentum is strengthening or weakening.
What is the best CCI setting for crypto trading?
A 20-period CCI is a conventional starting point. Shorter settings increase sensitivity, while longer settings generally reduce noise at the expense of responsiveness.
Is CCI better than RSI for measuring momentum?
Neither indicator is universally better. CCI helps identify price overextensions, while RSI evaluates the relative strength of recent gains and losses within a bounded range.
Does CCI above +100 mean traders should sell?
No. A reading above +100 can indicate strengthening bullish momentum. Traders should examine market structure before interpreting it as a reversal signal.
Which timeframe is best for CCI momentum comparison?
Four-hour and daily charts generally provide less noisy momentum comparisons than very short timeframes. The appropriate timeframe depends on the trading strategy and holding period.
Can CCI identify false breakouts?
CCI can highlight weakening momentum behind a breakout. Combining it with volume, liquidity, and price-action confirmation may help filter unreliable signals.
Disclaimer: This content is for educational purposes only and does not constitute financial or investment advice. Cryptocurrency trading involves risk, and technical indicators do not guarantee future performance.