
Square
Following
Hot
News
Notifications
Profile
Share your thoughts
placeholder
Article
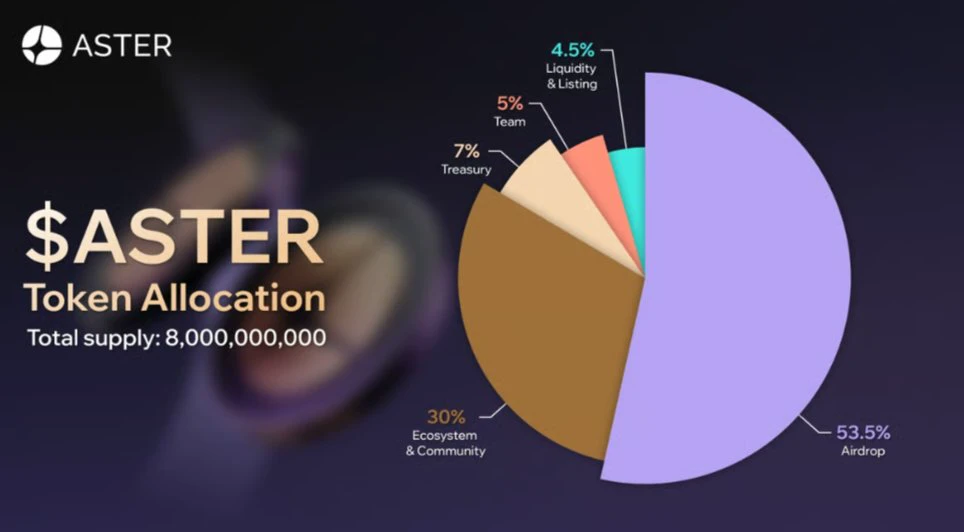
This is really legit $ASTER hurry and sign up for free
#airdrop
post-image
ASTER-0.07%
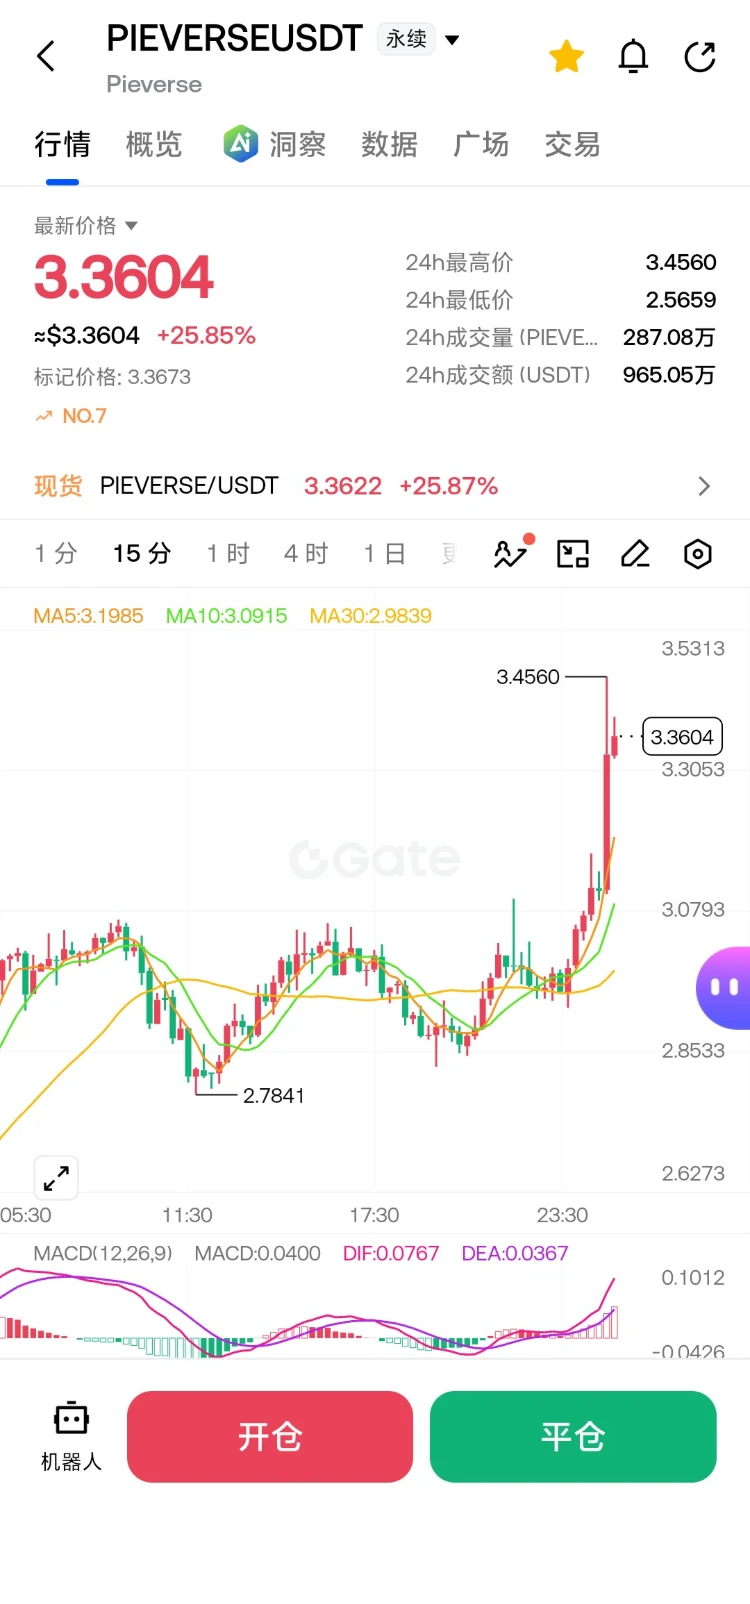
Sure enough, it's skyrocketing📈; weekends belong to the altcoins, and that hunch was spot on
post-image
  • 2
Trenches
PIEVERSE
P
bade
b
PIEVERSE
0x0e...25a9
Market Cap
$.
Change
.
24h Vol
$.
Holders
.
FIONA
F
bade
b
FIONA
B34n...pump
Market Cap
$.
Change
.
24h Vol
$.
Holders
.
IDOL
I
bade
b
IDOL
0x3b...ab07
Market Cap
$.
Change
.
24h Vol
$.
Holders
.
Singularity
S
bade
b
Singularity
7R4M...pump
Market Cap
$.
Change
.
24h Vol
$.
Holders
.
PUNANI
P
bade
b
PUNANI
2Tng...pump
Market Cap
$.
Change
.
24h Vol
$.
Holders
.
$NEAR is strong in the short term but weak on the 4-hour chart—which will change first?
$NEAR is currently trading at 2.884, up 1.98% over the past 24 hours, with an intraday range of 2.55–2.933. The 1-hour chart looks strong: price has moved above the EMA20 at 2.8231, while RSI14 at 69.63 is nearing overbought territory. The volume ratio is just 0.44, below average, indicating limited participation from short-term buyers. The 4-hour chart remains weak, with price still trading below the EMA20 at 2.9918. RSI14 is deeply oversold at 24.44. Although the 4-hour RSI is deeply oversold, price has f
post-image
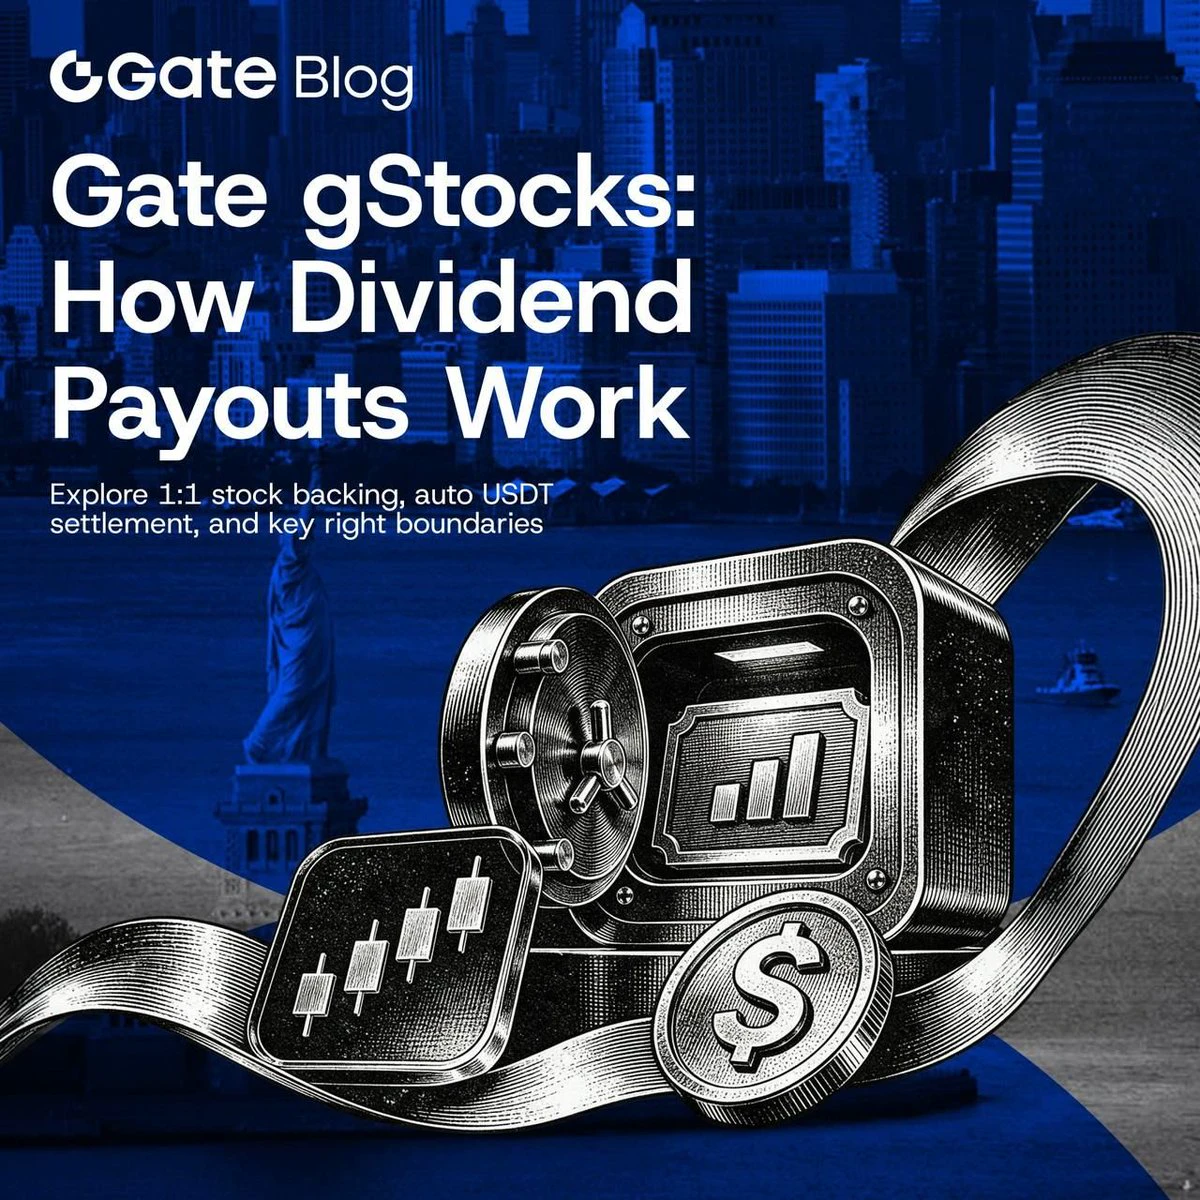
gate gstocks automatically credits eligible stock dividends in usdt, after a 10% withholding tax, with no manual claims required.
#GSTOCKS #DIVIDENDS $GATE
post-image
Cat tax.
Continue scrolling.
post-image
Crypto market update anylsis overall
live-cover
LIVE794
BTC-0.67%
ETH-1.26%
SOL-0.77%
ZEC+1.16%
XRP-1.15%
$ENA Looks for Opportunities Through Cycle Confluence; Levels and Exit Lines Are Here
$ENA There’s a very typical debate right now: one side points to the 24-hour gain of +1.24% as proof of direction, while the other counters with key levels. I’m not taking sides based on the gains or losses just yet, because $ENA has moved first on the 1-hour chart, but the 4-hour chart hasn’t confirmed it or given a complete answer. I’ll treat the shorter timeframe as a reminder, not a conclusion; without confirmation from the larger timeframe, direction can still shift.
My view is that I’d rather see this a
post-image
ENA+8.04%
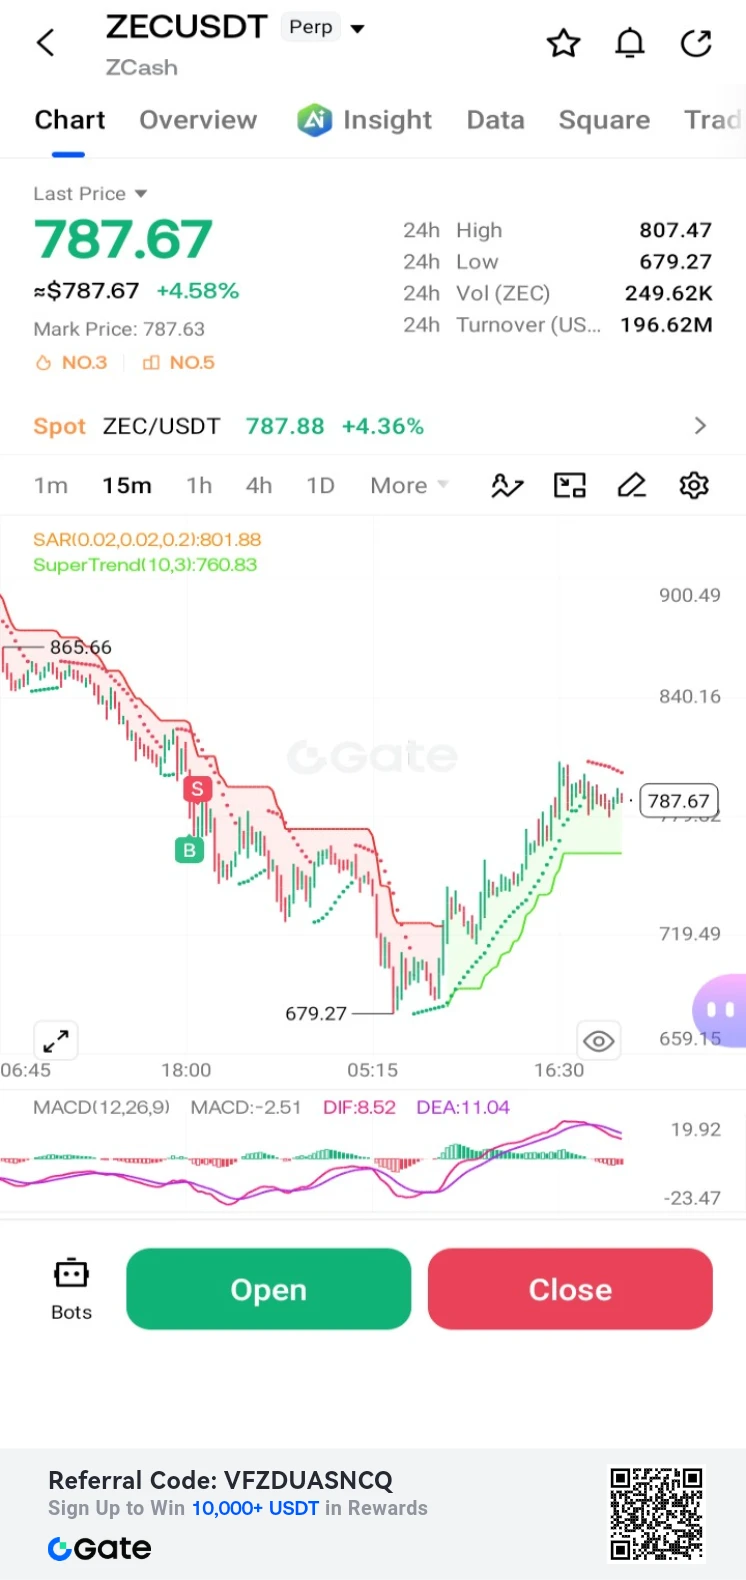
$ZEC /USDT Perp – "Sharp Recovery – Long"**
Trading Plan Long $ZEC
Entry: 787.67
SL: 760.83
TP1: 840.16
TP2: 865.66
ZEC is up +4.58% and recovering aggressively from the 679.27 low. MACD is strongly bullish; targeting the 840.16 resistance.
post-image
ZEC+1.29%
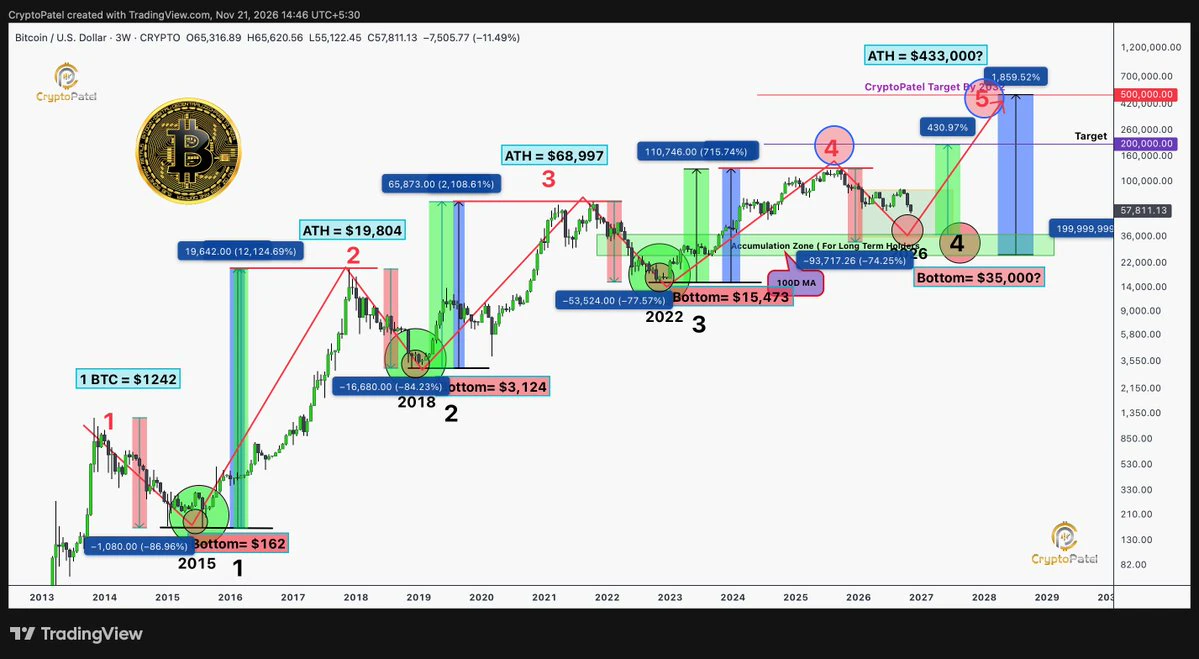
BITCOIN 2026–2029 CYCLE PREDICTION: NEXT BOTTOM & ATH TARGETS
After analyzing $BTC historical cycles and diminishing returns, here's my 2026–2029 projection:
➡️ Next bottom: $25K–$37K
➡️ Bottom window: Q4 2026–Q1 2027
➡️ 2029 ATH Target: $160K–$200K
➡️ Base case: $170K
TIME and PRICE models are giving different signals.
I'm preparing for the next accumulation phase, not trying to catch the exact bottom.
Think in cycles, not candles.
NFA.
post-image
BTC-0.67%
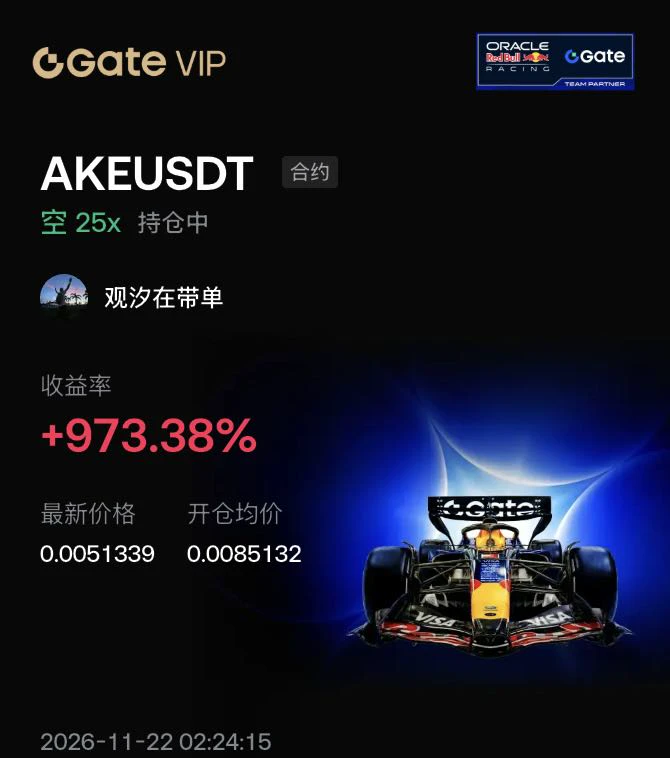
At 2 a.m., the price plunged to 0.0051339, with the short position up +973%—these “wake up and make money” trades are actually the result of staying up and grinding it out.

AKE is a token for an AI game-generation platform on BNB Chain, with a total supply of 100 billion. Only about 23% is currently circulating, and unlocks will continue through 2029. Early on, the “AI + gaming” narrative sent it sprinting from 0.00017 to 0.1467. It has now fallen more than 96% from its peak and dropped over 50% in the past 7 days—a classic major downtrend following a parabolic peak.
$BTC
Entry: On the 4-hou
post-image
BTC-0.65%
ETH-1.23%
UAI-7.51%
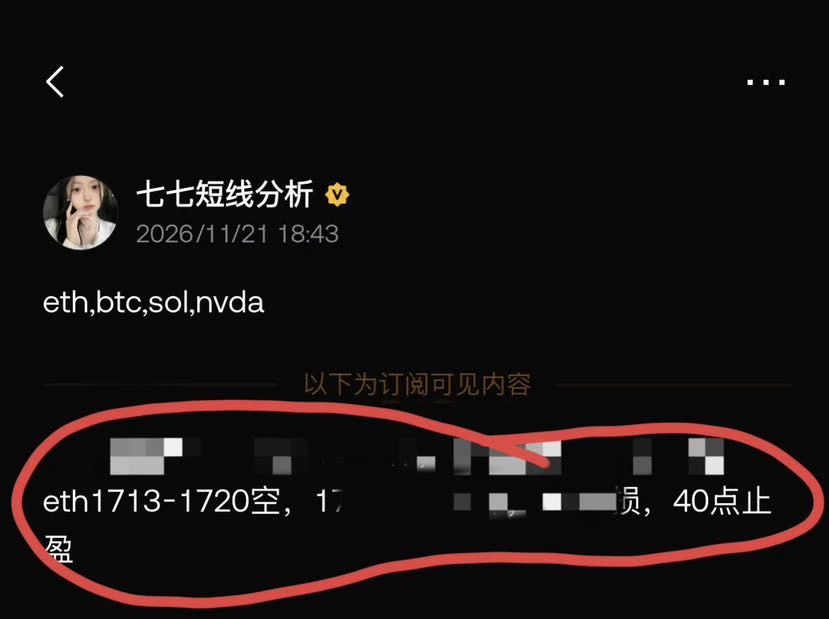
ETH short at 1713 is making gains
post-image
  • 2
  • 1
$BTC The starting point of this trade wasn’t a call on direction, but positioning. The moment 56,000 was swept through, what was stacked below were other people’s stop losses, not my thesis. I placed my order at the lower edge of the cluster and waited for the market to burn through the fuel itself.

Only after reclaiming the round-number level and retesting without breaking lower was the structure confirmed. Until then, it was just a resting order; after that, it became a trade. The difference matters more than direction.

I barely did anything in the middle. With a high-leverage position, th
BTC-0.65%
ETH-1.23%
SNDK-0.18%
  • 2
Let’s go, GPU miners—keep giving it your all!
post-image
I changed my mind. I used to believe the saying, “After a drop this deep, the bottom can’t be far away.” $MMT Today’s low was 0.2113, down from 0.2783, a 16.65% drop, with turnover still at 162.4M. That’s not a small figure. It shows buyers are stepping in, but getting buried one batch at a time.
A deep drop doesn’t mean it’s the bottom; it only means sellers are still on the move. What really matters isn’t how much it’s fallen, but whether volume contracts after the drop and the price holds steady in a certain range. This move looks more like the car is still going downhill, with no brake lig
MMT-2.35%
#Gate直通IPO第三期ANT配售9210
Gate Direct IPO Phase Three, ANT Allocation of 92,100 Shares

The world of digital finance continues to evolve, creating new opportunities for investors to explore emerging technologies, innovative financial platforms, and the future of blockchain driven ecosystems. Gate Direct IPO Phase Three brings renewed attention to the ANT allocation of 92,100 shares, highlighting the growing interest in digital asset related investment opportunities and the expanding connection between traditional investment concepts and modern financial technology.

The third phase represents an
post-image
ANT+0.00%
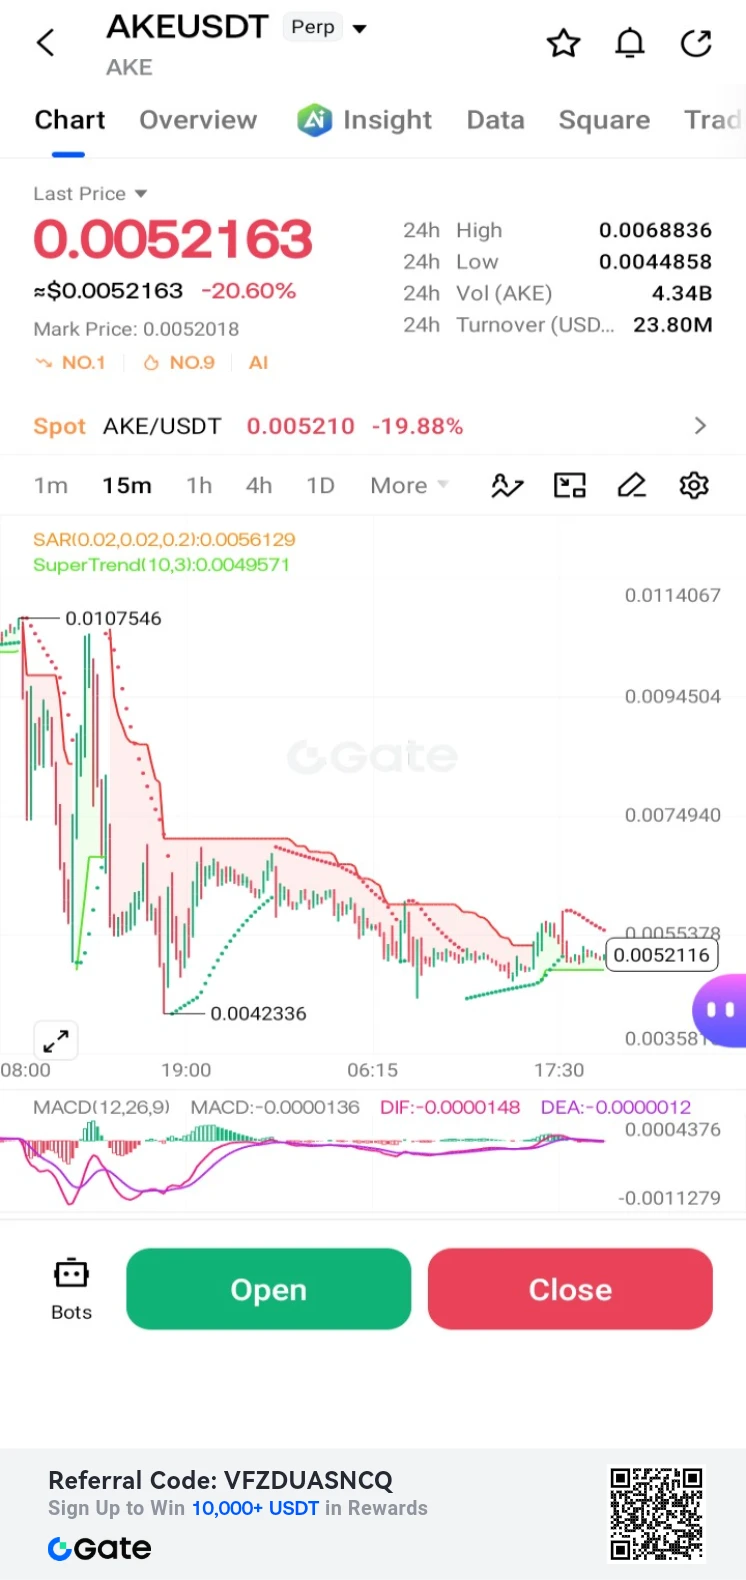
$AKE /USDT Perp – "Heavy Downtrend – Short"**
Trading Plan Short $AKE
Entry: 0.0052163
SL: 0.0056129
TP1: 0.0042336
TP2: 0.0035800
AKE is down -20.60% and failing to find support. MACD is bearish; targeting a break below the 0.0042336 low.
post-image
AKE+6.39%
The old carpenter planes a board, stopping after every three strokes to feel the grain. You can’t rush it; the grain has a say of its own.
$ZS These past seventy-two hours have followed a similar grain. The afternoon before yesterday, it was still grinding around 193, with turnover just under 2 million. Even a little volume could push it along, and nobody paid much attention then. By night, the price began edging up. The pace wasn’t fast, but every pullback bottomed higher than the last—this kind of move doesn’t look like retail traders scrambling to buy; it looks more like someone had paved t
Drop already, I want to buy the dip. Damn, it actually rebounded 5,000 points in one day. Is this still the Bitcoin I know? I really misjudged you. Sorry, Bitcoin😭$BTC $ETH $ZEC ‌ ‌ ‌
post-image
BTC-0.65%
ETH-1.23%
ZEC+1.29%
$EVAA The logic behind this rebound is very clear. I entered a 10x long position precisely at 4.1957, and the price climbed all the way to 6.2191, with unrealized gains exceeding 478%. A review of the chart: after stabilizing at the lows, trading volume expanded and the moving averages turned upward into a bullish alignment—a classic signal that a trend is taking off.

The chart shows strong bullish momentum, with the price continuing to rise without encountering significant selling pressure. 10x leverage amplified the gains, but the price has already risen substantially, and a pullback driven
post-image
EVAA-0.42%
BTC-0.65%
ETH-1.23%
Load More

Join 40 M users in our growing community

⚡️ Join 40 M users in the crypto craze discussion

💬 Engage with your favorite top creators

👍 See what interests you

Trending Topics

BTCBreaksBelow60K

2.1M Views29.9K Discussing

BTC fell below $60,000 on November 20 for the first time since July, alongside a tech stock selloff and broader pressure on risk assets. Will $60K become resistance, or can BTC quickly reclaim it? What price or volume signals would convince you that selling pressure is easing?

GateDirectIPOPhase3ANTAllocates92100Shares

782.8K Views4.9K Discussing

NvidiaDropsNearly14Percent

328K Views7.6K Discussing

View More