Share your thoughts
placeholder
Article
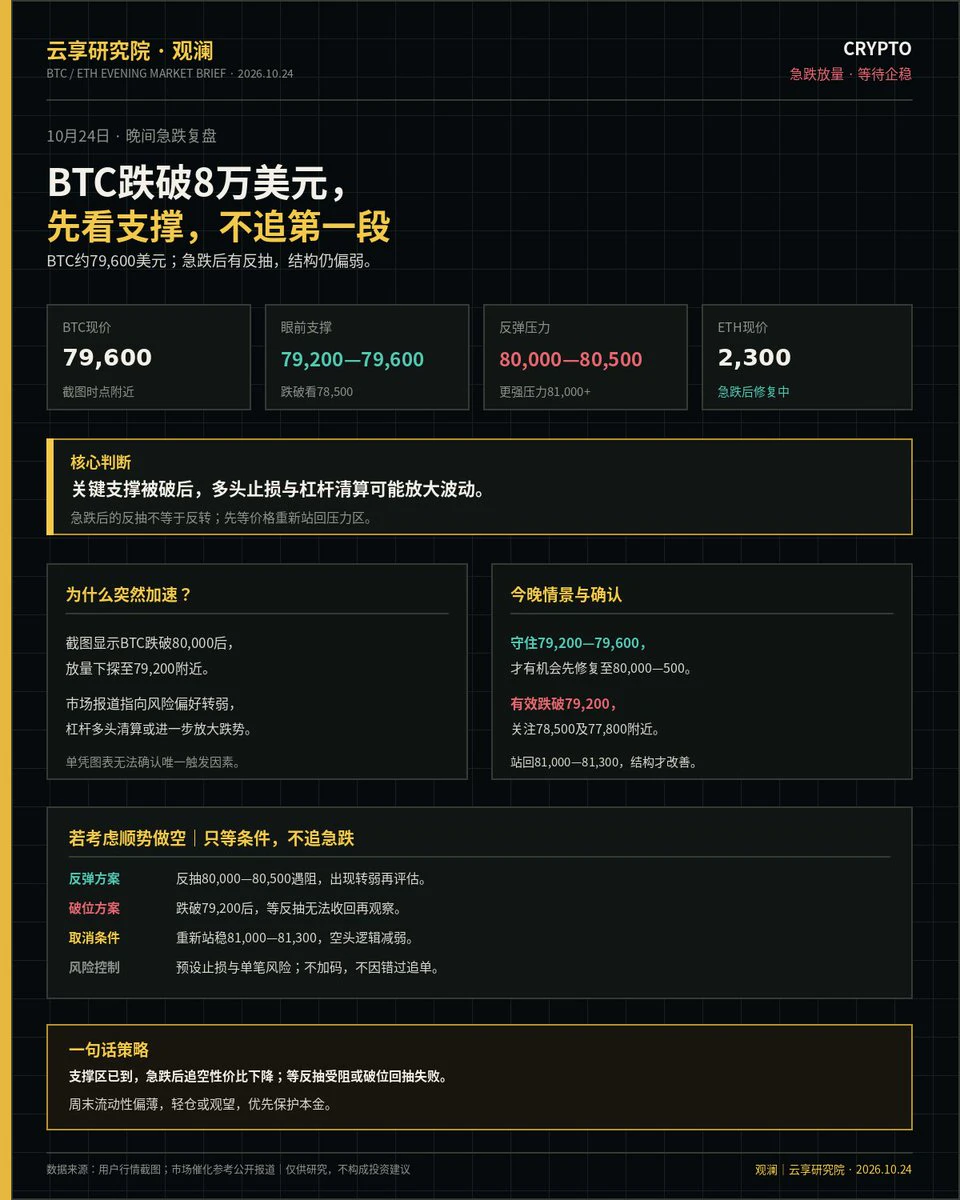
Nonfarm payrolls dump BTC back below 80,000; long-term direction unchanged, still targeting 84,000💛
After the nonfarm payrolls data was released, Bitcoin was once again dumped back below $80,000.
Even amid the impact of adverse macro factors, my long-term target remains unchanged, with the next target still at 84,000.
Let's clarify the current market contradiction:
August employment growth came in well above expectations, prompting the market to raise expectations for Fed rate hikes and creating clear macro-level pressure.
On the other hand, the BTC spot ETF still maintained net inflows of ap
post-image
BTC+0.19%
It was down 6% yesterday, then exploded higher today! Has SoftBank boarded the AI roller coaster?
SoftBank's recent stock performance has made the meaning of “high volatility” crystal clear.
SoftBank fell 6.42% on September 2, but by September 4, its stock had surged 11.78%, closing at 5,590 yen.
Behind this move, on the one hand, is the rapid recovery in market risk appetite, and on the other, the renewed strength of the AI sector. Japan and South Korea's markets have recently been clearly driven by the semiconductor and AI supply chains, with Samsung Electronics and SK Hynix in South Korea,
post-image
SK Hynix+3.19%
  • 15
What is #晒出我的持仓收益 CFD used for? Have you paid your tuition? The market changes in an instant—better to have an extra layer of protection.
post-image
  • 9
  • 3
I remain bullish on this market cycle, and I don't think we're at the end of the bull market. Instead, it looks more like the main uptrend is beginning to spread from BTC to altcoins.
Why do I see it this way?
Because what is happening in the market is no longer just one or two coins performing independently.
ZEC keeps making new highs, DASH and XMR are beginning to accelerate, and platform tokens like GT are rising in succession. This shows that capital has started flowing out of BTC, ETH, and the earlier Meme rally, and is once again searching for the next batch of assets with attractive ris
NVDA+0.87%
Nietzsche called it the most genial building ever created.
post-image
U.S. August nonfarm payrolls “blockbuster”! Rate-cut expectations suddenly cooled?
The U.S. August nonfarm payrolls were indeed a bit “strong.” New jobs came in at 162k, directly blowing past market expectations of just over 50k, while the previous two months’ figures were revised up by a combined 55k. The unemployment rate held steady at 4.1%. On the headline figure alone, this is not a cooling labor market, but one that suddenly stepped on the gas.
The market’s most direct reaction was that the Federal Reserve’s rate-cut logic began conflicting again. Investors had previously bet on an econo
BTC+0.18%
NAS100+0.43%
  • 43
This was purely the market being in a good mood and casually tossing out some coins, which happened to land right on my head. While everyone else was rushing in, I was instead watching for a fake move. At the time, $LIGHT surged sharply and aggressively, but the volume didn’t match at all—however I looked at it, it seemed like a bull trap. I didn’t follow the rush; instead, I placed a short around 0.2321.

Being out of the market isn’t a sin; opening positions recklessly is the mistake.

Once the sentiment cooled and the price gradually returned to 0.188, +187.16% was secured. It felt reall
post-image
LIGHT+3.45%
LAB+2.21%
ZEC-0.33%
【$B Signal】Long | 1H pullback to Bollinger midline + bid support
$B 1H pullback to the Bollinger midline, bid-side depth imbalance at 12.02%, current price 0.1733 holding just above the midline.
🎯Direction: Long
⚡Entry/Limit order: 0.172780 - 0.173300
🛑Stop-loss: 0.171567
🚀Target 1: 0.175900
🚀Target 2: 0.177199
🛡️Trading management:
- Execution strategy: After reaching Target 1, reduce the position by 50% and move the stop-loss up to breakeven. If the price falls back to the entry level, exit automatically to protect the principal.
Depth logic: The 4H MACD is above the zero line; the hist
post-image
BTC+0.18%
ETH+1.18%
SOL+1.66%
#RedBullTradingTourSeason6
Red Bull Trading Tour Season 6 is currently gaining attention among crypto traders as Gate’s latest trading campaign combines cryptocurrency competition with the speed and excitement of Formula 1. The Season 6 competition is scheduled to run from August 31 to September 28, 2026, giving participants several weeks to compete for rewards.
The campaign features a dynamic prize pool that can reach 60,000 GT, depending on overall trading volume. Traders can participate through several products, including futures, spot trading, options, leveraged ETF tokens and Convert. Mu
GT+10.60%
ORCL+3.07%
Ping Yeh, a software engineering manager at $GOOG Quantum AI, believes useful quantum computing is more than five years away
Hartmut Neven, who heads Google Quantum AI, has said recent results leave him confident that useful applications only quantum computers can handle will arrive within five years
“He is very confident,” Yeh said at the SEMICON forum. “I am a little skeptical. I want to be more conservative.”
post-image
GOOG-1.06%
GOOGL-1.12%
Everyone’s staring at LTC’s range—but the 77% short signal says the exit door is already open.

LTC/USDT - SHORT

Trade Plan:
Entry: 53.89 – 54.17
SL: 55.80
TP1: 52.70
TP2: 51.82
TP3: 50.49

Why this setup?
- Price is pinned at 54.03 while 4h momentum rolls over; RSI 15m at 47 shows no buying spark.
- ATR 1h (0.57) is tight—this coil snaps fast, and TP1 at 52.70 is only 2.5% away.
- 1D trend is *range*, not bull—so this isn’t a dip-buy, it’s a mean-reversion gift.
- Why now? Entry zone 53.89–54.17 is the last polite area before the slide to 51.82.

Debate:
If LTC breaks 53.80, do you
LTC+8.46%
( new streamer) market overview
live-cover
LIVE57
The hand that set the stop-loss a few days ago trembled slightly; this morning, I realized that was unnecessary filial piety. Before bed, I placed the short order for $TUT , and when I woke up, the candlestick had already completed most of the move for me 😏
Watching the market at the time, the rebound had no volume, and every push upward felt weak. The selling pressure above was obvious—someone was rushing to exit every time the price tested a high. This structure was not a breakout, but a bull trap. I set the entry at 0.042201 in advance; when it was time to short, I shorted without hesitati
post-image
TUT+22.79%
SNDK+1.85%
BNB+7.18%
I was just about to go to the forum and start cursing, but then I looked at my balance and thought, never mind—the market is always right. I placed the order before bed a few days ago and thought it would go to waste, but today $SUI gave the answer directly—entered at 0.7362, now at 0.8054, with an unrealized gain of +452.99%. Feels great, guys.
I didn’t use any fancy analysis this time; I just looked at whether the buying support was strong enough. Before the market had fully started moving, every pullback held the level, which meant someone was buying underneath. Since someone was buying, I
post-image
SUI+6.14%
BTC+0.19%
ADA+4.53%
First signs of weakness on this massive PONS move. I think it would be good if it consolidated/pulled back here, that money flows into other tokens on RH chain and then we repeat with another leg up later.
Same as the BTC stalls > alts run loop we usually do, but RH specific.
post-image
PONS+33.95%
BTC+0.18%
Crypto Signals and Trding Insights
live-cover
LIVE17
Keep holding the $UNI contract—you’re sure to achieve financial freedom. Don’t let yourself get shaken out.
UNI+15.89%
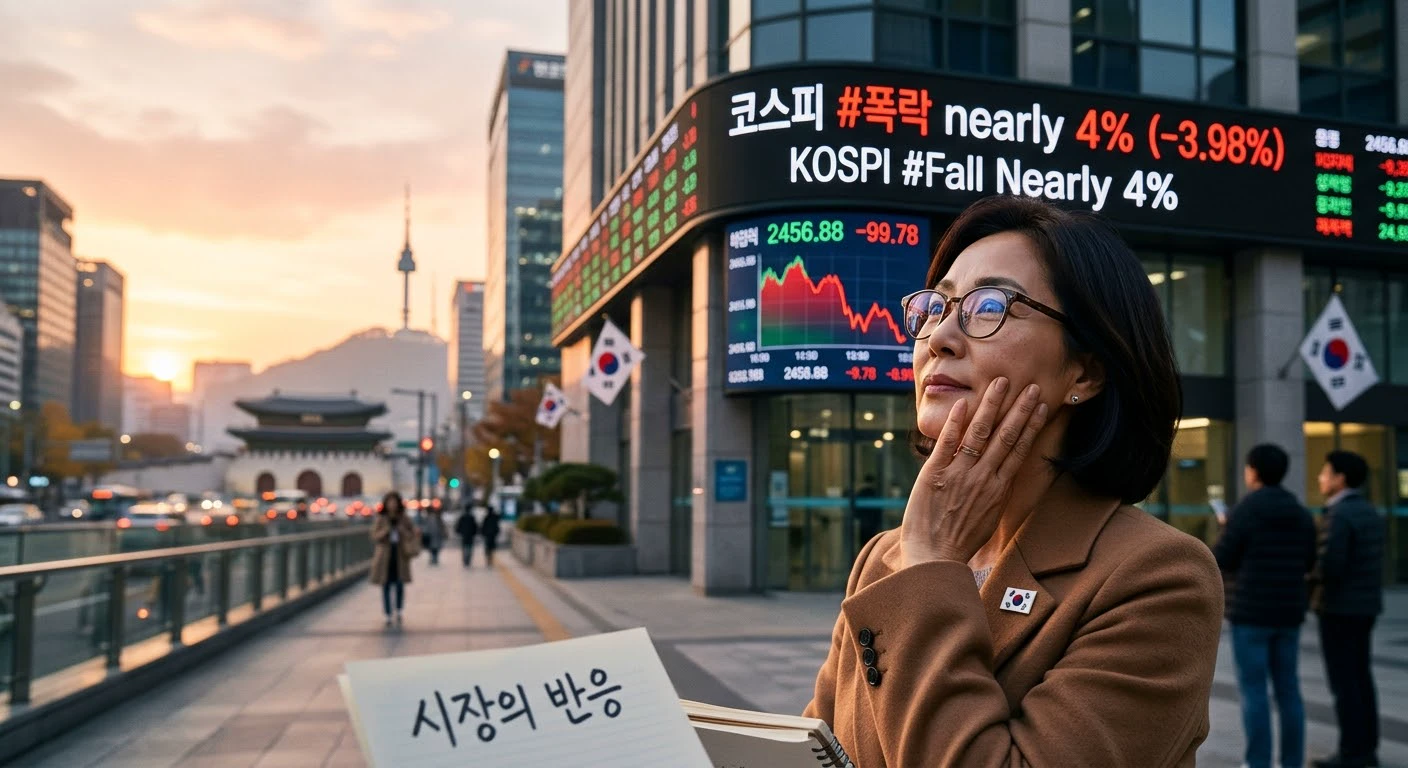
Japanese and South Korean stock markets suddenly launch a broad comeback! SoftBank surges, is the AI rally back?
After the pullback in recent days, Japanese and South Korean stocks quickly staged a “deep V-shaped rebound.” On September 4, the Nikkei 225 rose 1.26%, the KOSPI rose 1.64%, and SoftBank became the market’s main focus.
The core keywords behind this rally remain technology and AI. After Federal Reserve officials sent relatively dovish signals, U.S. Treasury yields fell and sentiment toward U.S. tech stocks recovered, naturally giving Asian semiconductor and AI supply chains a “recha
JPN225-0.76%
What rebound? This is CPR for my account, isn’t it? When the screen was glowing green, I was wondering: Can this market still be traded? Then, right after I finished reading the bearish news, $BZ was forcibly pulled from 92.57 to 96.44, giving me a slap in the face and telling me: Stop being stubborn—the trend is king.
The entry logic was actually very simple: the pullback held, and buying pressure strengthened. When it stops falling, it stops falling; both volume and price were hinting that someone was buying the bottom. While everyone else was running, I chose to look at the weekly structur
post-image
BZ+1.06%
LAB+2.21%
ETH+1.20%
Everyone’s staring at $MU /USDT’s 1016 level, but the 4H chart just whispered a secret that most retail missed.

$MU /USDT - SHORT

Trade Plan:
Entry: 1015.32 – 1017.02
SL: 1026.82
TP1: 1008.18
TP2: 1002.86
TP3: 994.87

Why this setup?
- 4H bias is SHORT with 77.4 confidence—not a coin flip.
- 1D trend is *range*, meaning we’re not chasing momentum; we’re fading the top of the box.
- RSI (15m) at 54.66 shows weak bounce fuel, not a reversal engine.
- ATR (1H) is 3.41—tight, so price is coiling. The 1015-1017 zone is the spring.
- Why now? Entry ref 1016.17 sits right under the range
MU+0.19%
Load More

Join 40 M users in our growing community

⚡️ Join 40 M users in the crypto craze discussion

💬 Engage with your favorite top creators

👍 See what interests you

View More