



Square
Following
Hot
News
Profile
Share your thoughts
placeholder
Article
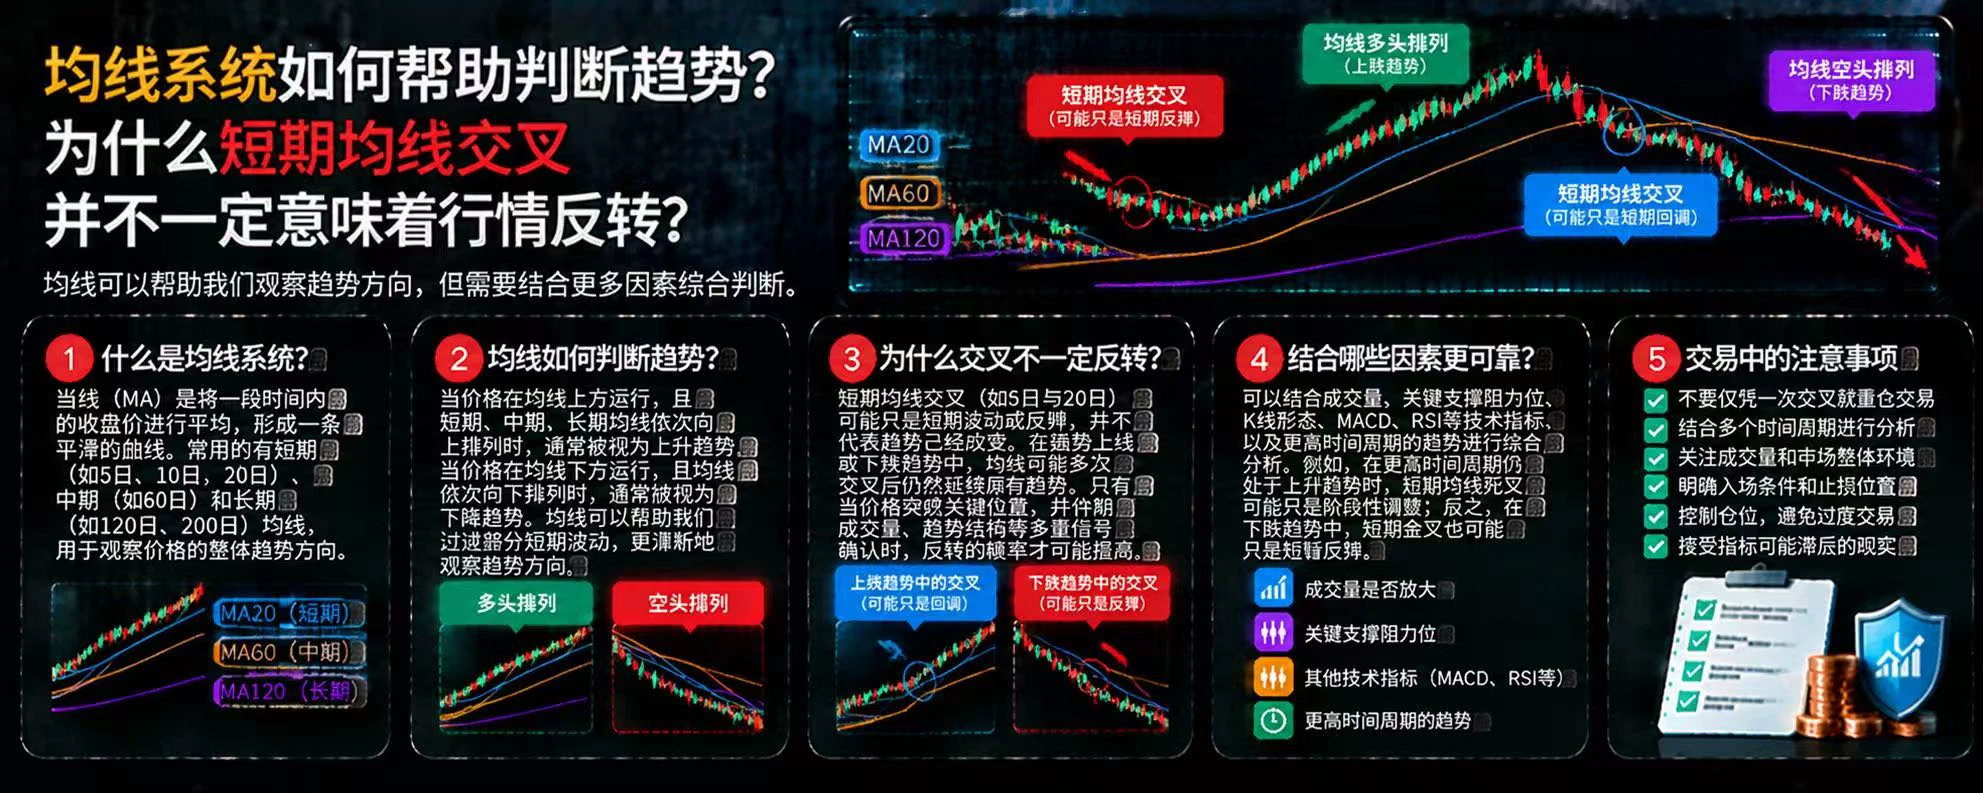
How can moving average systems help identify trends? Why don’t short-term moving average crossovers necessarily signal a market reversal?
In crypto markets, moving averages (MAs) are commonly used to observe price trends. They smooth out short-term price fluctuations and help traders identify market direction, but moving average crossovers are not absolute signals for predicting price movements.
First, what is a moving average system?
A moving average forms a curve by calculating the average price over a given period. Common settings include MA20, MA60, and MA120, which are used to observe sho
post-image
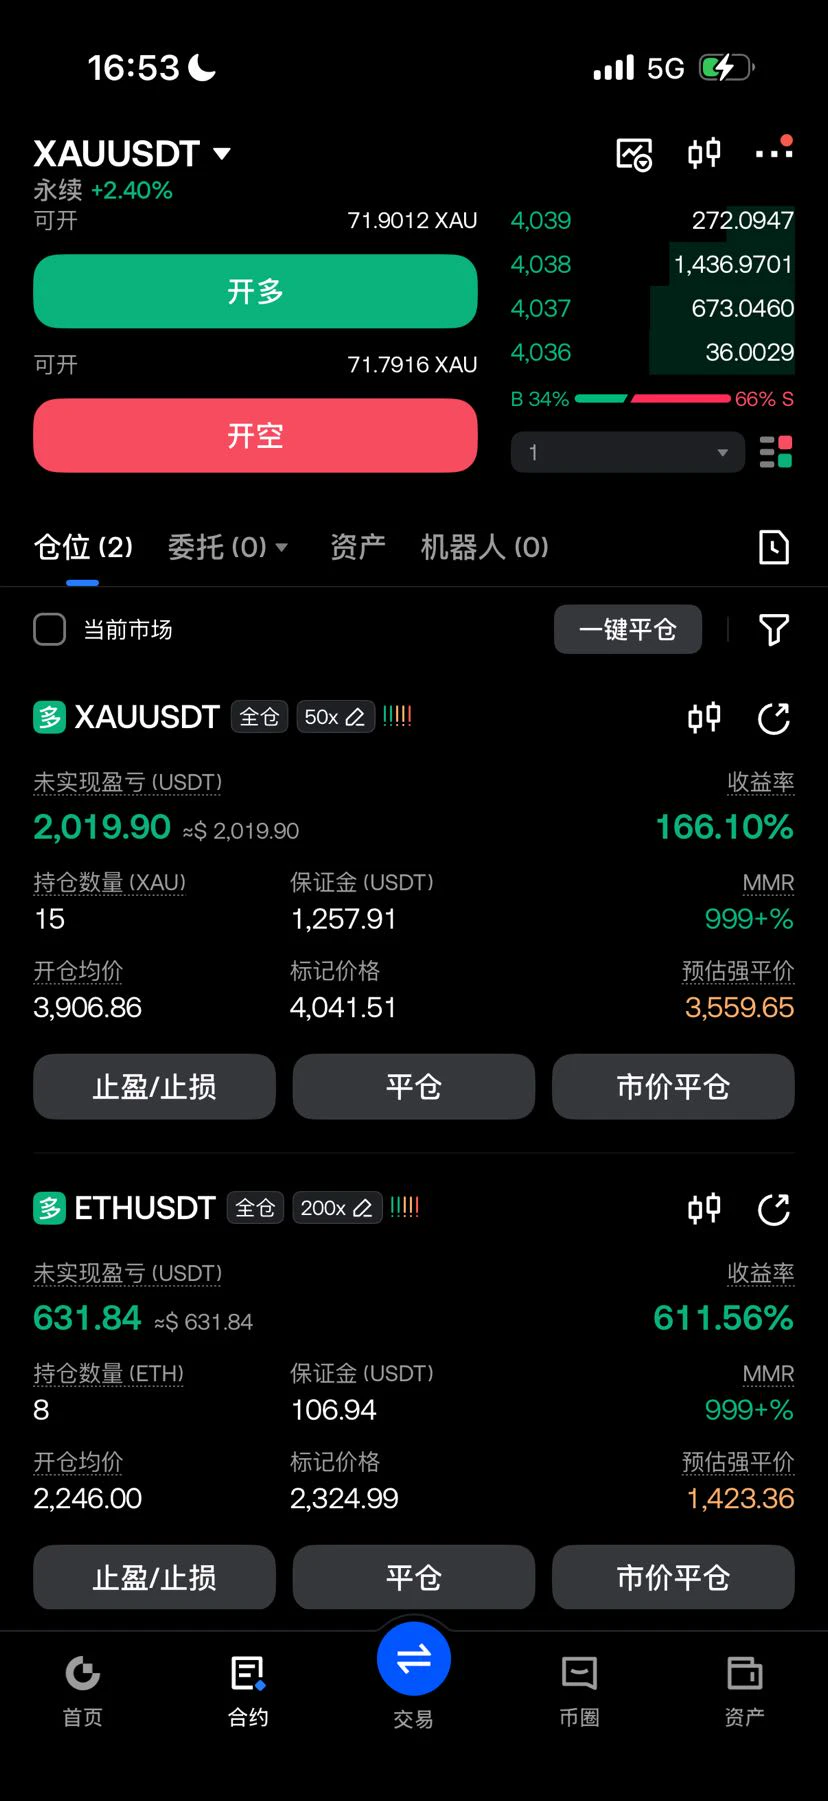
The direction was right; the rest is up to time. The opening move in November played out perfectly. Three hours ago, I said to watch 4050, and it went straight there #XAU
XAU+0.38%
Trenches
ZIG
Z
bade
b
ZIG
0x8c...1145
Market Cap
$.
Change
.
24h Vol
$.
Holders
.
STONK
S
bade
b
STONK
6GmA...UNgx
Market Cap
$.
Change
.
24h Vol
$.
Holders
.
AMD
A
bade
b
AMD
DDmG...pump
Market Cap
$.
Change
.
24h Vol
$
Holders
.
BTC
B
bade
b
BTC
C5xp...pump
Market Cap
$.
Change
.
24h Vol
$.
Holders
.
AGT
A
bade
b
AGT
0x5d...e274
Market Cap
$.
Change
.
24h Vol
$.
Holders
.
$ETH | Live Trade Review: Successfully Captured a 40-Point Move
Market volatility has increased recently and the pace has been fast. Sometimes there isn't enough time to prepare public strategies right away, so live trading signals will be shared first.
This time, we opened a long position in ETH near 2286 and ultimately took profit at 2246, capturing a 40-point move.
Public analysis is inevitably subject to some delay due to its release time, but trade execution depends more on timing and discipline.
If you missed it, there's no need to rush. There are always opportunities in the market. Kee
post-image
ETH-1.26%
[New Streamer] Apple earnings beat expectations, but shares fall nearly 2! Strong results, yet no ra
live-cover
LIVE3,413
‍#每周来晒 #广场交易达人
Why am I going long on Bitcoin at this level?
1. Technicals: 76000 has not been breached, so I remain bullish. I previously shared in an article that 76500 is an important dividing line between bullish and bearish sentiment for Bitcoin. Given the possibility of a wick, this support can be lowered to around 76000. Until this level breaks, Bitcoin’s five-wave upward structure on the daily chart remains intact, so the strategy is still to buy the pullback.
2. The risk-reward ratio is favorable. As mentioned above, I’m setting my stop loss for this trade at 75990, with take-profit
post-image
LittleGodOfWealthPlutus
‍#每周来晒 #广场交易达人
Why am I going long on Bitcoin at this level?
1. Technical factors: 76,000 hasn’t been breached, so I’m still bullish. I previously shared in an article that 76,500 is an important bull-bear dividing line for Bitcoin. Allowing for the possibility of a wick, we can move this support down to around 76,000. Until this level is breached, Bitcoin’s five-wave upward structure on the daily chart remains intact, and the plan is still to go long on a pullback.
2. The risk-reward ratio is attractive. As mentioned above, I plan to set my stop-loss at 75,990, with take-profit targets at 80,000/82,500/84,000. The risk-reward ratio is better than 1:3, making this a worthwhile trade.
3. Macro factors: Midterm election results are about to come in, and bad news being fully priced in can be good news. The U.S. midterm elections entered the voting period yesterday, and some results will be announced today. The market has already priced in the possibility of a Republican defeat. If Republicans win unexpectedly, that would naturally be very positive for crypto. If they lose, we could also see a short-term situation where the bad news is fully priced in. In addition, the oft-cited, somewhat superstitious pattern of markets rising after all 13 previous midterm elections could prompt a major rebound in the Nasdaq, which could also lift Bitcoin.
4. Why go long at 77,100?
First, 76,300–77,000 is a high-volume trading zone in this downturn. Yesterday, the price hit a low of 76,305, and today it moved back above 77,000, showing that buyers are stepping in around this area. A round-number level combined with the previous low is the kind of setup most likely to form a short-term bottom.
Second, sentiment has reached an extreme. Yesterday’s break below 77,000 was triggered by the theft of $6.3 billion from Bn, along with a 2.86% one-day drop in the Nasdaq. This kind of “negative news piling up alongside panic selling” is usually a sign of a short-term bottom—not because the price can’t fall further, but because those who wanted to sell have already sold.

repost-content-media
Privacy Dragon 🐲 #ZEC is going hard today! We took a short-term long on the breakout retest at 1250, and just hit 1295! TP1 completed ✅. Let's eat! Now setting BE! $ZEC
飞鱼2026祝福版
Latest ZEC strategy! Don't miss out!!!
ZEC+1.16%
druckenmiller averaged 30% a year for 30 years
if you put $10k into his fund in 1981, you would have $2.6M when he closed it in 2010
zero down years
post-image
$SOL ‌ Leaning BULLISH SOL has the potential to continue its upward movement toward 94.00–94.53. A strong rebound from 89.83 indicates increasing buying pressure. The MACD is beginning to show bullish momentum. The candlestick pattern reflects a recovery, characterized by a "higher low." The 94.53 level serves as the primary resistance (hurdle). Scenario: A successful breakout above 94.53 would open the path toward 95.00–95.89. Conversely, a failure to break through could lead to a correction toward 92.86–91.34. Conclusion: Bullish in the short term, though a breakout above 94.53 is required
post-image
SOL-0.74%
  • 1
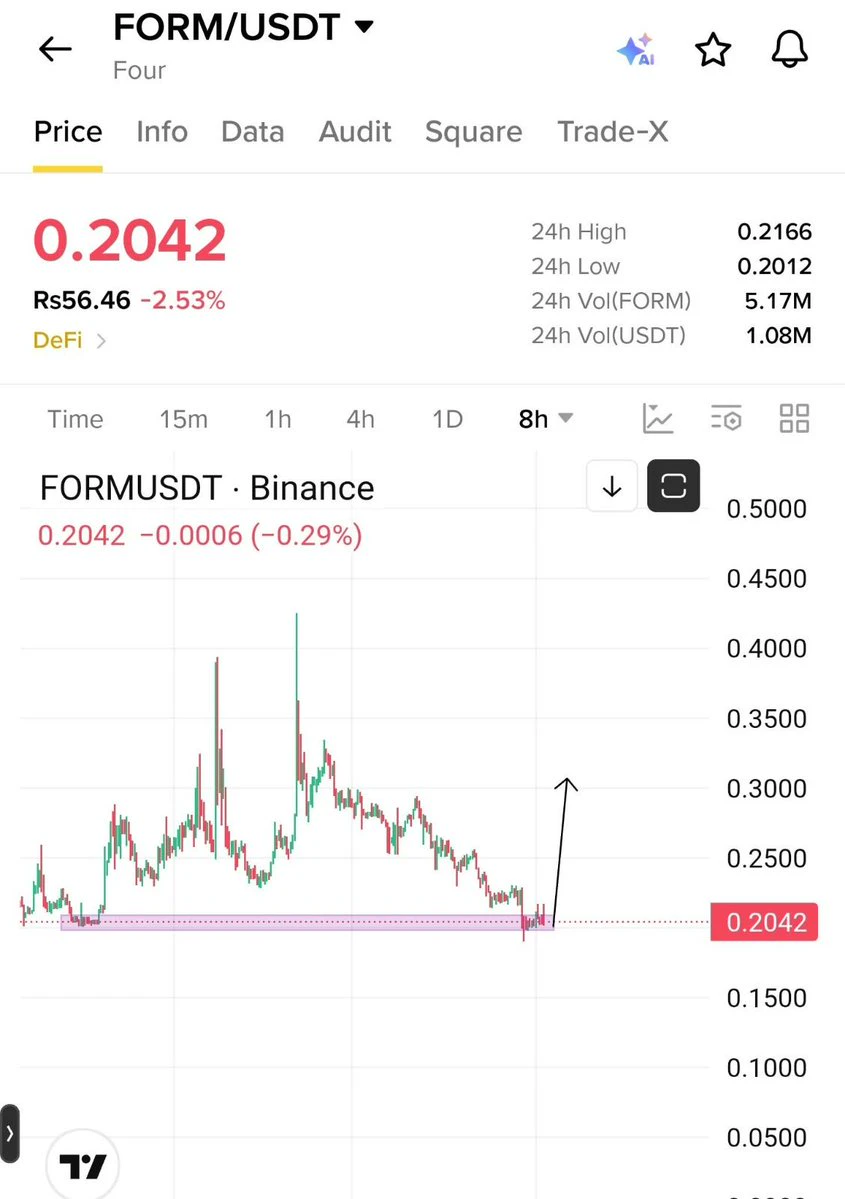
$Form 0.25$ Soon 🧲
Big Blast Loading
Big News soon
Accumulate
post-image
SOON-16.85%
BLAST-15.25%
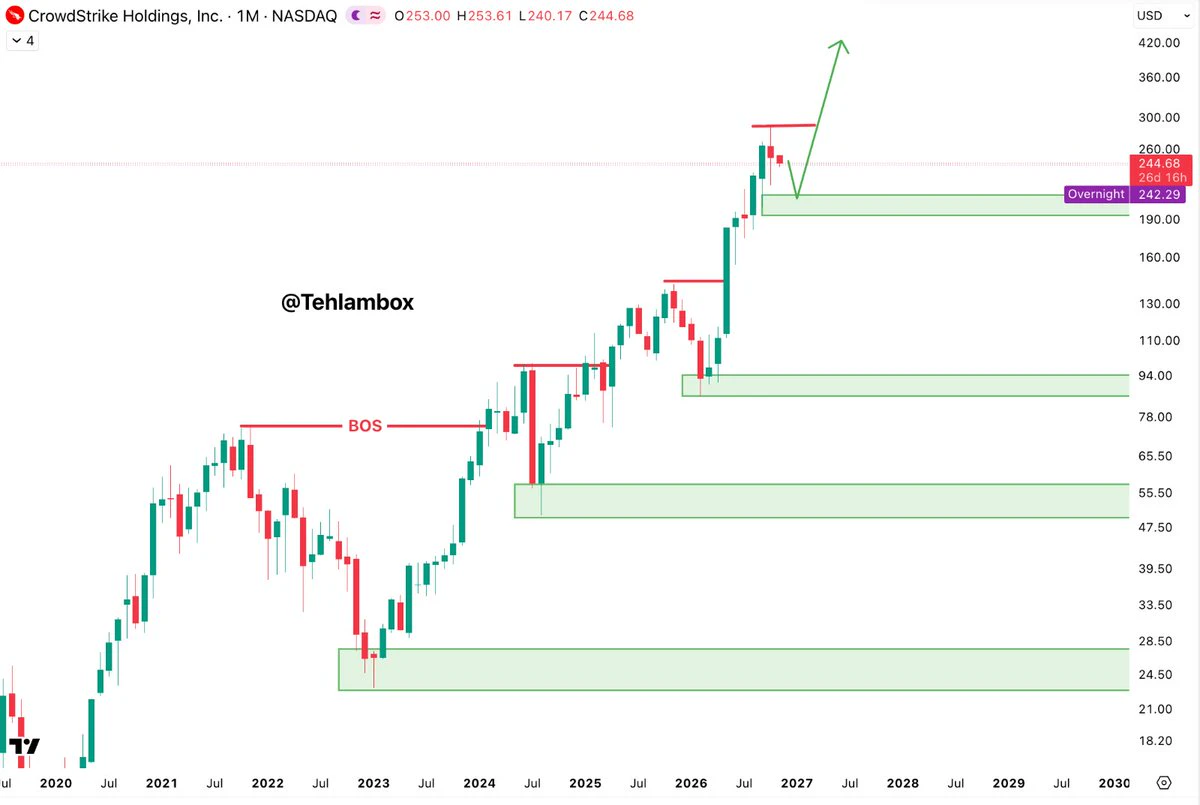
$CRWD has been on an absolute mission since 2023
Now it's pulling back after a massive run, and the $190–240 zone where I'd be watching buyers if they step in
If this turns into another higher low, bears might have to find a new hobby
$300
And people are already writing the obituary because of a pullback
Relax bros, Let the monthly chart breathe a little
post-image
CRWD+1.11%
Guys, today's market action was more thrilling than a roller coaster. I almost thought I was watching a live financial blockbuster!
I was just worrying over an unrealized loss of 16U, wondering if I should cut my losses and get out, when in the blink of an eye, the bulls suddenly staged a comeback! What a lightning-fast plot twist—it feels like the market just shoved the profits right back into our pockets.
Let's take a look at this dramatic comeback in real time:
$ET: Average entry price 2252.24, current price 2292.2, unrealized profit +35.48U (ROI +35.48%). Ethereum, the “big brother,” is ro
post-image
DOGE-0.22%
Just came across this: former A8 genius traders have all sunk to begging online
post-image
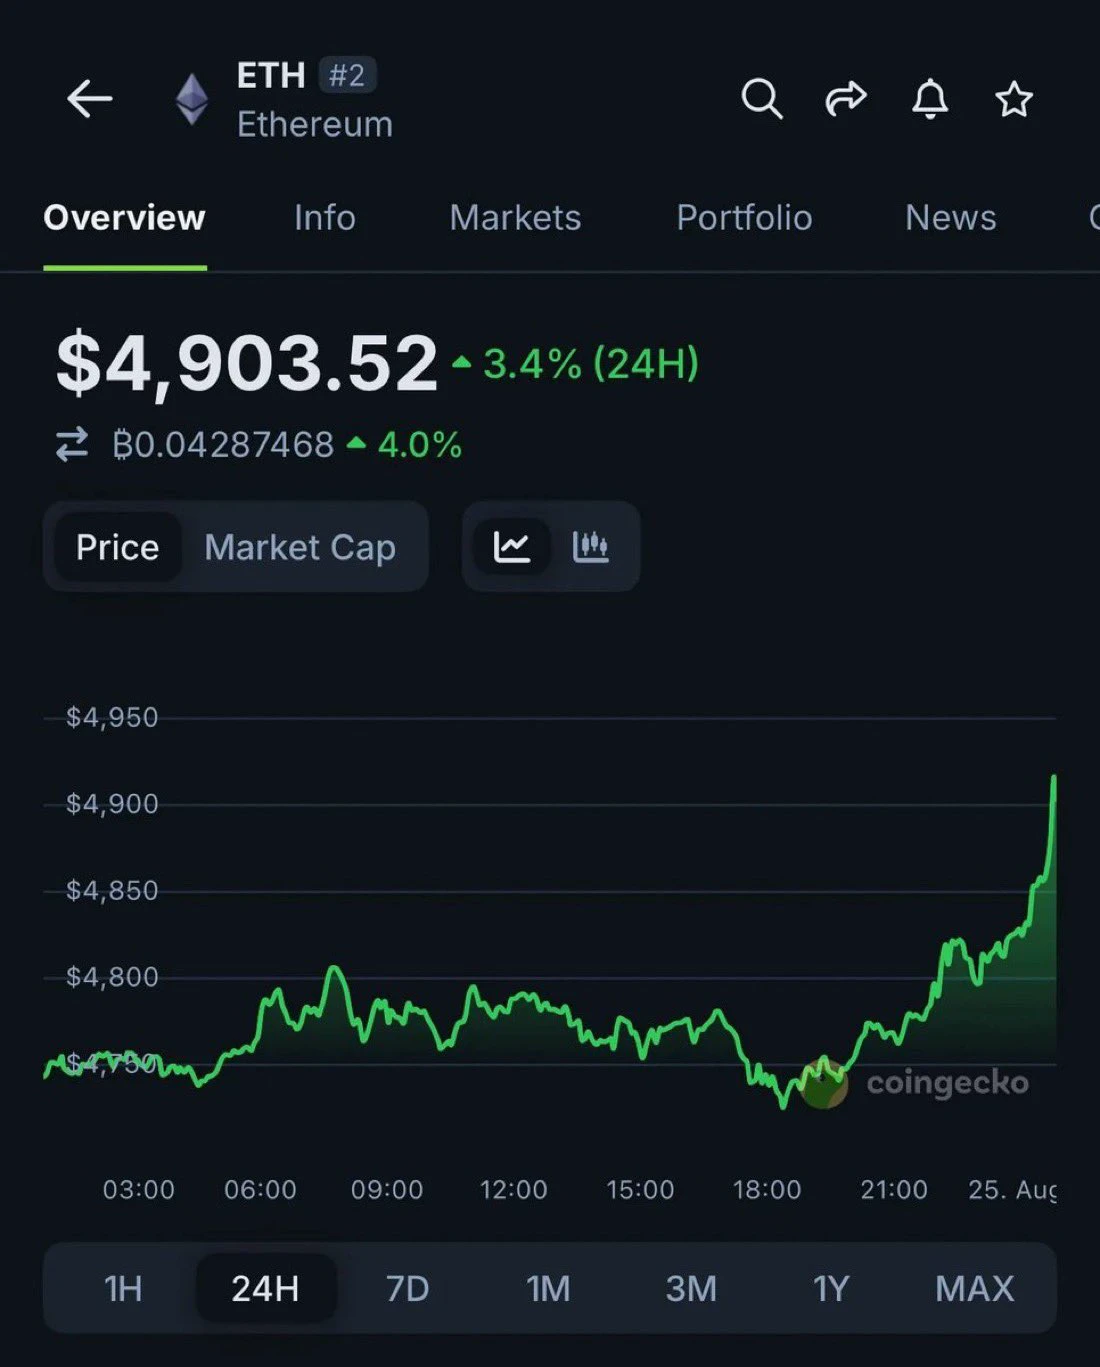
Honest question: Do you think $ETH will ever reach this price again?
post-image
ETH+1.95%
11/4 Update
Everyone got their fill, right!
If you got your fill, like, follow, and comment!
BTC hasn't reached the target yet. Updating in case ETH makes a sudden move.
2353 short, add at 2403, stop loss at 2420
Take profit: 2303-2379
If the short order fills
2303 long, add at 2272, stop loss at 2250
Take profit: 2333-2353-2398
If the short order doesn't fill
2279 long, add at 2232, stop loss at 2210
Take profit: 2303-2333-2378
post-image
BTC-0.65%
ETH-1.23%
STRONG BULLISH $XAU ‌ Trending upward. Bullish momentum is very strong following a breakout from the 3,970 area. The MACD is positive, supporting further gains. Next resistance targets: 4,053–4,070. Nearest support: 4,020. Conclusion: The upside potential remains dominant. However, be wary of a temporary correction, as the price has risen sharply. If it can hold above 4,020, the bullish trend is likely to continue.
Note: Crypto and stock transactions carry the risk of loss. Please conduct your own research (DYOR) before trading. This information is for general purposes only and does not const
post-image
XAU+0.38%
  • 1
Four signals in total today: three wins and one loss. They were all big trades.. I'm a paper-handed retail trader and can't hold on; I wonder if anyone in the livestream managed to.
Today's trend had just one signal: a long at 3942. From now on, I won't be able to stream for the guys to watch for long periods 🤣 I have to turn it off when I leave. I'd like to leave it running too, but the platform won't let me. Emails are sent as usual, and the server is independent, so it won't affect #民主党赢得美国两院
The 2027 QS Asia University Rankings are out. China’s mainland added 53 new entries, bringing its total to 448—more than any other higher education system. Among universities that were already ranked, 177 rose, 159 fell, and 59 stayed the same, for a net improvement rate of 5%.
The rankings may look like a collective surge by mainland universities, but the number of schools rising and falling was almost even, with a net gain of just 5%. Having the most entries doesn’t mean everyone is improving; it’s more like universities overtaking one another on the same track.
$BTC
post-image
BTC-0.67%
[New Streamer] Market Prediction
live-cover
LIVE1,808
Whoever made this image is a genius too😅
Chiikawa is so popular in Japan that you can’t even get into the stores, but
is there anywhere you can buy call options on Chiikawa stock? lol
post-image
Load More

Join 40 M users in our growing community

⚡️ Join 40 M users in the crypto craze discussion

💬 Engage with your favorite top creators

👍 See what interests you

Trending Topics

GateLaunchesTaiwanStockTrading

3.56k Views125 Discussing

Gate has launched Taiwan stock trading with 19 stocks available for direct $USDT trading, including TSMC (2330) and MediaTek (2454). From U.S. and Hong Kong stocks to Japan, Korea and now Taiwan, Gate is connecting users with more global traditional assets. Which Taiwan stock would you most want to access with $USDT — TSMC, MediaTek, or another AI supply-chain name?

DemocratsWinBothChambers

754 Views251 Discussing

ChipStocksRebound

5.57k Views2.93k Discussing

View More