Square
Following
Hot
News
Notifications
Profile
Share your thoughts
placeholder
Article
**$JCT /USDT Perp – "Explosive Momentum – Long"**
Trading Plan Long $JCT
Entry: 0.009011
SL: 0.008724
TP1: 0.009693
TP2: 0.010719
JCT is up a massive +66.56%. MACD is highly elevated; targeting a retest of the 0.010719 spike high. Use very tight risk management due to extreme volatility.
JCT-3.26%
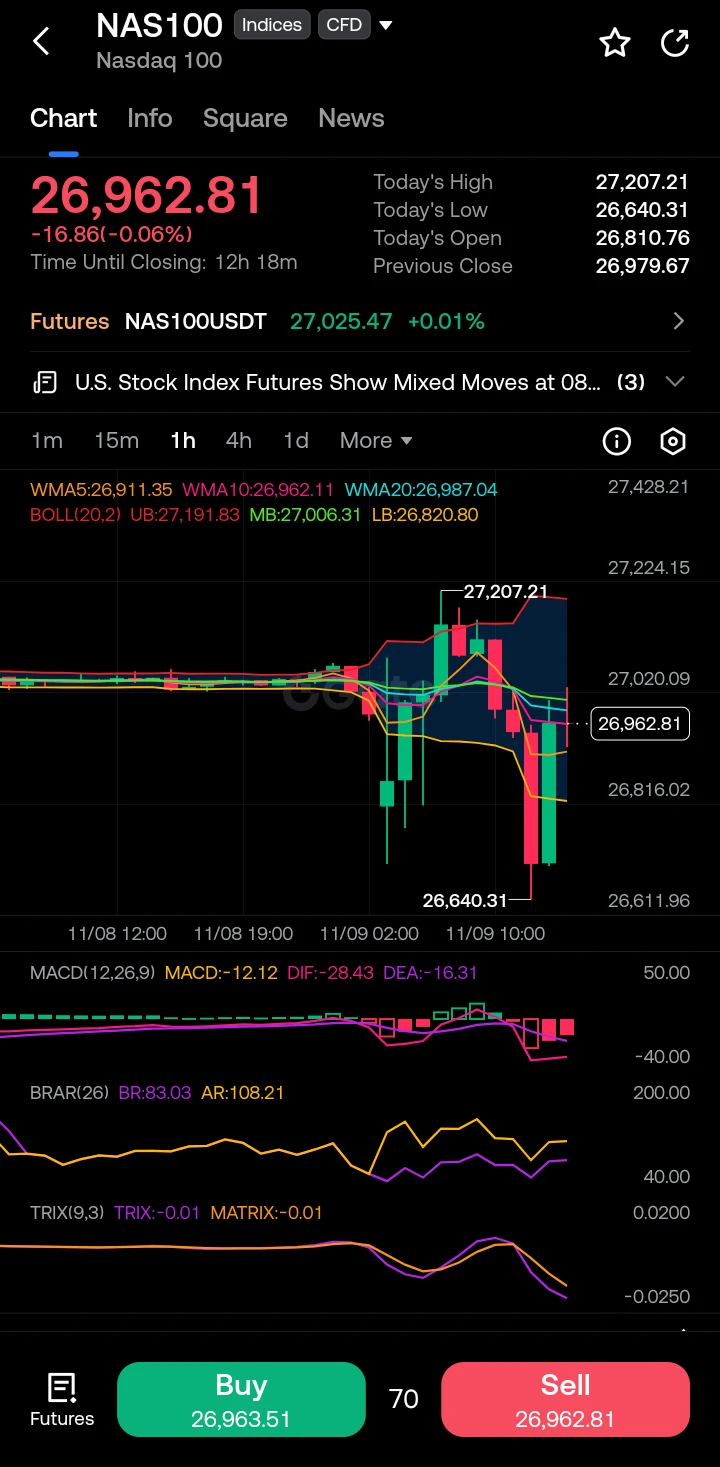
$NAS100 ‌
The market has shifted from a consolidation phase into a bearish structure, breaking down from the previous support zone around the 26,980 level; the price action has created a lower low at 26,640.31, confirming a shift in market structure to the downside.

The K-lines show a strong rejection near the top at 27,207.21 followed by a heavy sell-off, and price is currently retesting the 26,962 level which aligns with the middle Bollinger Band (MB: 27,006.31); the MACD is negative with DIF (-28.43) below DEA (-16.31), indicating bearish momentum is still dominant despite the small green
post-image
NAS100+0.47%
  • 2
Trenches
Libra
L
bade
b
Libra
0xd2...4444
Market Cap
$.
Change
.
24h Vol
$.
Holders
.
牛逼
牛
bade
b
牛逼
0x96...7777
Market Cap
$.
Change
.
24h Vol
$.
Holders
.
ZIG
Z
bade
b
ZIG
0x8c...1145
Market Cap
$.
Change
.
24h Vol
$.
Holders
.
BTC
B
bade
b
BTC
C5xp...pump
Market Cap
$.
Change
.
24h Vol
$.
Holders
.
STONK
S
bade
b
STONK
6GmA...UNgx
Market Cap
$.
Change
.
24h Vol
$.
Holders
.
#USCPIDataIncoming #ShareWeekly $BTC $XAU T
Tomorrow’s CPI report has a quirk that most previews skip. There will be no official yearly inflation rate for October. The shutdown last year left a hole in the October 2025 data, so there is nothing to compare against. When you see a number like 3.7% or 3.9% floating around, treat it as someone’s estimate, not the print. The market will trade the monthly numbers, and that changes how I prepare.

What the market is waiting for

Forecasts call for headline prices to rise about 0.2% to 0.3% on the month, with the Cleveland Fed model near 0.24%. Core i
post-image
BTC-0.67%
XAUT+0.30%
NVDA+2.80%
NAS100-0.07%
XAU+0.38%
  • 2
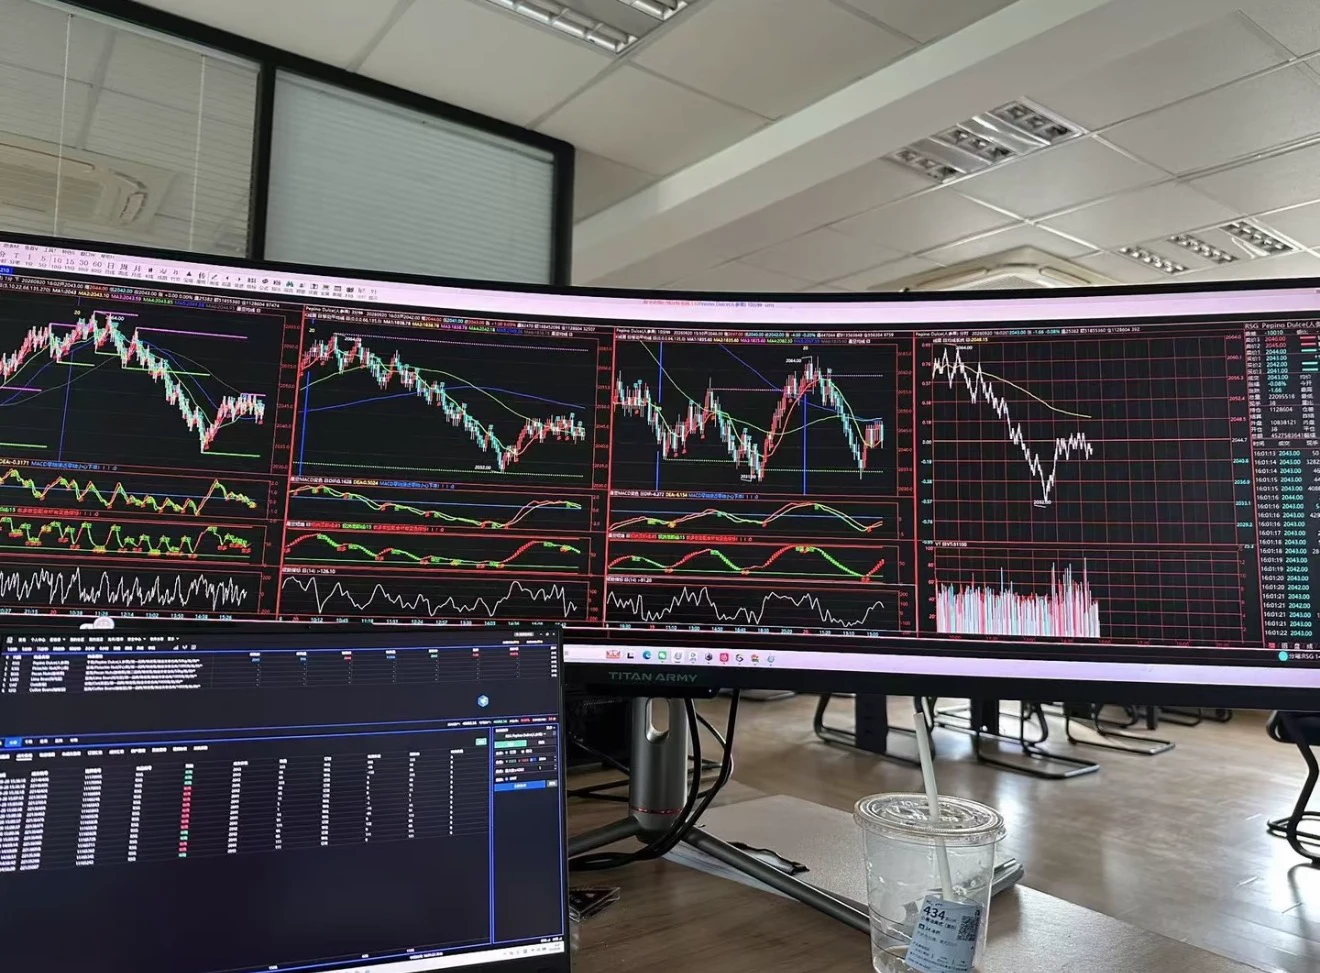
Guys, Xianyu is getting pretty surreal these days.
I just heard from an old college buddy that he’s been placing low-cost Starbucks orders for people on Xianyu. Last month alone, he handled nearly 20,000 cups, making money off the price difference and platform coupons.
I asked him about his net profit, and he stammered that it was around 100,000.
I was stunned. All day long, influencers talk about cross-border independent stores and making money with AI, but in the end, are the ones quietly raking it in all just running these off-the-books proxy-ordering schemes?
Is it really that lucrative, o
post-image
Is Tradingview broken or is this a glimpse from the future?
post-image
$PALMAI #PALMAI
Preparing to test resistance of Bullish Pennant on 1D chart.
Breakout could provide 70-80% rise during coming sessions✍️
Why Martingale Crushes Backtests but Dies in Live Trading
Many people are convinced by Martingale strategies because of the same chart: an equity curve that steadily rises with almost no pullbacks.
“Tenfold returns in three years, with a maximum drawdown of 8%.”
It sounds like the Holy Grail. But those backtests conceal four things that aren’t shown:
1. Backtests don’t simulate “gaps.”
The core of Martingale is “When the price reaches my preset level for adding to the position, I add.” But real markets can gap—jumping straight past all your add-on levels and filling your order at a much worse
post-image
BTC-0.65%
Hu Chenfeng was insulted by HR while looking for a job!
After Hu Chenfeng filed complaints and reports everywhere, HR immediately apologized and admitted fault!
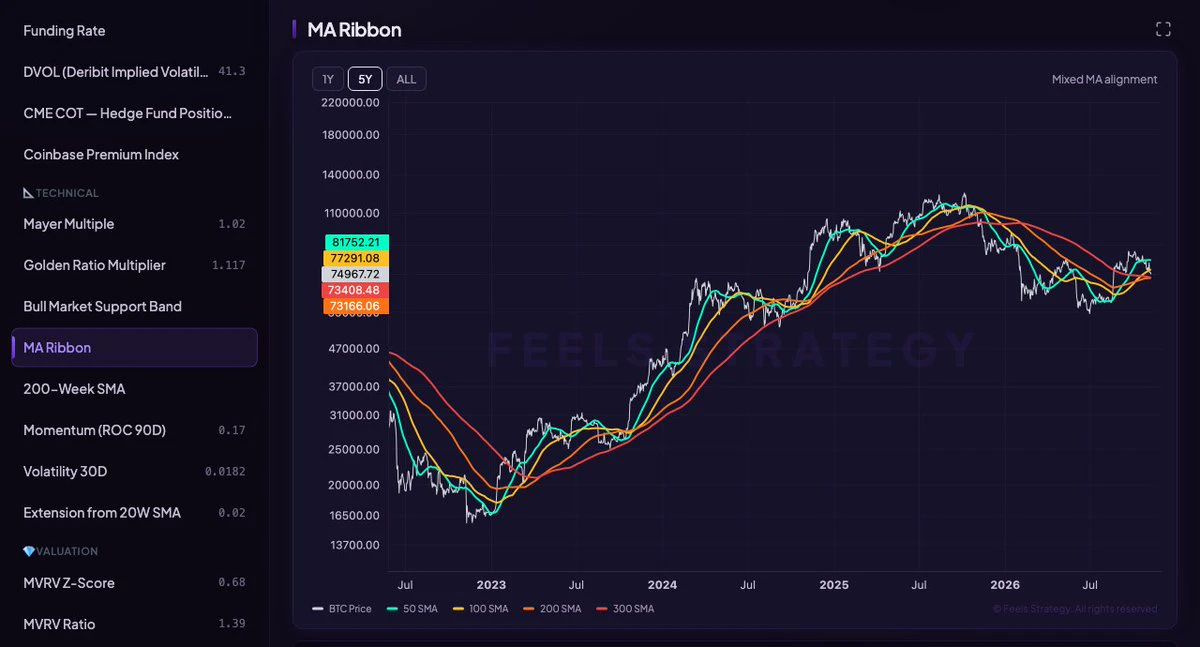
#Bitcoin MA Ribbon Alert ⚡️
📝 The MA Ribbon shows mixed alignment as key averages compress between ~$73K and ~$82K. $BTC is testing the 200/300 SMA support band near ~$73K.
📍 Overhead supply remains capped by the 100 SMA (~$77K) and 50 SMA (~$82K). Tight ribbon banding confirms late-stage distribution and liquidity consolidation.
💡 Severe compression historically precedes violent directional expansion. Losing ~$73K triggers lower discovery, while reclaiming ~$77K restores bullish momentum.
post-image
BTC-0.67%
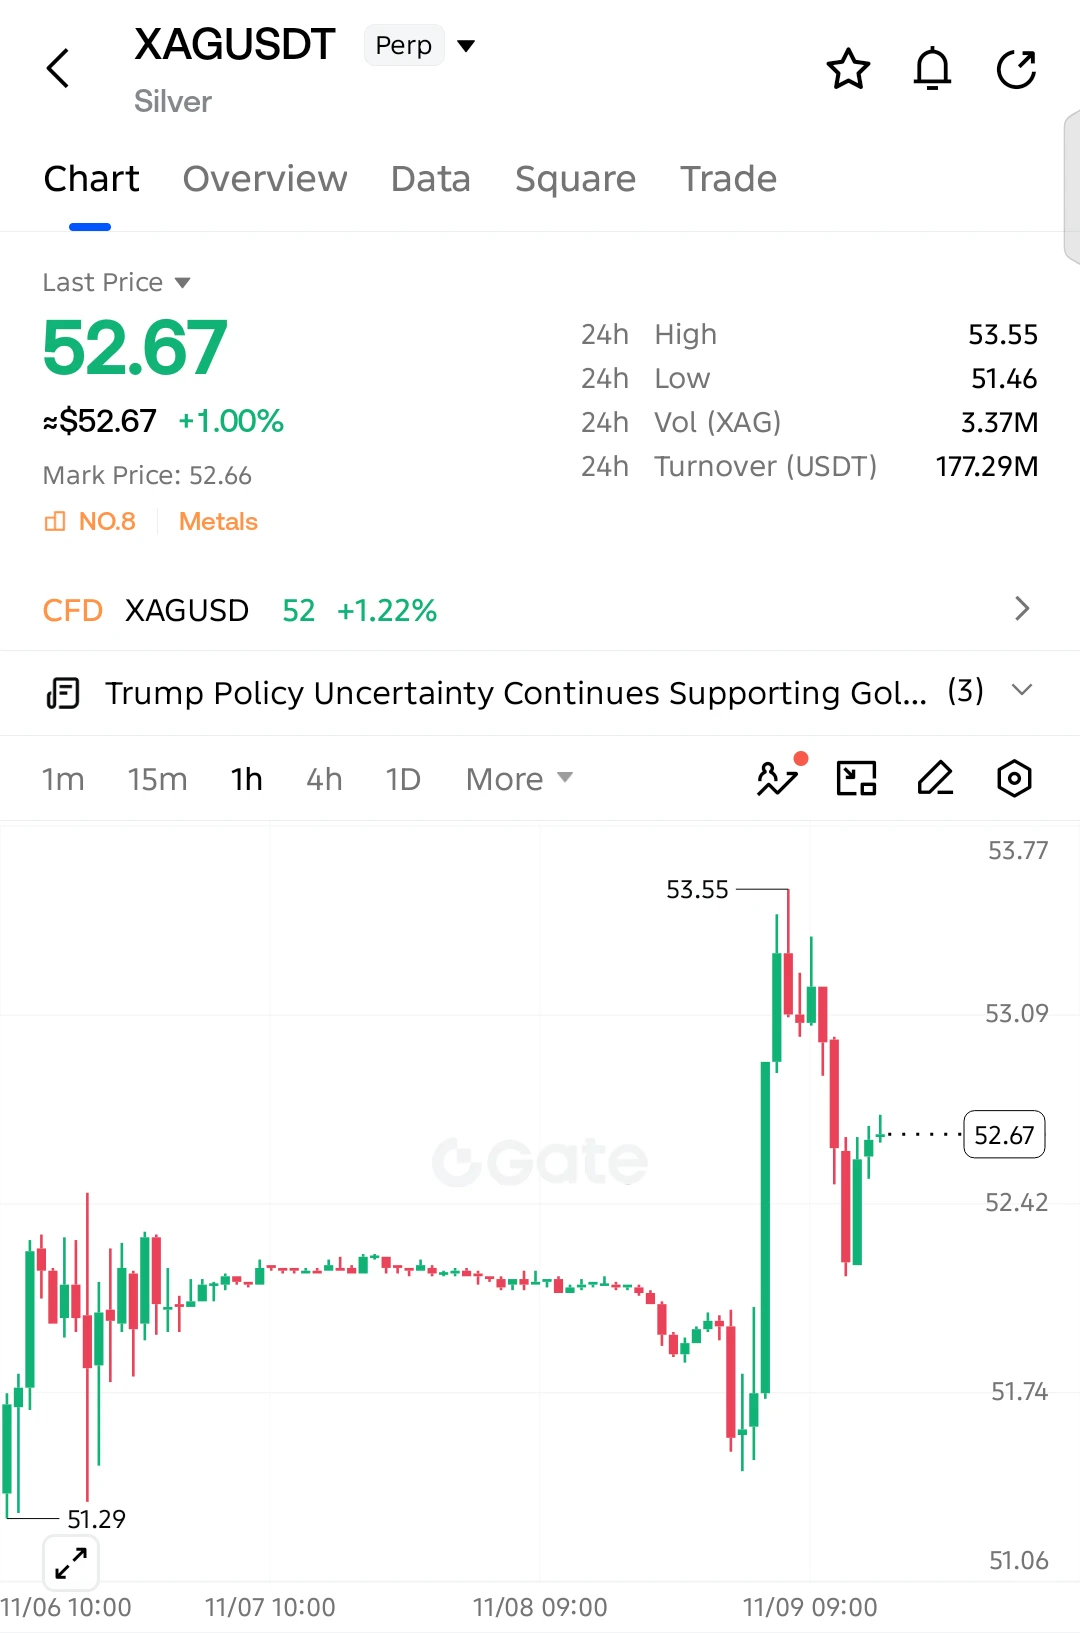
$XAG LONG SETUP — SILVER BUYERS FIGHTING BACK!

$XAG is up 1%, showing renewed buying interest after a sharp pullback from 53.55. Silver is recovering above 52.42, putting another upside move in focus!

Entry: 52.67
SL: 52.30

TP1: 53.09
TP2: 53.30
TP3: 53.55
Final Target: 53.77

Buyers have stepped back in after the recent sell-off, pushing silver higher from its intraday dip. If 52.42 holds as support and buying pressure continues, $XAG could challenge 53.09 and potentially retest 53.55.

Invalidation: A sustained break below 52.30 weakens the bullish setup.

Keep your eyes on $XAG. Bulls ar
post-image
XAG+0.47%
Late GM CT
What's the plan for this week?
post-image
Layout: Bitcoin, Ethereum, Dogecoin
live-cover
LIVE1,901
  • 1
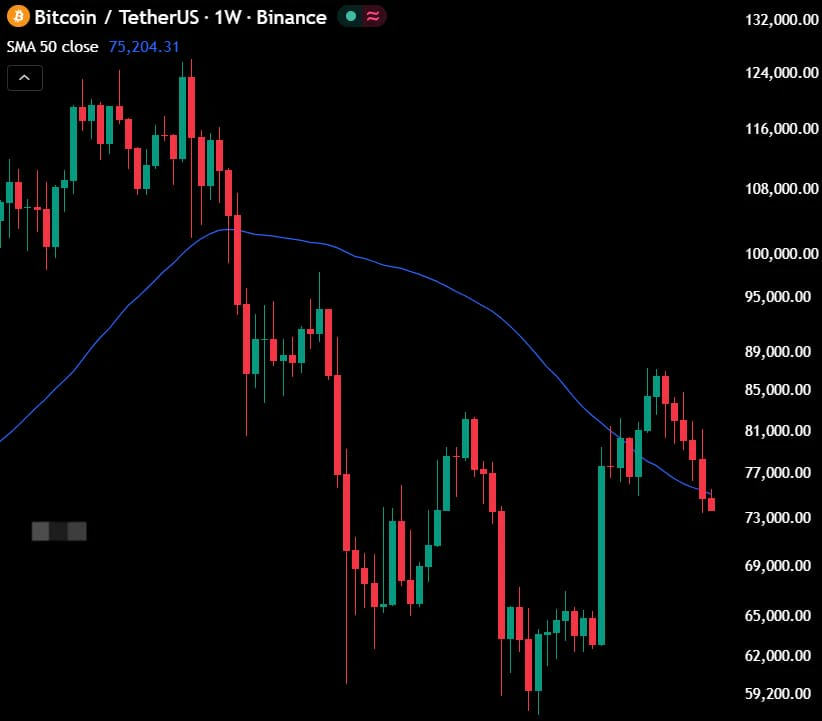
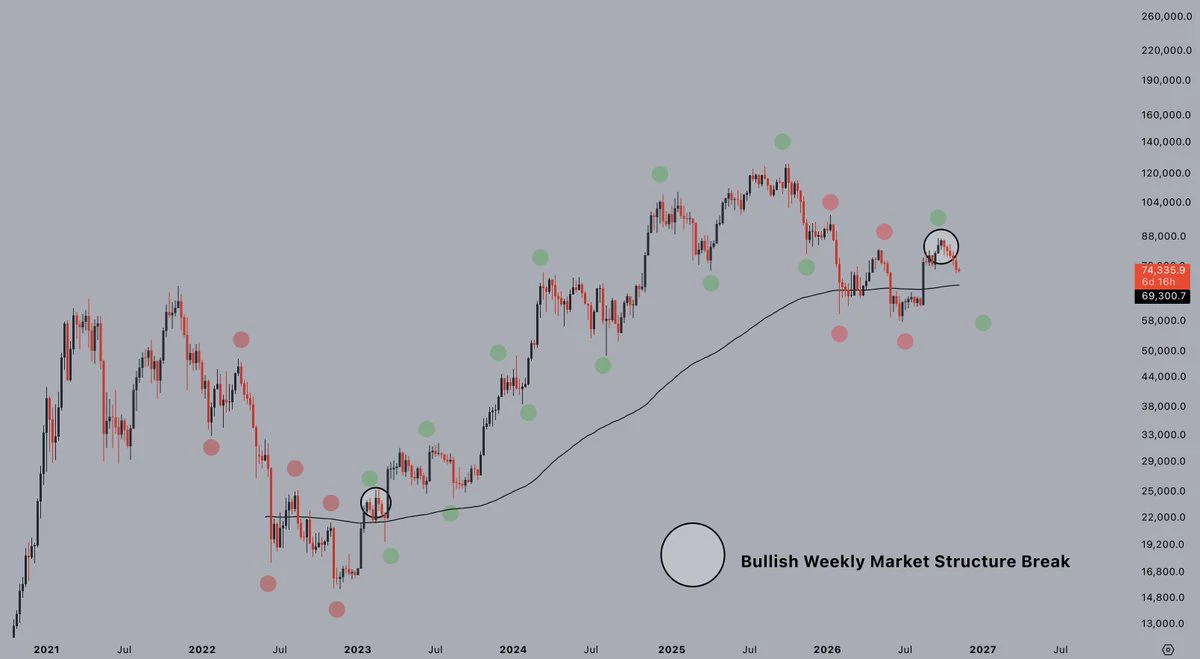
$BTC closed its 5th consecutive week in red and also lost the 50W MA.

If Bitcoin doesn't reclaim the 50W MA soon, it's highly likely BTC will drop to $70,000.
#BTCFlashCrash #ShareWeekly
post-image
BTC-0.67%
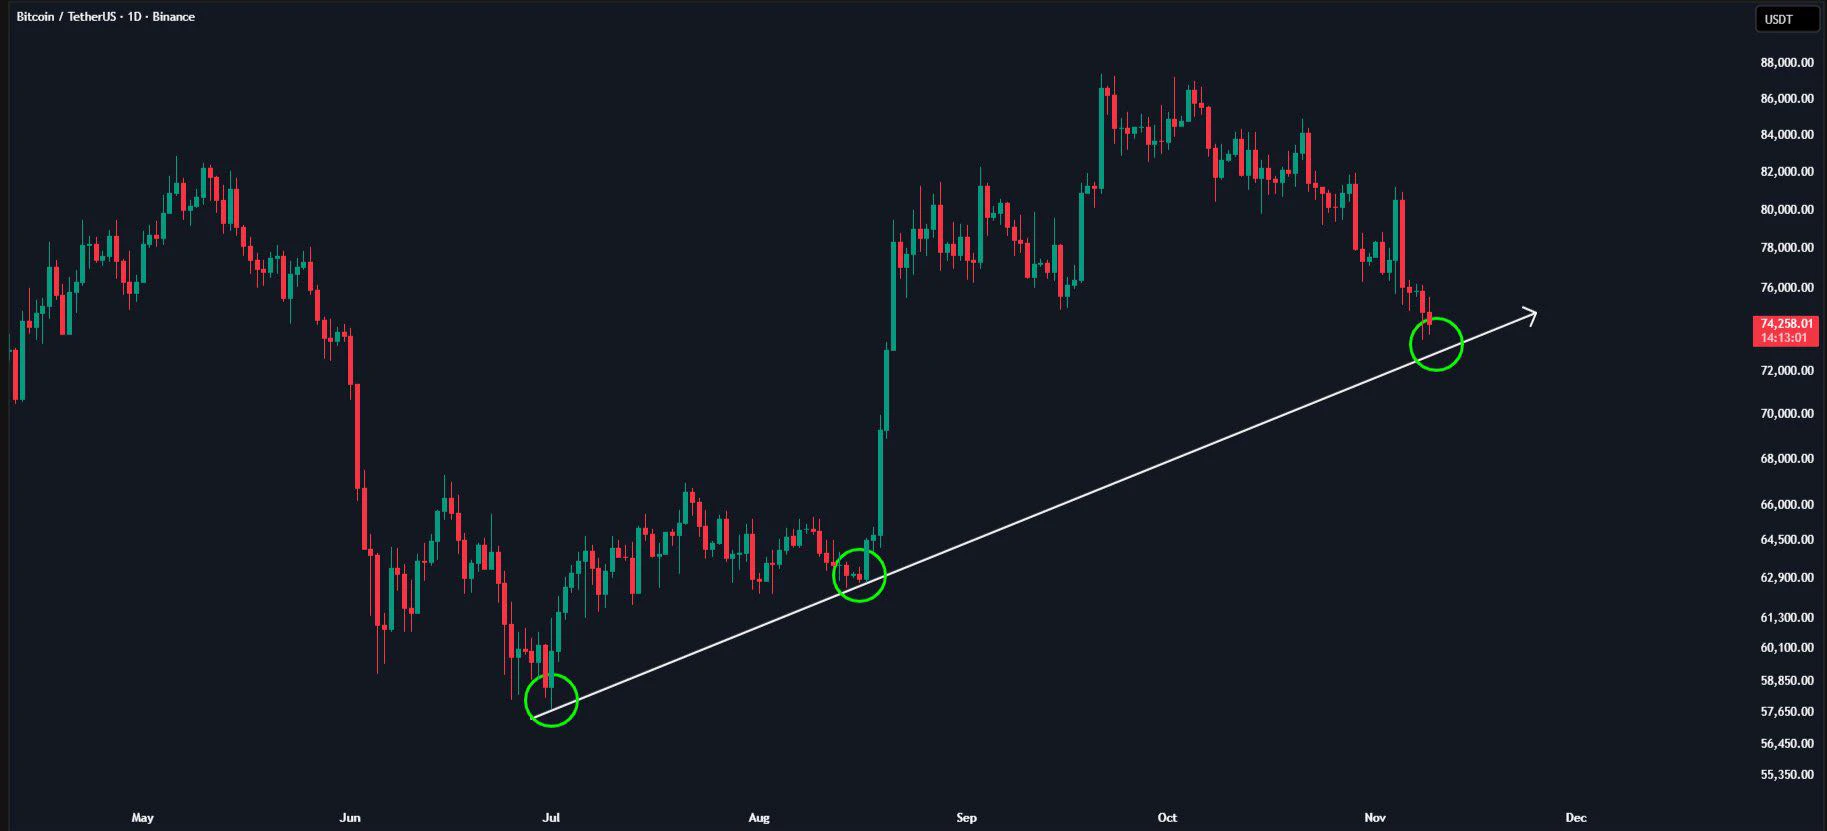
$BTC is testing its rising trendline for the third time.

The first two retests triggered strong bullish reactions, showing that buyers were actively defending this key support.

Now all eyes are on this third touch.

If buyers step in again, BTC could see another strong bounce and continue its upward move.

However, a confirmed breakdown below the trendline could change the short-term outlook.

The next move will be important. Watching how price reacts here.#RedBullDoublePodiumInBrazil #BTCFlashCrash
post-image
BTC-0.67%
Treasury yields are moving higher, so don’t rush to say the bad news is all priced in. Elevated yields mean financing costs are weighing on valuations. Tech stocks are the first to buckle, while gold could benefit. It’s that simple—make your own call. What about on your end?
post-image
GLDX-0.40%
PAXG+0.37%
XAU+0.38%
AI Stocks Plunge, but Tech Giants Say Demand Hasn’t Disappeared! Is This AI Sell-Off an Overreacti
live-cover
LIVE1,635
The food six other people eat in one meal is more than what my family of six eats in a year $PEPE
$ETH AI chip stocks plunge; Nasdaq falls 3.4% for the week; Jensen Huang apologizes for an affair, and Nvidia launches an independent investigation.
post-image
PEPE+0.97%
Yes, red candles are scary - but they're also needed to get us to that higher low we've been looking for.
It's pushing deeper than comfortable as per usual, but that doesn't mean it's going to zero.
Patience remains my game. The bull market will come.
$BTC
post-image
BTC-0.67%
The longer you watch the market, the more you realize that the hardest thing is often having your own view while still leaving a little room to revise it.

When prices move, it’s easy to feel like you need to do something right away. But sometimes, taking the time to think through why you’re making a move matters more than rushing to keep up.

🙅 Once you’ve thought it through, go eat first. Take a break from watching the charts at the table.

🍚 Today’s another day to eat until you’re nice and full!

‍#GateVIP
post-image
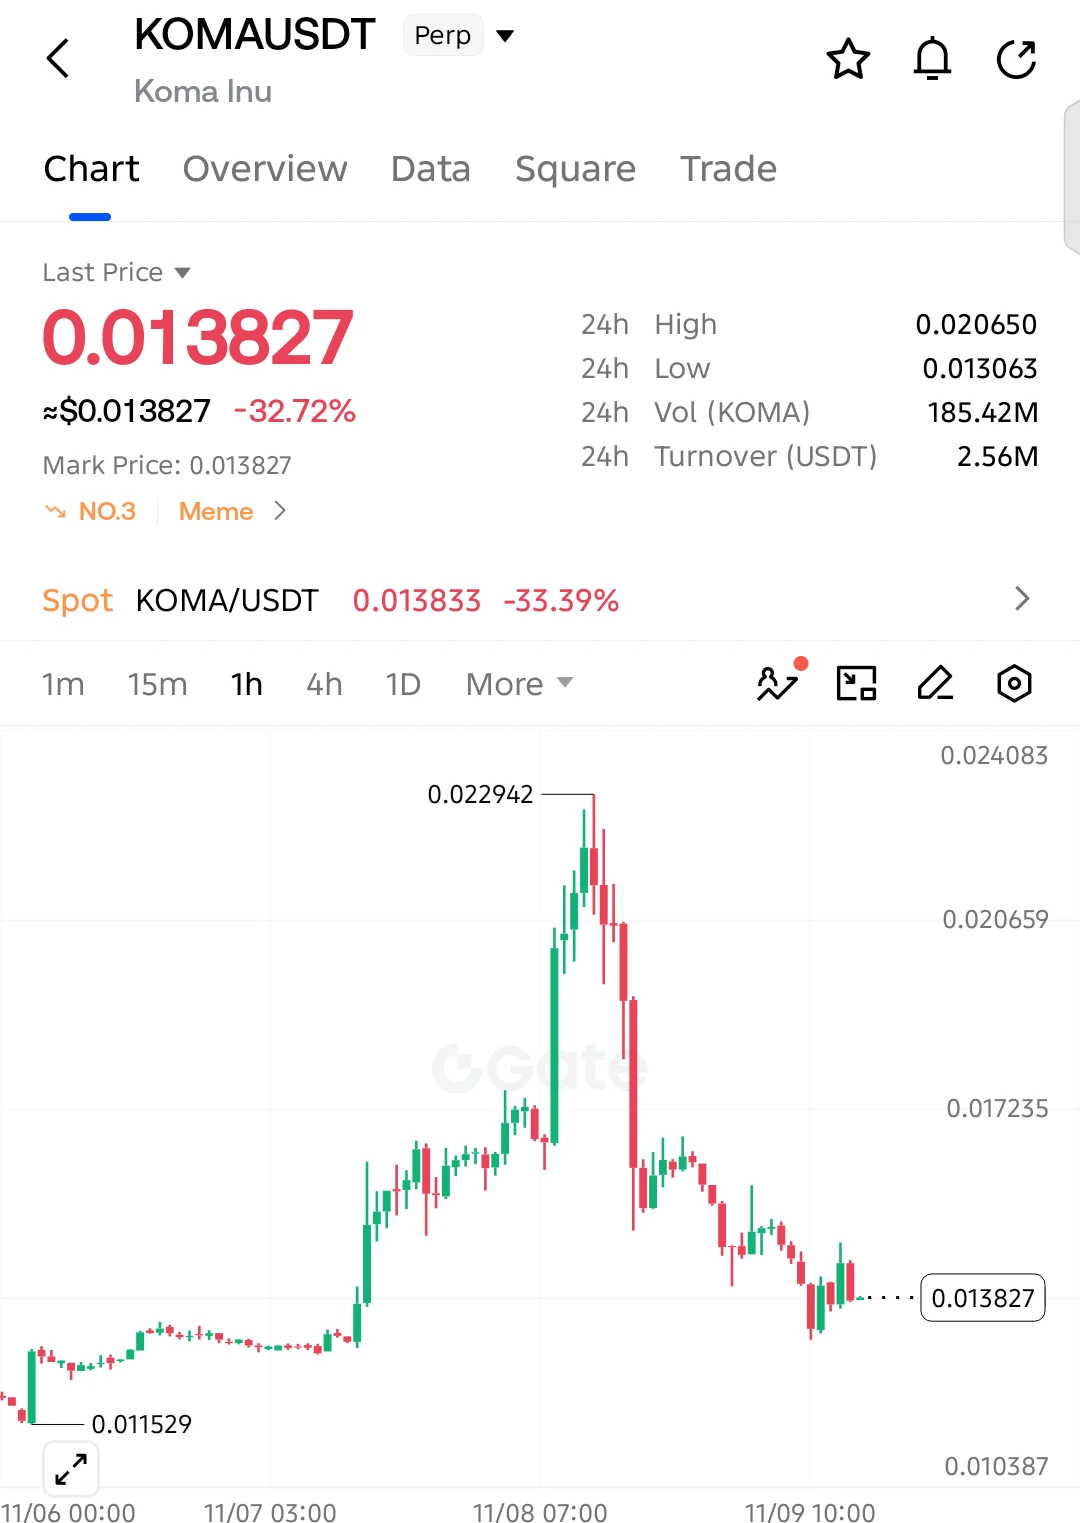
$KOMA SHORT SETUP — ANOTHER DROP COMING?

$KOMA has crashed 32.72% in 24 hours, and sellers are still dominating after the massive rejection from 0.022942!

Entry: 0.013827
SL: 0.014650

TP1: 0.013300
TP2: 0.013063
TP3: 0.012500
Final Target: 0.011529

$KOMA continues forming lower highs after its sharp selloff, showing that buyers are struggling to regain control. The price is now consolidating near support, and a breakdown below 0.013063 could trigger another wave of selling toward 0.012500 and potentially 0.011529.

Invalidation: Sustained recovery above 0.014650.

Watch $KOMA closely. The
post-image
KOMA-3.91%
Load More

Join 40 M users in our growing community

⚡️ Join 40 M users in the crypto craze discussion

💬 Engage with your favorite top creators

👍 See what interests you

Trending Topics

USCPIDataIncoming

31.91k Views1.9k Discussing

The U.S. October CPI report will be released on November 10 at 8:30 a.m. ET. September CPI came in at 3.7% year over year, and markets will be watching closely for signs that inflation is cooling, especially in core CPI. A softer-than-expected reading could strengthen rate-cut expectations, while hotter inflation may pressure risk assets through higher Treasury yields and a stronger dollar. How do you think this CPI print will move $BTC, U.S. stocks and gold?

RedBullDoublePodiumInBrazil

3.36k Views30.54k Discussing

BTCFlashCrash

111.81k Views66.33k Discussing

View More