Square
Following
Hot
News
Profile
Share your thoughts
placeholder
Article
The market has risen as expected; my prediction is that this is the final rally📈, with a high between 83600-84080. After that, get ready for a major crash—a black swan
Get in quickly, you damn market makers, keep it up, keep it up
post-image
  • 4
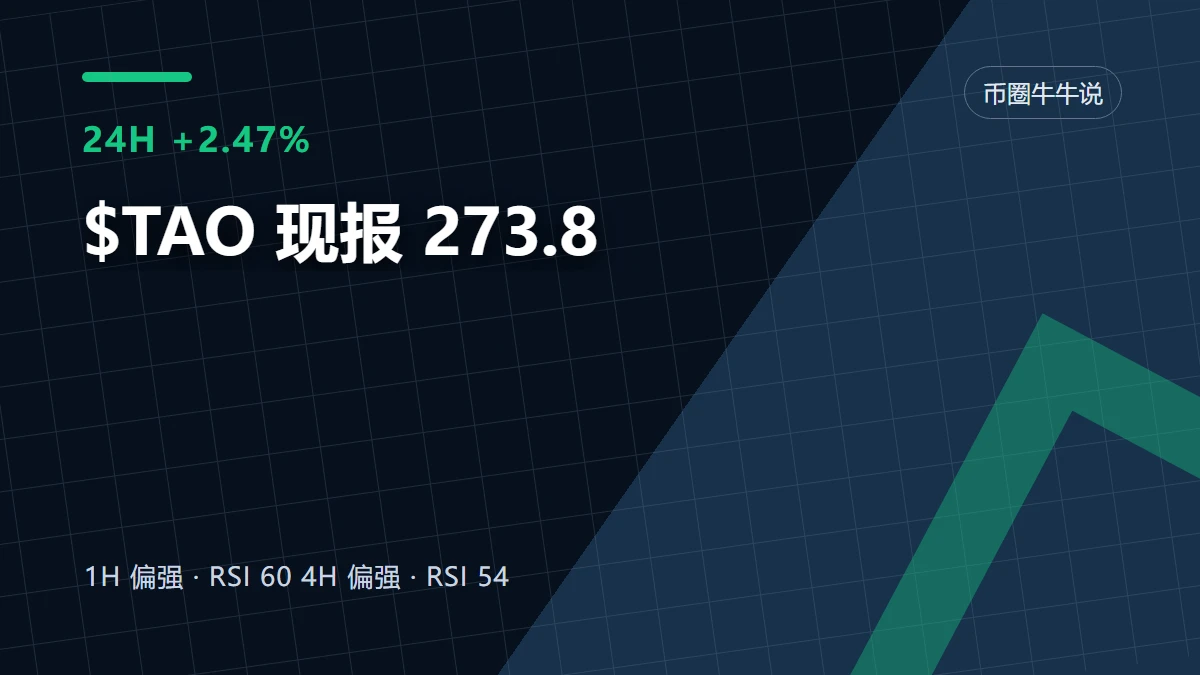
$TAO has risen from 261.9 to 273.8, up 2.47% over 24 hours, but 1-hour trading participation is only 0.30x, indicating insufficient volume. This makes me more inclined to believe this breakout may be just a short-lived technical rebound rather than a trend-driven rally. On the 1-hour chart, price is already nearing resistance at 278.5, but volume has not noticeably followed, making it more likely that this move will quickly lose momentum.
The real opportunities worth watching are either holding above 278.5 with follow-through, or quickly reclaiming 261.9 after a pullback. If 261.9 breaks and i
post-image
TAO+2.61%
Trenches
Pokémon
P
bade
b
Pokémon
D42T...Xvb1
Market Cap
$.
Change
.
24h Vol
$.
Holders
.
AGT
A
bade
b
AGT
0x5d...e274
Market Cap
$.
Change
.
24h Vol
$.
Holders
.
Dacity
D
bade
b
Dacity
nxPq...pump
Market Cap
$.
Change
.
24h Vol
$.
Holders
.
COLLECTOOOR
C
bade
b
COLLECTOOOR
ESnW...pump
Market Cap
$.
Change
.
24h Vol
$.
Holders
.
STONK
S
bade
b
STONK
6GmA...UNgx
Market Cap
$.
Change
.
24h Vol
$.
Holders
.
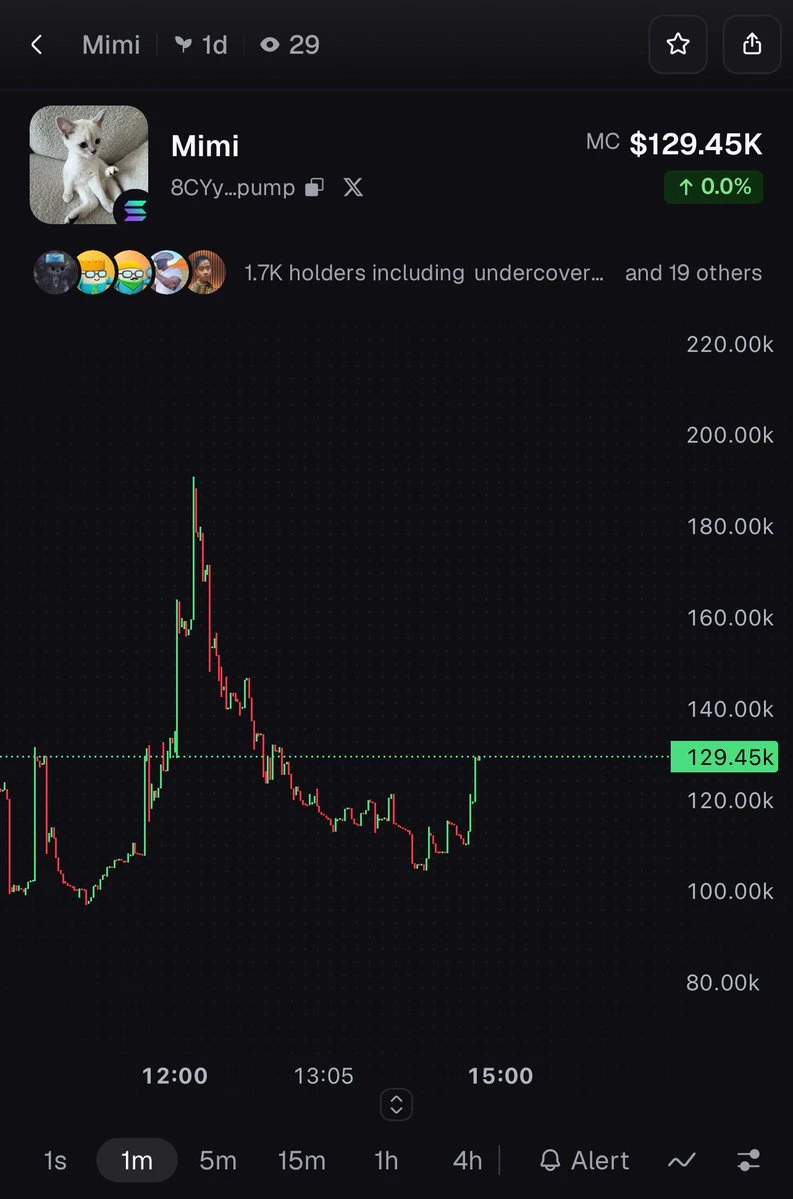
solana:8CYyivwMZPg6Edaofxo3eHiveZkDrU6TtUDwtMjTpump cat😻
8CYyivwMZPg6Edaofxo3eHiveZkDrU6TtUDwtMjTpump
#crypto $sol
post-image
SOL+1.80%
Dim777 & BTC & LTC & GT
post-image
Dim777
Dim777Dimzon777
Gate.Fun
MC:$84.43KHolders:8
100%
BTC+0.79%
LTC+1.08%
GT+1.90%
  • 7
DOT is testing local support amid a macro uptrend; dip buyers are adding to their positions, waiting for a rebound. Open a long position on $DO .
Entry range: 1.1530 - 1.1588 Target 1: 1.2118 Target 2: 1.2565 Exit if the call is wrong: 1.1184 You can trade here. For further updates, follow $JC and $ETH .
post-image
ETH+1.51%
$BMT USDT bullish momentum strengthens, with buyers targeting $0.02200 and higher
Trading Strategy: Long Entry Range: $0.0200–$0.0205 Take Profit 1: $0.0210 Take Profit 2: $0.0220 Take Profit 3: $0.0230 Stop Loss: $0.0192 Market Outlook: BMTUSDT continues to show strong bullish momentum after decisively breaking above the $0.0170–$0.0180 consolidation range. A confirmed breakout above $0.0220 could trigger another rally, while a drop below $0.0200 could lead to a short-term pullback. Trade on $BMT
post-image
BMT+15.95%
Analysis new crypto coin
live-cover
LIVE1,445
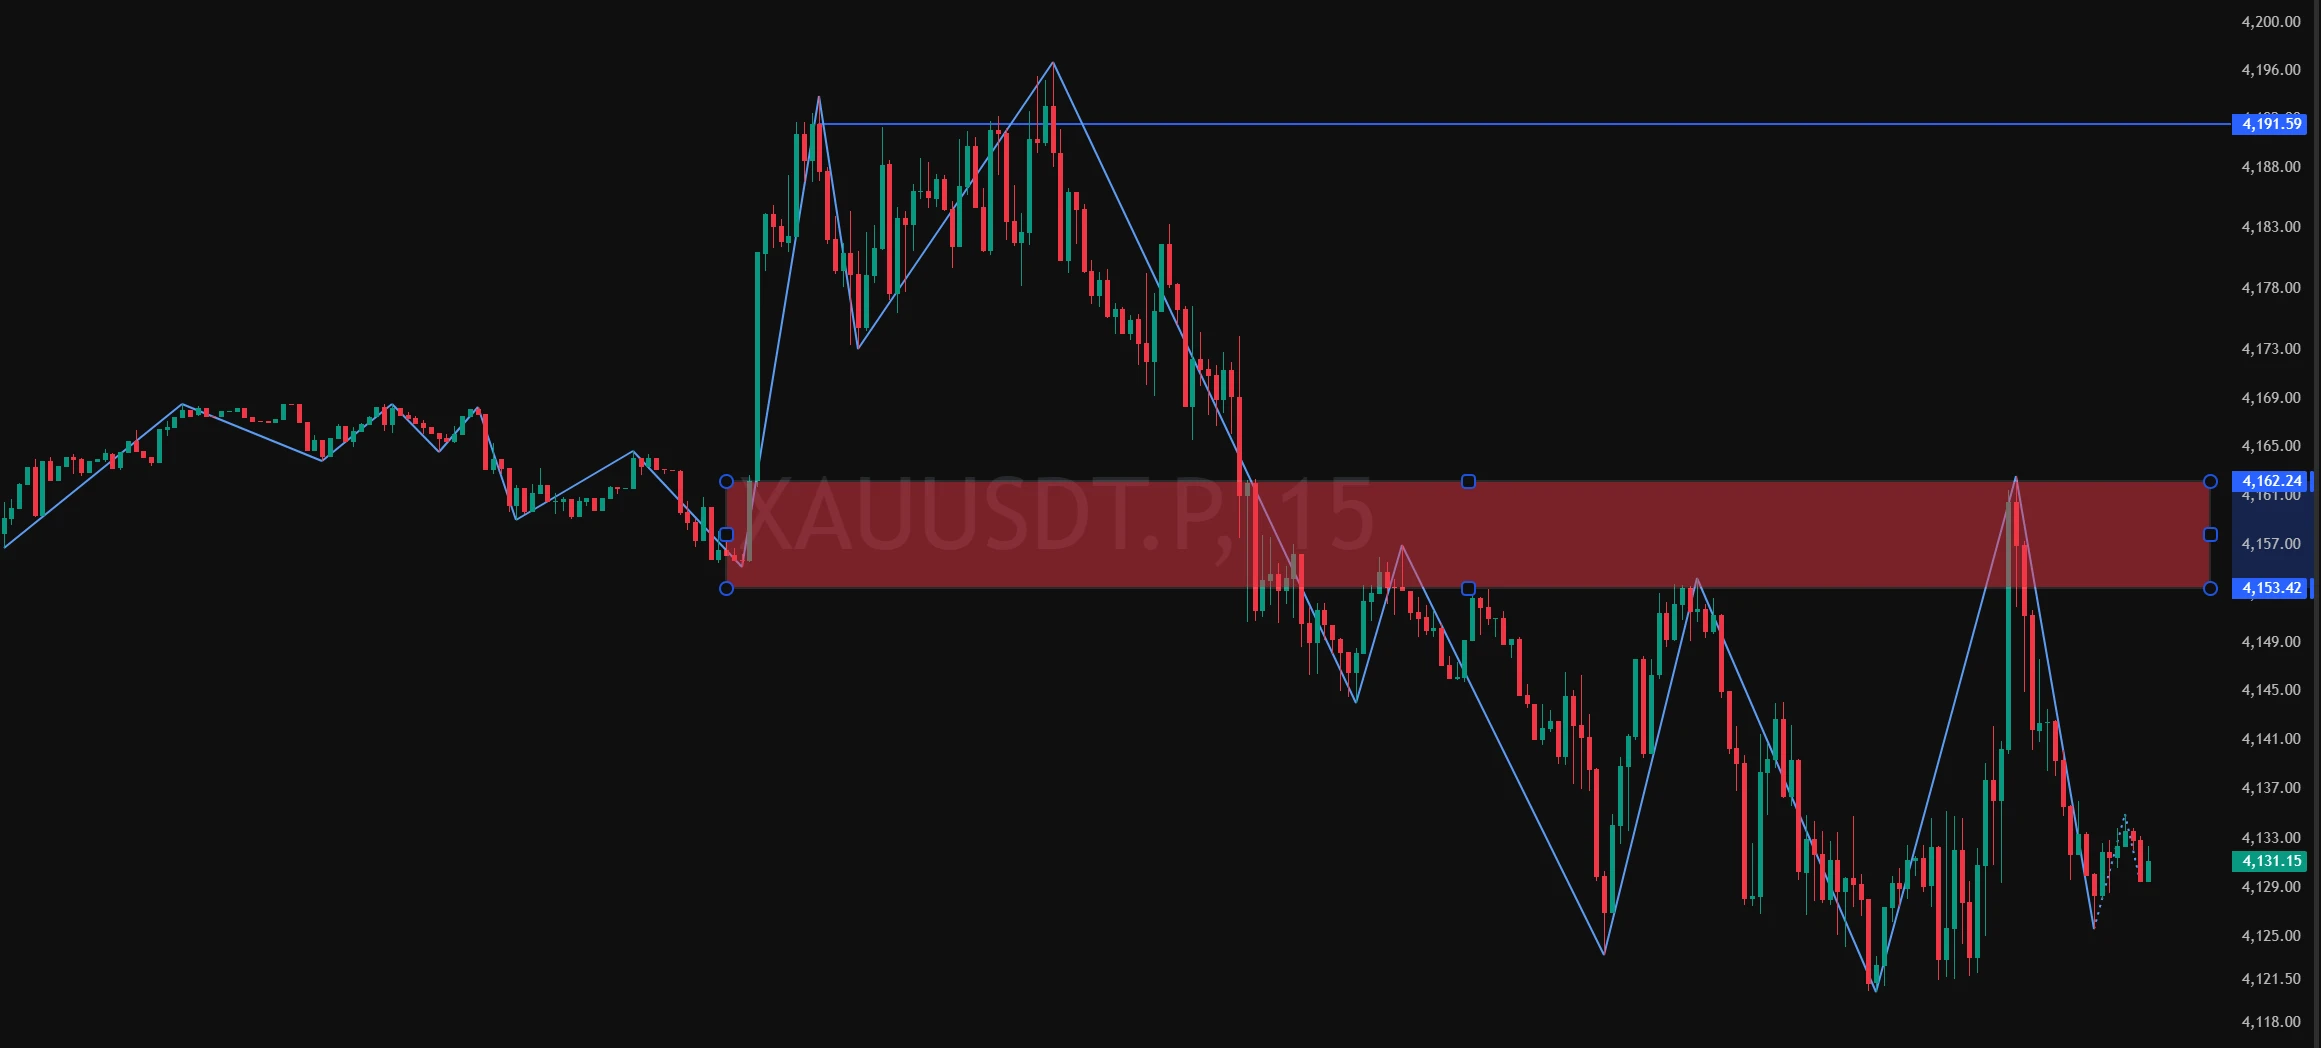
10/20 Market Update Verification:
The bearish zone for gold given during the evening livestream was 4150-4160. The current bearish trend is still not over! $XAU
post-image
XAU-0.50%
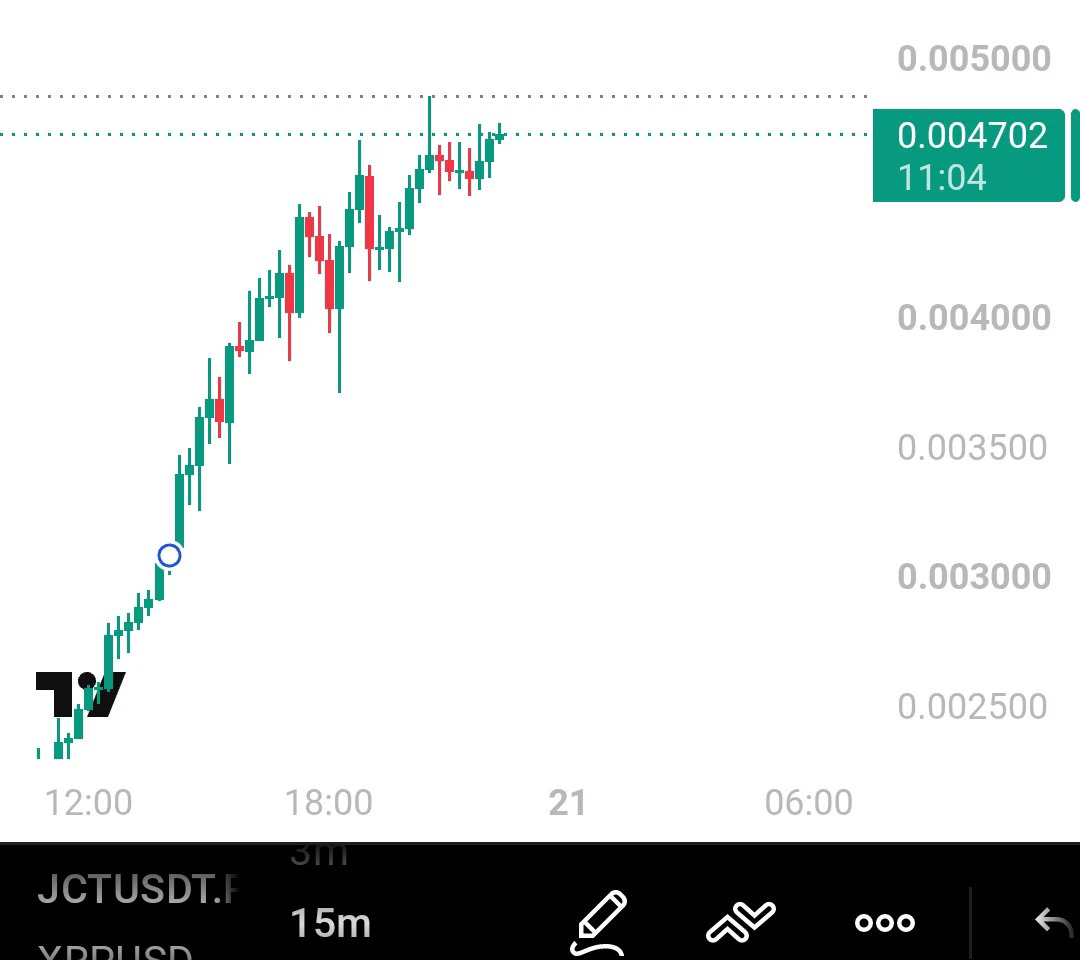
I have so much blind confidence in my strategy that even if we start taking positions at $JCT current price, using a 2% SL, 6–7% TP, and combining it with my re-entry strategy, we can get into profit.
You have no idea what I’m about to bring to the table.
I’m going to make trading easier to learn. It won’t take years to become a trader. I’ll help you develop trading skills in months, maybe even days.
This is what I’m preparing to leave behind for you all. 🐂
post-image
JCT+138.93%
$ENA 's direction looks clear, but volume hasn't weighed in
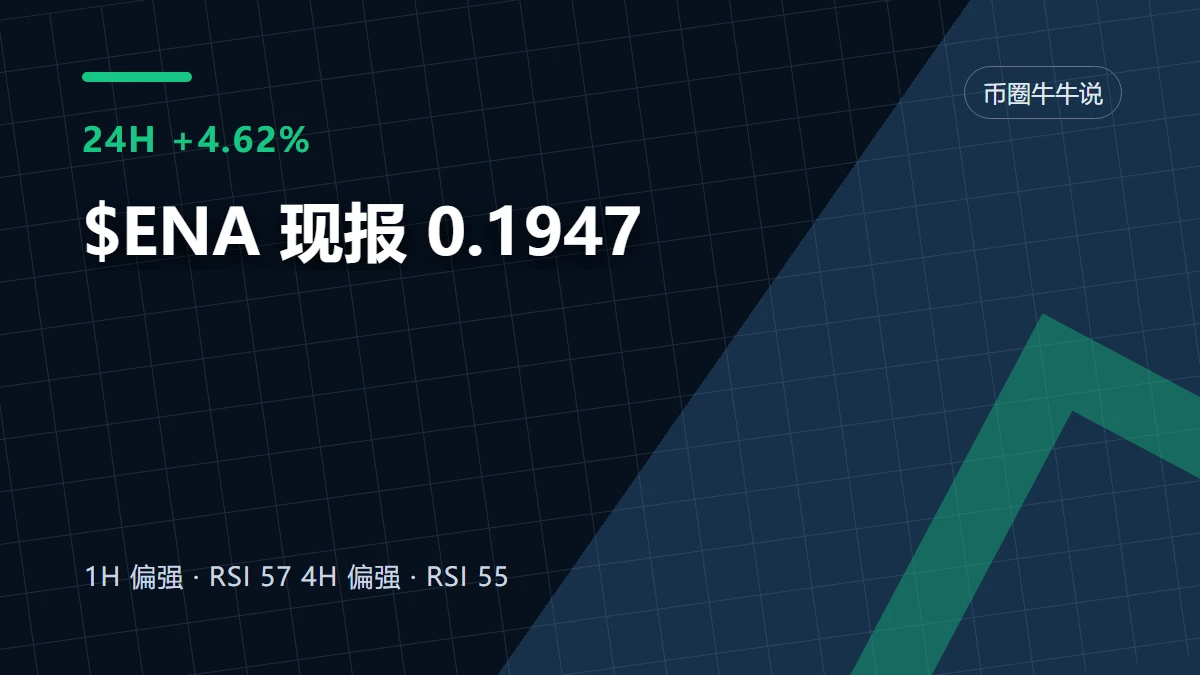
$ENA There is a very typical debate right now: one side points to the 24-hour +4.62% to prove the direction, while the other counters with key levels. I’m not taking sides based on the price change for now, because although the $ENA price has already moved, trading activity and volume have yet to follow and provide a complete answer. The direction may be credible for now, but its continuation cannot be taken for granted; a move without follow-through can be reversed at any time.
My view is that the direction is there for now, but low p
post-image
ENA+3.31%
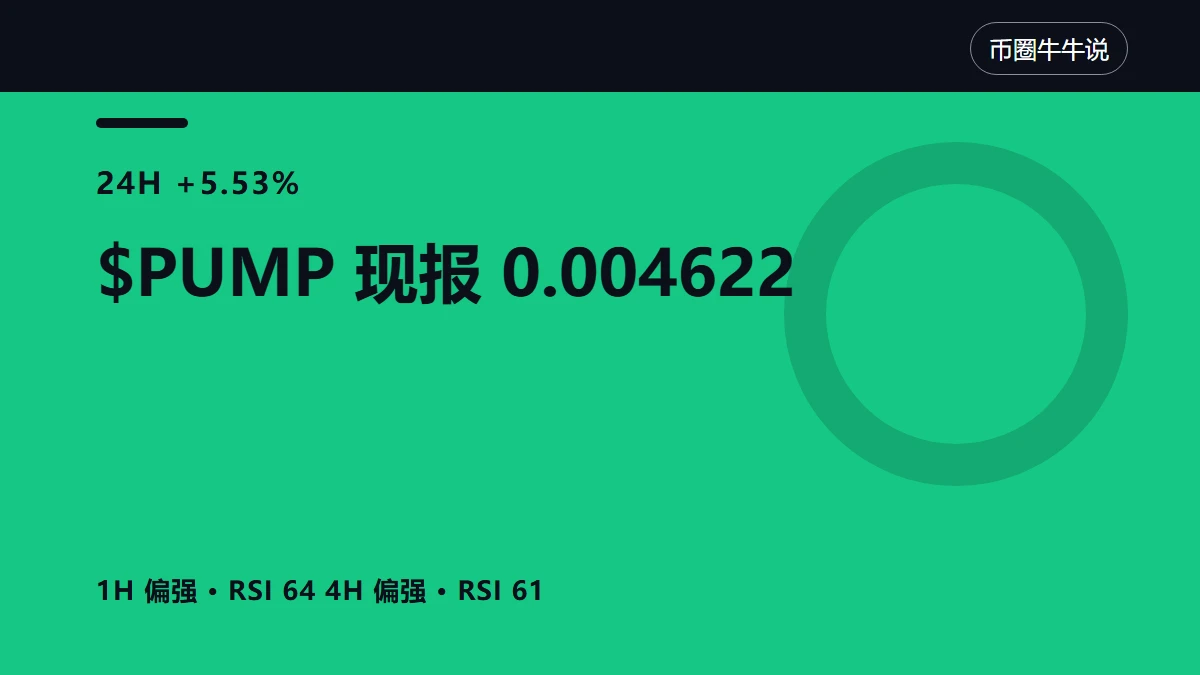
$PUMP price has already moved, so why hasn't volume caught up?
Today $PUMP is at 0.004622, up 5.53% over 24 hours, but trading volume and activity are clearly below average. The direction can be trusted for now, but don't assume it will continue; moves without follow-through can be reversed at any time.
My view: the direction is there for now, but low participation has reduced the credibility of this move.
Price-volume confirmation is an important standard for judging whether a market move will continue. When the price has moved but volume is clearly below average, the continuation of either
post-image
PUMP+5.60%
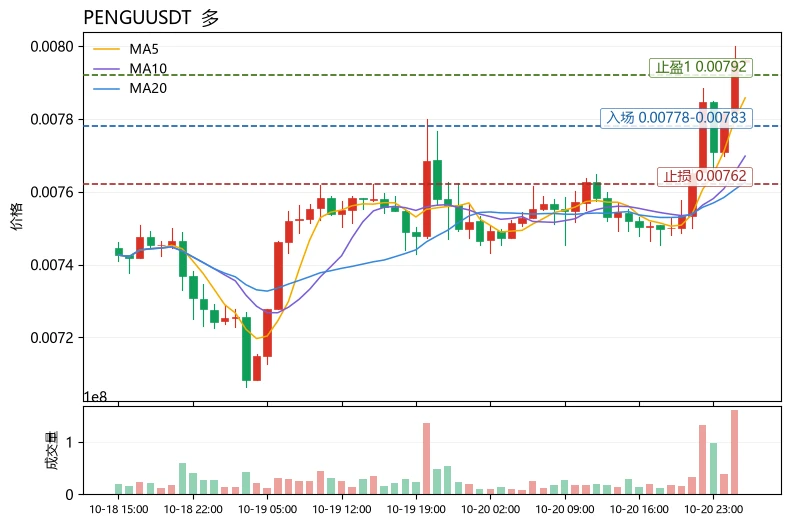
$PENGU The current price has reached just below the upper Bollinger Band at 0.00791994. RSI at 71.3 has entered overbought territory, while the funding rate is only +0.0010%—the price is making new highs, yet no one is willing to pay a premium to go long. This is the most unusual detail in today’s market, suggesting the rally is driven by spot buying while futures traders are reluctant to chase. Once spot buying dries up, a pullback could come quickly.
I’m still bullish, but I wouldn’t chase. MA5 has crossed above MA20 and the MACD histogram is positive, so the trend structure remains intact;
post-image
AVA-16.51%
INJ-0.33%
Daily market brief · BTC/ETH key bull-bear levels at a glance
live-cover
LIVE2,361
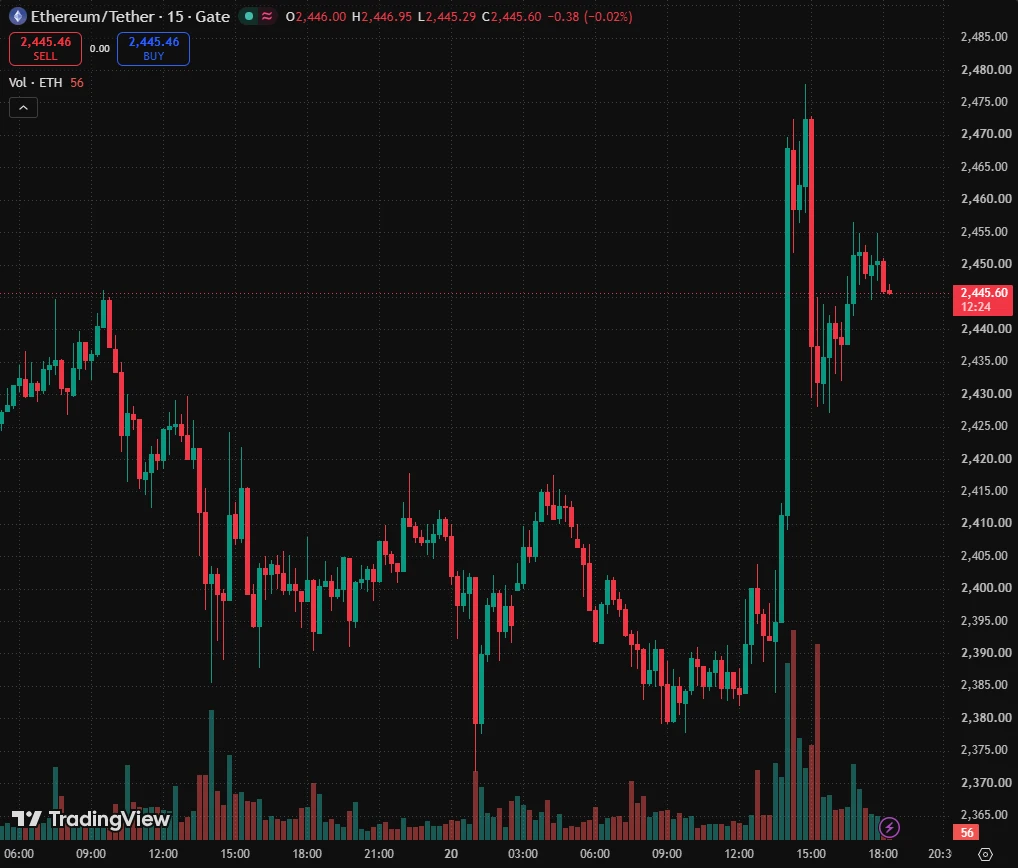
$ETH ETHUSD 15M | Supply Zone Rejection Watching For Lower Levels
ETHUSD is currently reacting from a significant supply zone after a strong impulsive move higher.
Price has revisited the highlighted resistance area near 2450-2475, where sellers have previously shown interest. As long as this zone continues to hold, the short-term structure may favor a move toward lower liquidity levels.
Key levels I'm watching:
Target 1: 2427
Target 2: 2412
Target 3: 2390
The idea is based on supply-demand dynamics and resistance holding on the 15-minute timeframe. A strong acceptance above the highlighte
post-image
ETH+1.52%
$BTC What Happens If Corporate Buying Slows?
12 companies reportedly following Strategy’s Bitcoin treasury model sold BTC, raising questions about sustained corporate demand.
The key risk isn’t selling alone — it’s whether other buyers can absorb the supply.
If treasury costs pressure these firms to slow accumulation, Bitcoin may lose part of its buying support.
The signal to watch: sustained demand, not headlines.
Is this a temporary shift or a warning sign for $BTC?
#Bitcoin #BTC #Crypto
post-image
BTC+0.79%
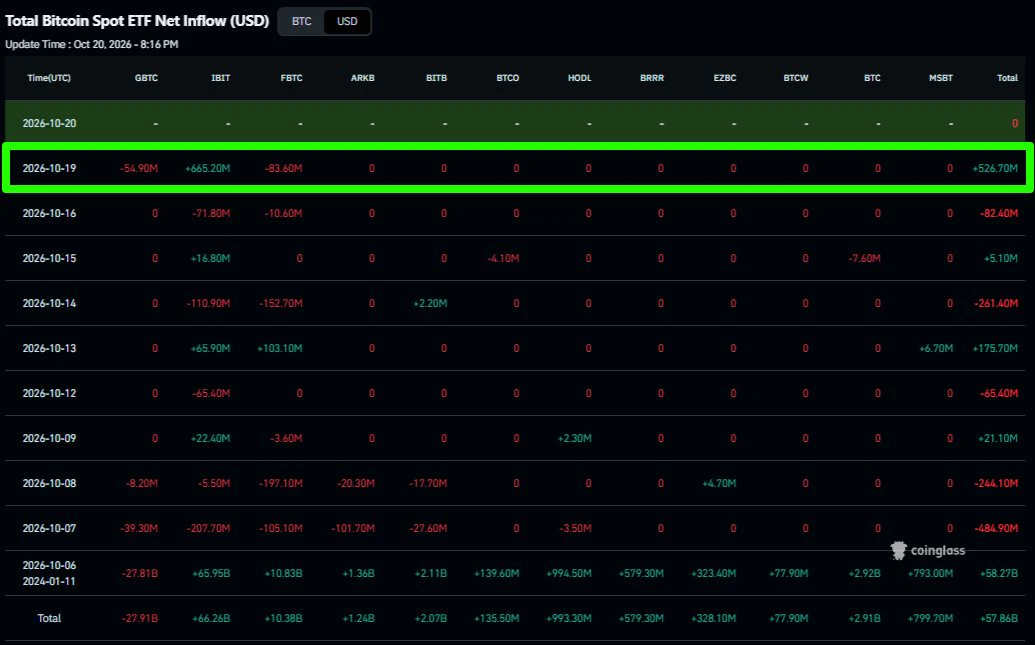
$BTC spot ETFs just recorded $527M in net inflows, led by $665M into $IBIT.
A strong reversal after weeks of outflows, with Bitcoin holding the $80K–$83K support zone.
post-image
BTC+0.74%
Deploy Claude on Polymarket, disable unnecessary permissions, and let the bot run everything automatically.
The approach is straightforward: in each 5-minute Bitcoin market, buy both sides simultaneously at 49 cents for the up side and 49 cents for the down side.
Simply put: buy a pair for 98 cents, and it ultimately pays out $1.
Account:
From mid-July to now, this strategy has run through more than 26k markets. It does not predict the direction and does not actively sell positions.
It was profitable on 91 of 92 days. The worst single-day loss was $247, while the best single-day gain was over
post-image
BTC+0.76%
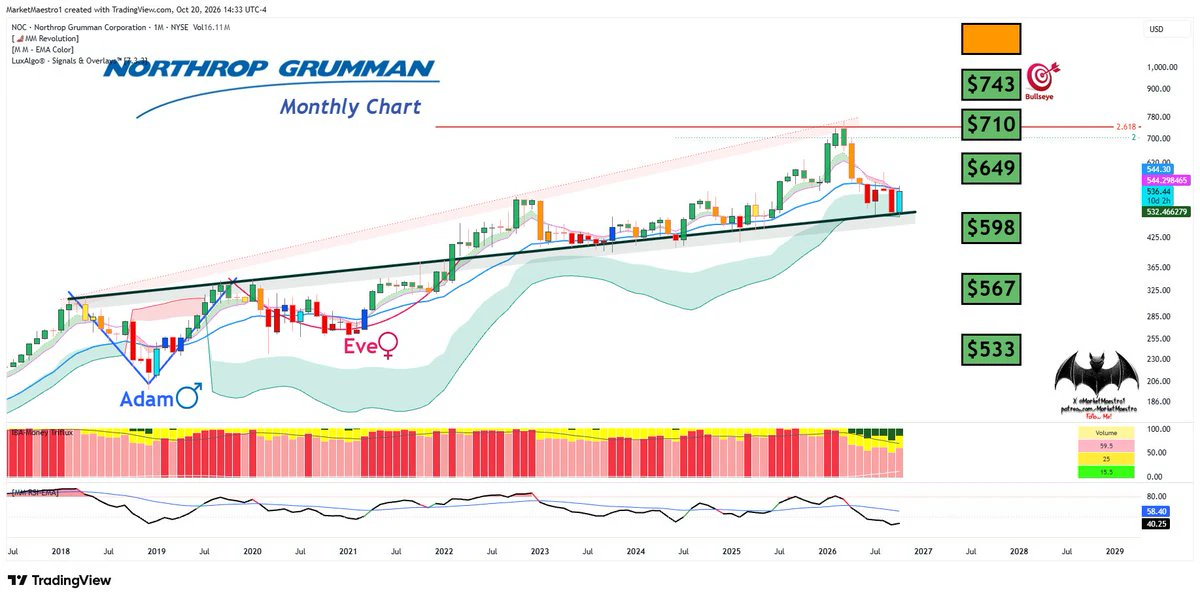
$NOC appears to have found a bottom
post-image
NOC+4.39%
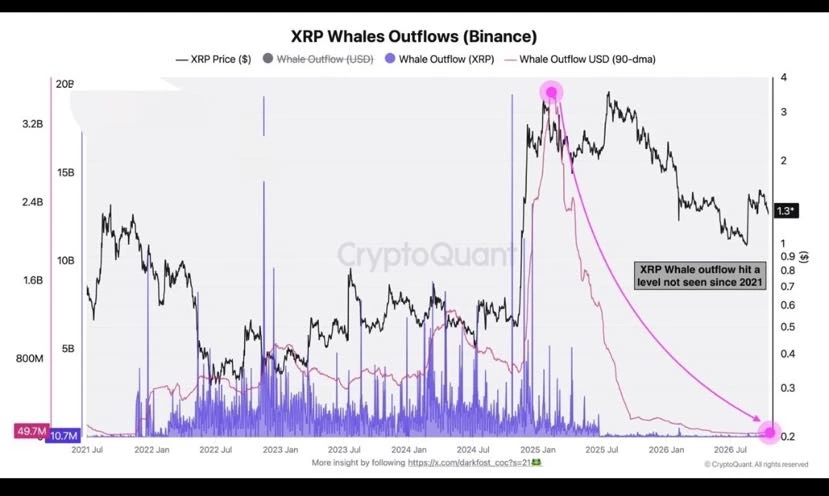
🐋 Whales have stopped accumulating Ripple #XRP – waiting for lower prices🤔
post-image
XRP+1.68%
$PI Haha, V30 is here, old iron gates,,,
PI+1.11%
Load More

Join 40 M users in our growing community

⚡️ Join 40 M users in the crypto craze discussion

💬 Engage with your favorite top creators

👍 See what interests you

Trending Topics

GateRanks2ndIn30DayNetInflows

4.46k Views765 Discussing

According to DefiLlama, Gate recorded over $199 million in net inflow over the past 30 days, ranking second among global centralized exchanges. Capital keeps flowing in — what's your strategy? [👉 Read more](https://www.odaily.news/en/newsflash/525820)

GateIdleFundsSurpass$300M

6.2k Views1.46k Discussing

TeslaQ3EarningsPreview

2.75k Views204 Discussing
View More