Square
Following
Hot
News
Profile
Share your thoughts
placeholder
Article
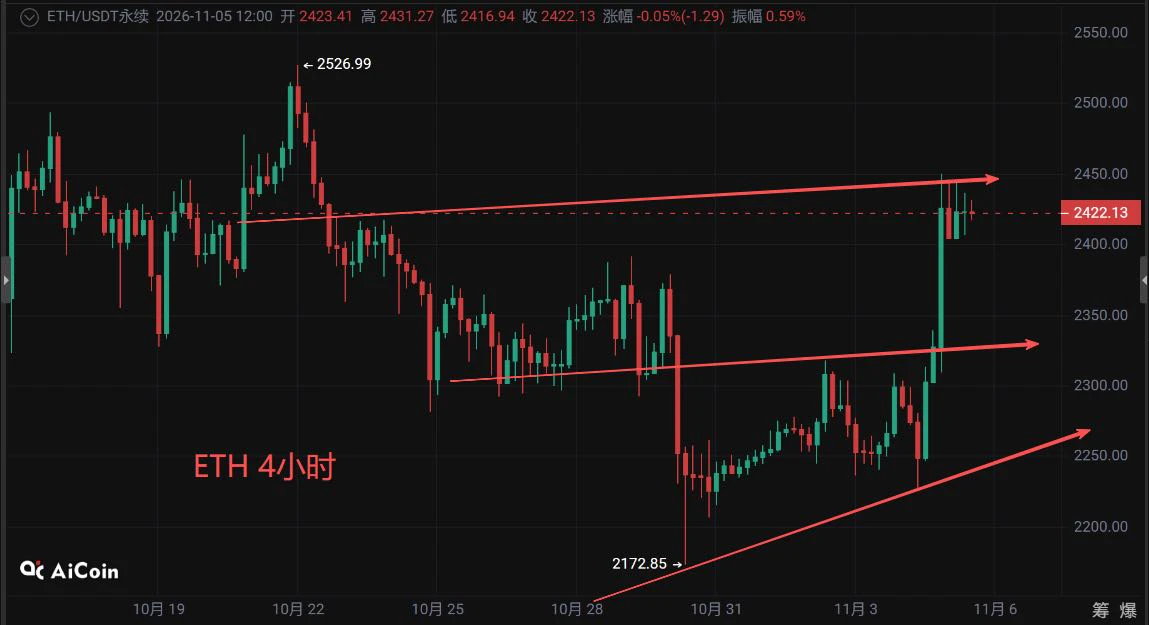
November 5 $ETH Market Update
ETH’s rebound has been somewhat stronger than expected.
On the 4-hour chart, ETH has rebounded steadily from around 2172. It was capped near 2300 several times before, but this time it surged on heavy volume, reaching a high of 2449.
It is now consolidating around 2420, and I think the short-term structure has improved significantly. The most important thing next is whether it can break through 2450.
If it holds above that level, the next targets could be 2500–2525; for now, watch whether 2400 holds.
Democrats won both chambers of Congress, and the market had ini
post-image
SevenSevenSeven
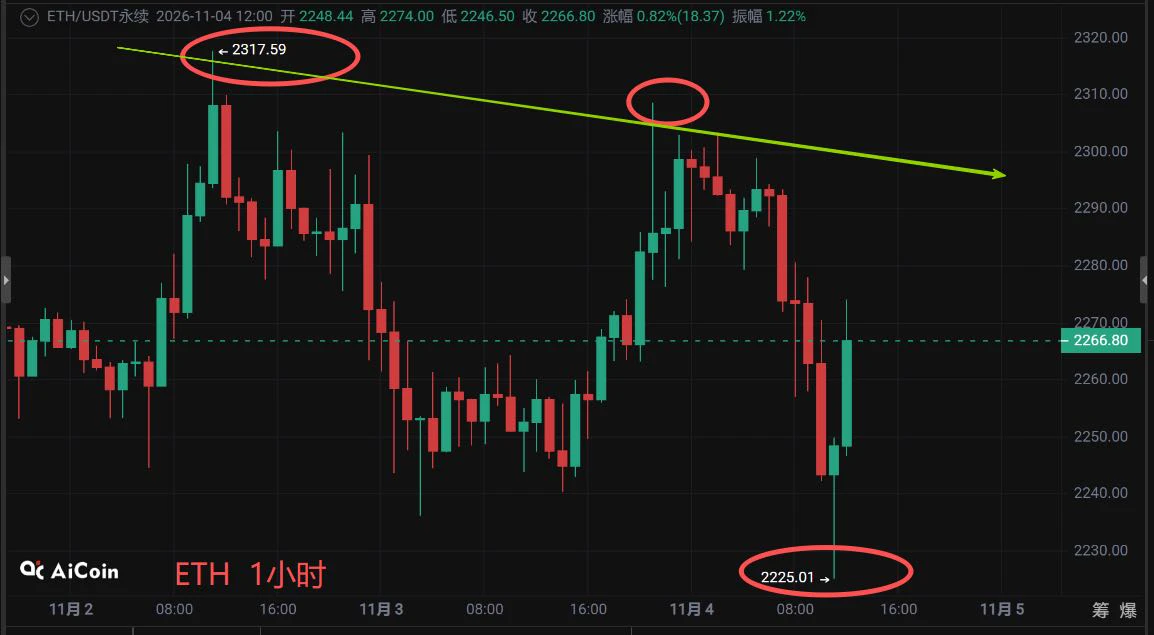
November 4 $ETH Market Update
Yesterday, we advised watching support around 2220. This morning, the price fell to a low of 2225, close to that support, then rebounded to around 2266, but the market has yet to stabilize.
On the 1-hour timeframe, clear resistance formed around 2318. A second rebound to around 2310 failed to break through, with heavy selling pressure overhead. Although the price is rebounding now, the highs continue to move lower, and the short-term trend has not strengthened.
Preliminary results from the U.S. midterm elections have also put some pressure on the market. Democrats made gains in several key districts, but control of both chambers remains to be confirmed. BTC also fell to around 75700, and overall market sentiment is cautious.
Liquidation data shows ETH has broken above $2,359, with cumulative short liquidation intensity across major CEXs at about $776 million;
If it falls below $2,136, long liquidation intensity would be about $381 million. These are estimates only and do not mean the price will necessarily reach that level.
Trading advice: The key short-term support zone is 2220-2230. Holding above it keeps the rebound outlook intact; if it breaks, the price may retest around 2170 or continue falling.
The short-term upside target is 2280, with strong resistance in the 2300-2318 zone. Stay cautious and do not chase longs before a decisive break above resistance.
Those holding low-entry long positions can continue to hold and monitor the market, reducing positions as appropriate if the price rebounds into the resistance zone;
Those who have not entered should wait patiently for the price to stabilize after a retest or for a breakout above resistance before taking action.
#BTC打破历届中期选举前看跌走势
repost-content-media
ETH-1.23%
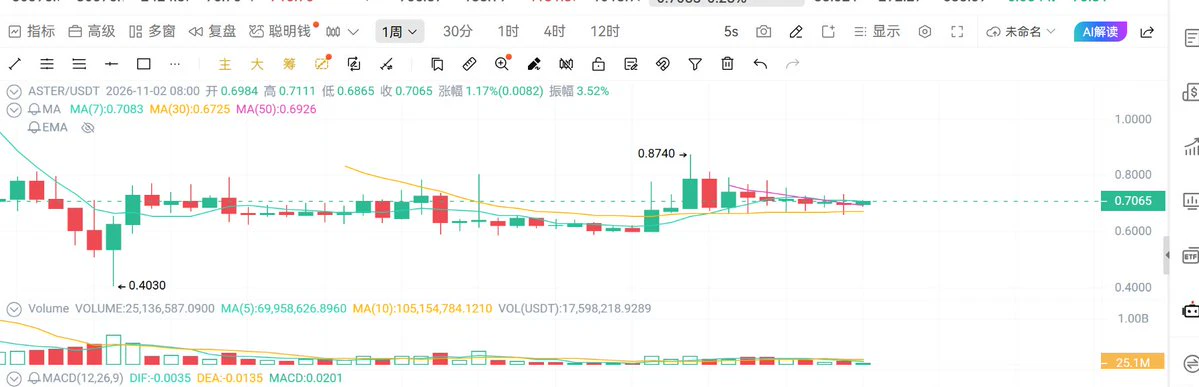
I’m heavily invested in aster-2:native. Can I still make it to the other side?
It’s been trading sideways near my cost basis for two months.
The good news is that holding it helped me avoid this big market drawdown. The bad news, of course, is that I haven’t made any money either.
post-image
ASTER-0.07%
Trenches
ZIG
Z
bade
b
ZIG
0x8c...1145
Market Cap
$.
Change
.
24h Vol
$.
Holders
.
BTC
B
bade
b
BTC
C5xp...pump
Market Cap
$.
Change
.
24h Vol
$.
Holders
.
HIGH
H
bade
b
HIGH
7ymF...high
Market Cap
$.
Change
.
24h Vol
$.
Holders
.
STONK
S
bade
b
STONK
6GmA...UNgx
Market Cap
$.
Change
.
24h Vol
$.
Holders
.
LEEROY
L
bade
b
LEEROY
98HE...pump
Market Cap
$.
Change
.
24h Vol
$.
Holders
.
Hahahaha, it's rare in Tokyo to see a construction site for a building like this with a little window open for passersby to look in.
post-image
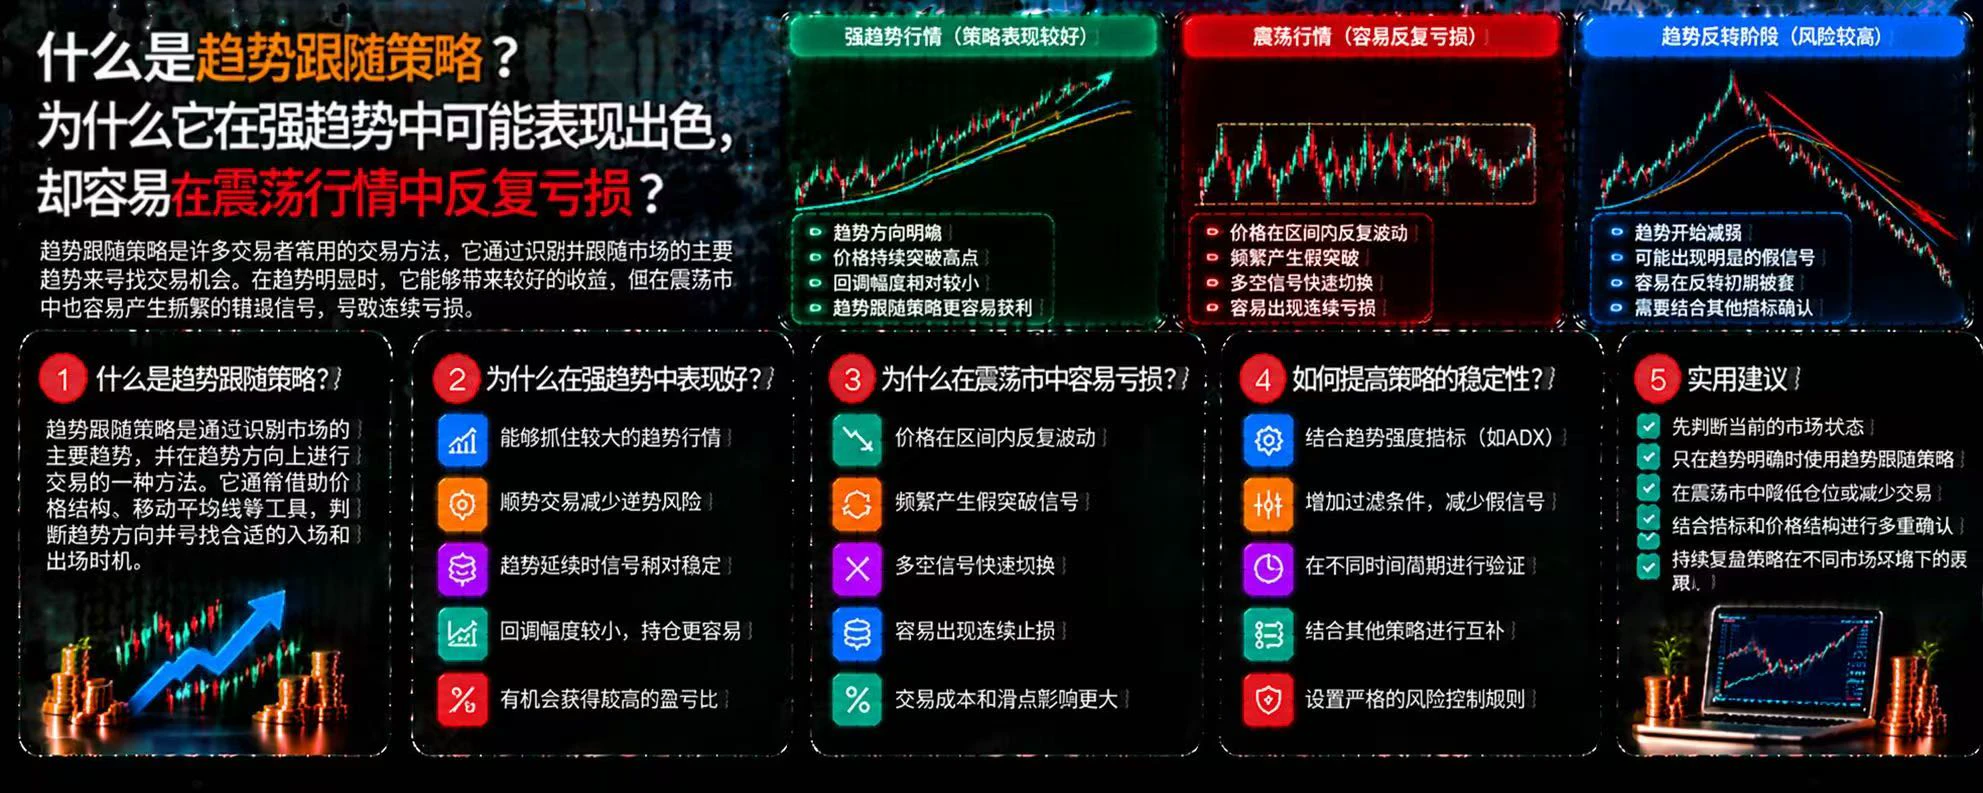
What Is a Trend-Following Strategy? Why Can It Perform Well in Strong Trends but Suffer Repeated Losses in Sideways Markets?
In cryptocurrency trading, trend following is a common trading approach: rather than trying to accurately predict tops and bottoms, traders look for entry opportunities after a trend forms and try to follow it for as long as possible. However, this strategy is not suited to all market conditions.
First, what is a trend-following strategy?
A trend-following strategy uses price structure, moving averages, or trend indicators to identify market direction, looking for opport
post-image
🔥 DEFI IS MAKING A COMEBACK — AND THIS TIME, FUNDAMENTALS ARE LEADING THE WAY!
Something interesting is happening beneath the surface of the crypto market.
Revenue-generating DeFi projects are starting to outperform the broader market. Since the beginning of 2026, a basket of 17 major DeFi tokens, including $HYPE , $LIT , $AERO, $AAVE , and $ENA , has reportedly outperformed Bitcoin by more than 2x.
That's a signal worth paying attention to.
The market appears to be shifting its focus. Instead of rewarding every trending narrative, investors are increasingly looking at projects that generate actu
post-image
UNI+3.05%
HYPE+0.24%
LIT-4.56%
AAVE-1.22%
ENA+8.04%
I think this gold rally is only just getting started. Physical gold held by central banks is getting increasingly scarce. This isn’t simply a price issue; it’s a matter of inventory and delivery. According to data from the World Gold Council, central banks have been net buyers of more than 1,000 tonnes of gold for three consecutive years: about 1,136 tonnes in 2022, 1,037 tonnes in 2023, and 1,045 tonnes in 2024. That’s a clear step up from the average of 400 to 500 tonnes a year over the past decade. Meanwhile, the “visible” buffers—such as free-float inventories in London vaults and delivera
post-image
XAU+0.38%
  • 3
What Is the Sharpe Ratio? How Can You Measure Whether a Trading Strategy’s Returns Are Worth the Risk?
In cryptocurrency trading, a high return does not necessarily mean a strategy is good. If a strategy can generate high returns but comes with sharp volatility and substantial drawdowns, we need to assess whether those returns are worth the corresponding risk. The Sharpe ratio is one tool that can help answer this question.
First, what is the Sharpe ratio?
The Sharpe ratio measures the excess return earned by a portfolio or trading strategy per unit of volatility risk. Generally, the higher th
post-image
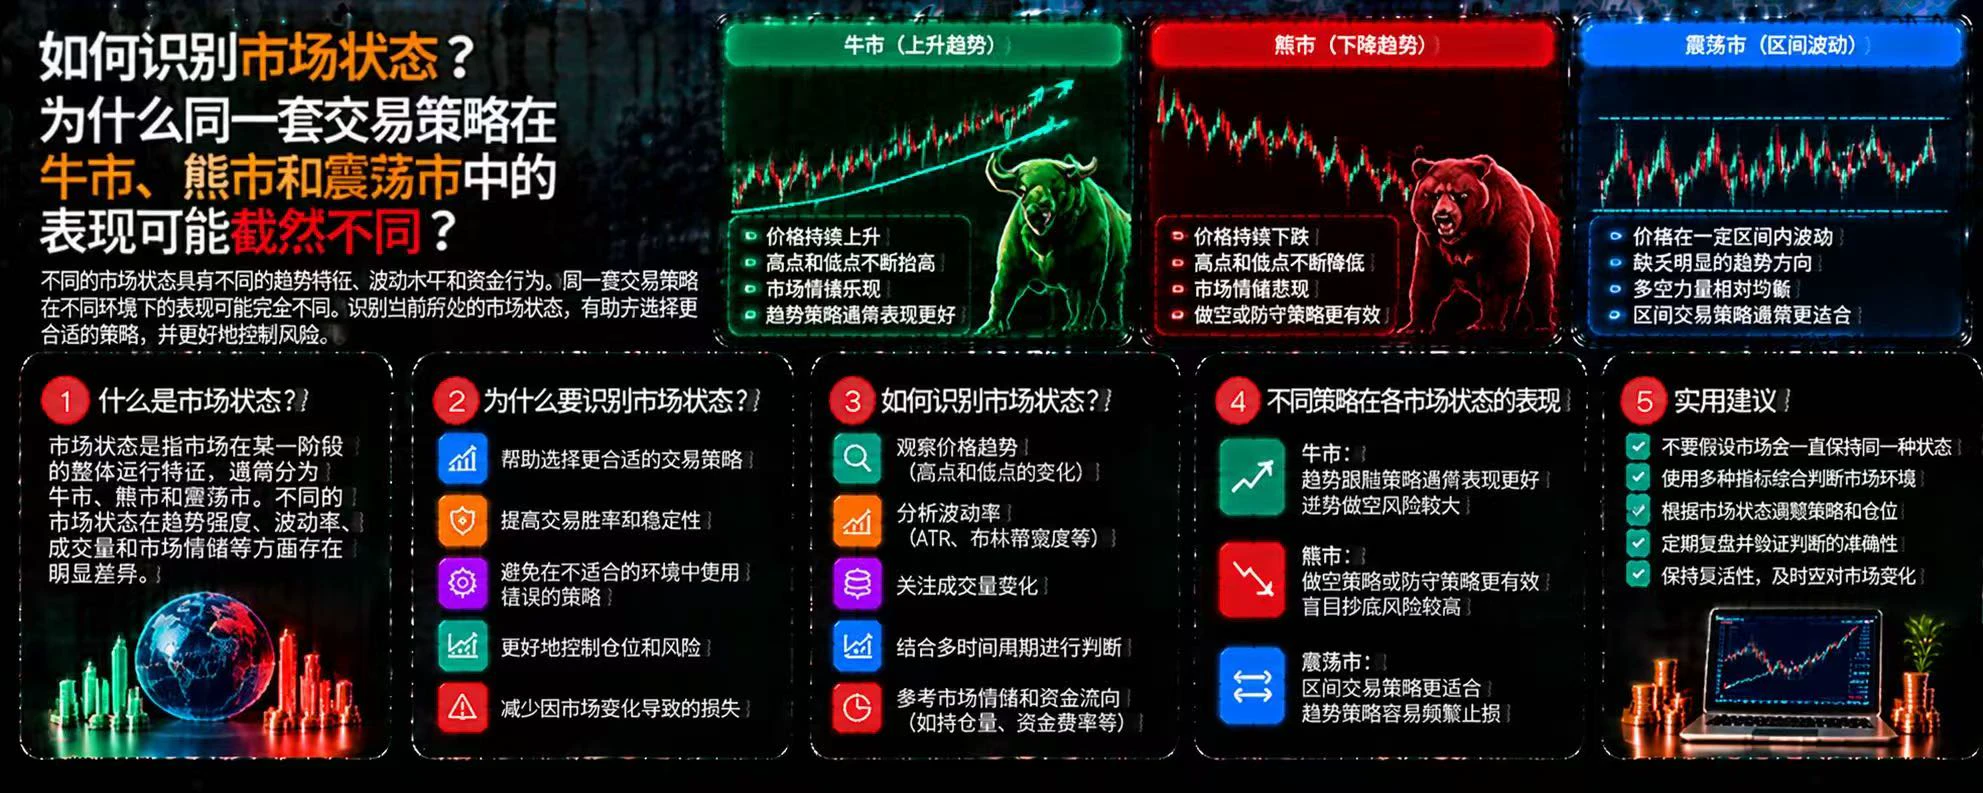
How can you identify market conditions? Why might the same trading strategy perform very differently in bull, bear, and sideways markets?
In cryptocurrency trading, many people look for a fixed strategy that can continue to generate profits no matter how market conditions change. But markets do not always operate in the same way. When trends, volatility, and capital flows change, the same strategy can perform quite differently.
First, what is a market regime?
A market regime refers to the overall characteristics of market behavior during a particular period. It is typically classified as a bul
post-image
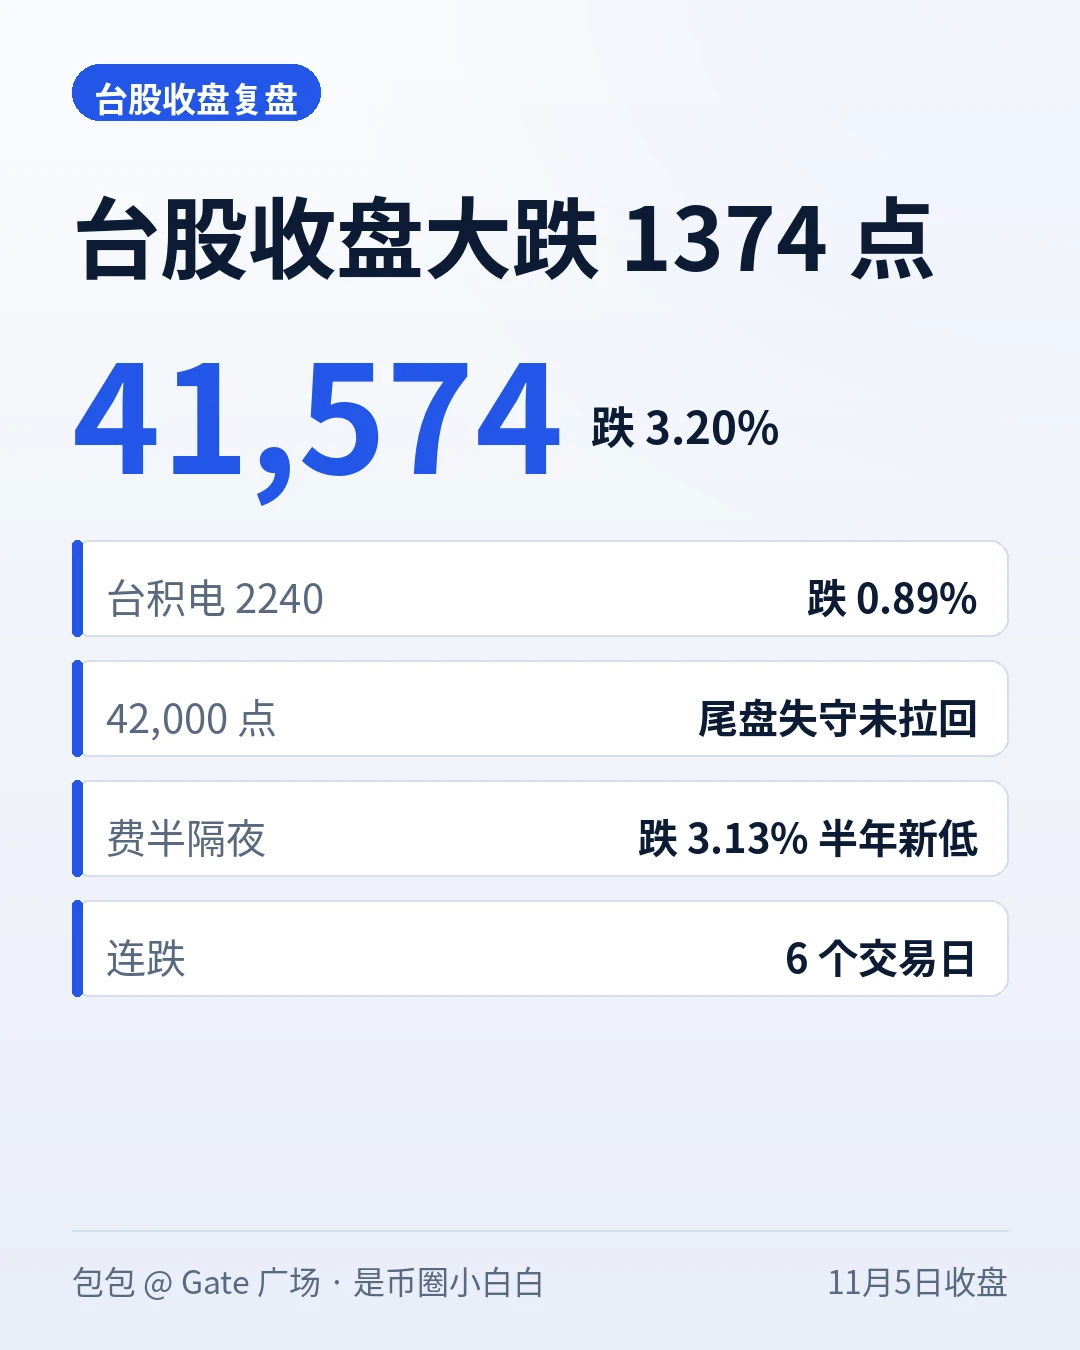
Taiwan stocks closed down 1,374 points, failing to hold 42,000—and even lost the morning low by the close. #Gate上线台股交易
The Taiwan Weighted Index closed at 41,574 today (November 5), down 3.20%, marking its sixth consecutive decline and a new low in more than 3 months. In my midday post, I left two questions to revisit: First, would 42,000 hold? No—the close was nearly 300 points below the morning low of 41,866. Second, would heavyweight stocks find support near the close? No—TSMC closed at NT$2,240, down 0.89%, and barely recovered at all throughout the day. The morning rebound, when losses n
post-image
TSM-2.28%
Thrusday Trades with Crypto Sat
live-cover
LIVE1,625
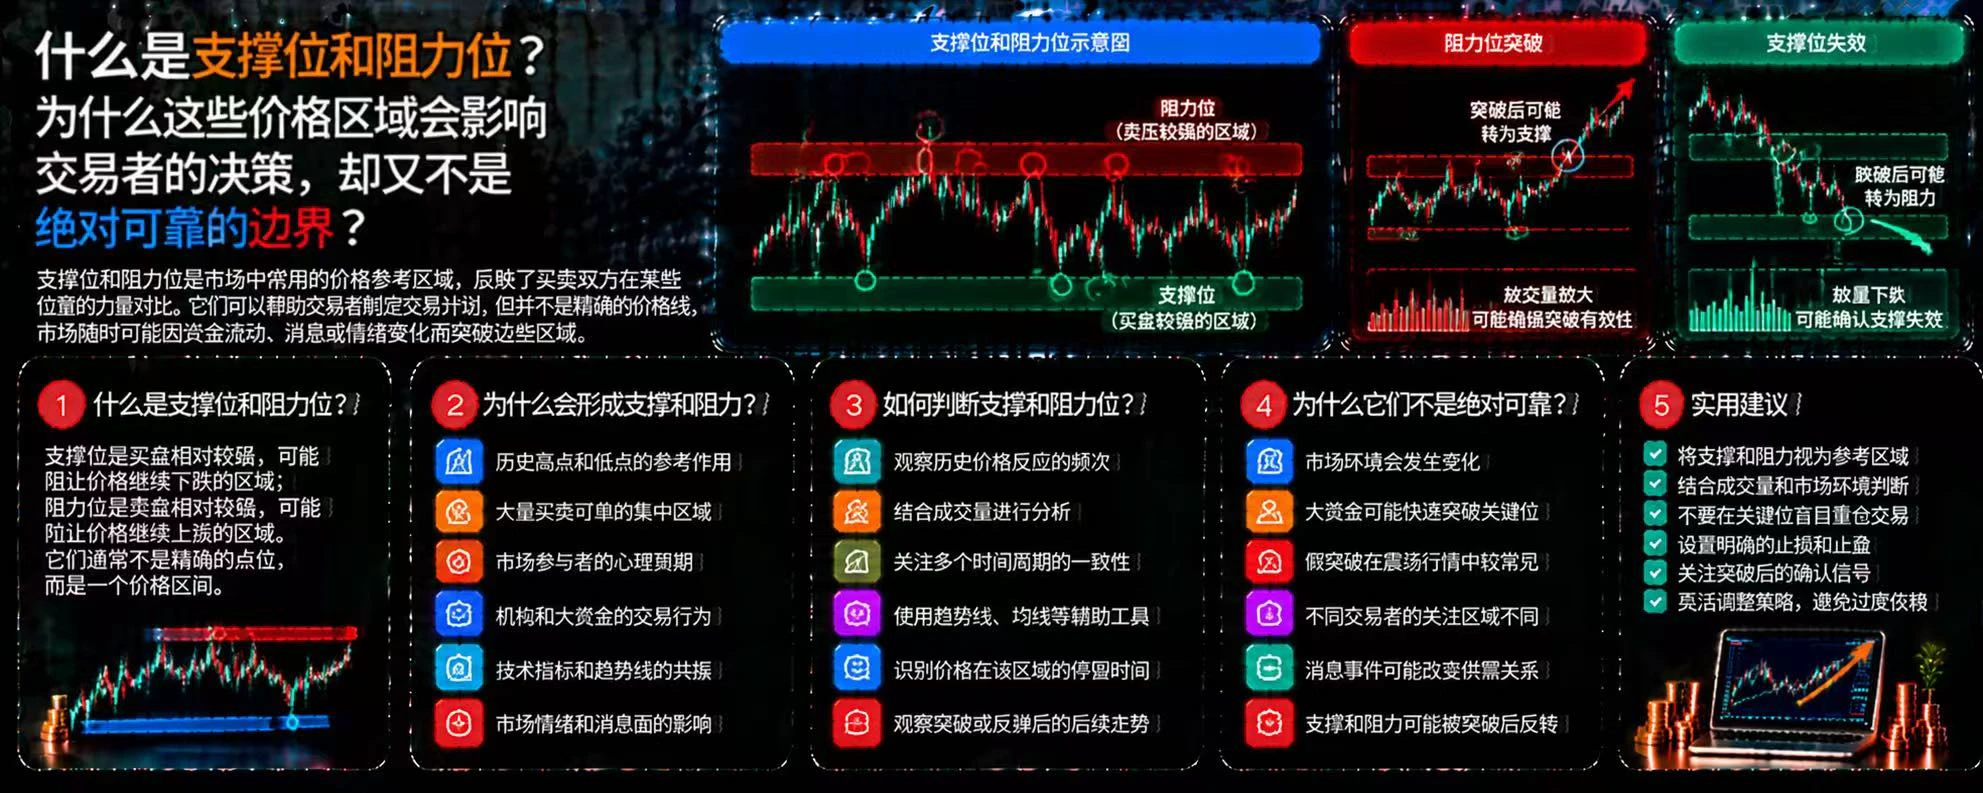
What are support and resistance levels? Why do these price zones influence traders’ decisions, yet are not absolutely reliable boundaries?
In crypto trading, prices often bounce or pull back repeatedly in certain areas. Traders usually call these areas support and resistance levels. They can help analyze market structure, but they do not guarantee that prices will bounce or reverse.
First, what are support and resistance levels?
A support level is an area where buying pressure may increase and a price decline may temporarily slow; a resistance level is an area where selling pressure may increa
post-image
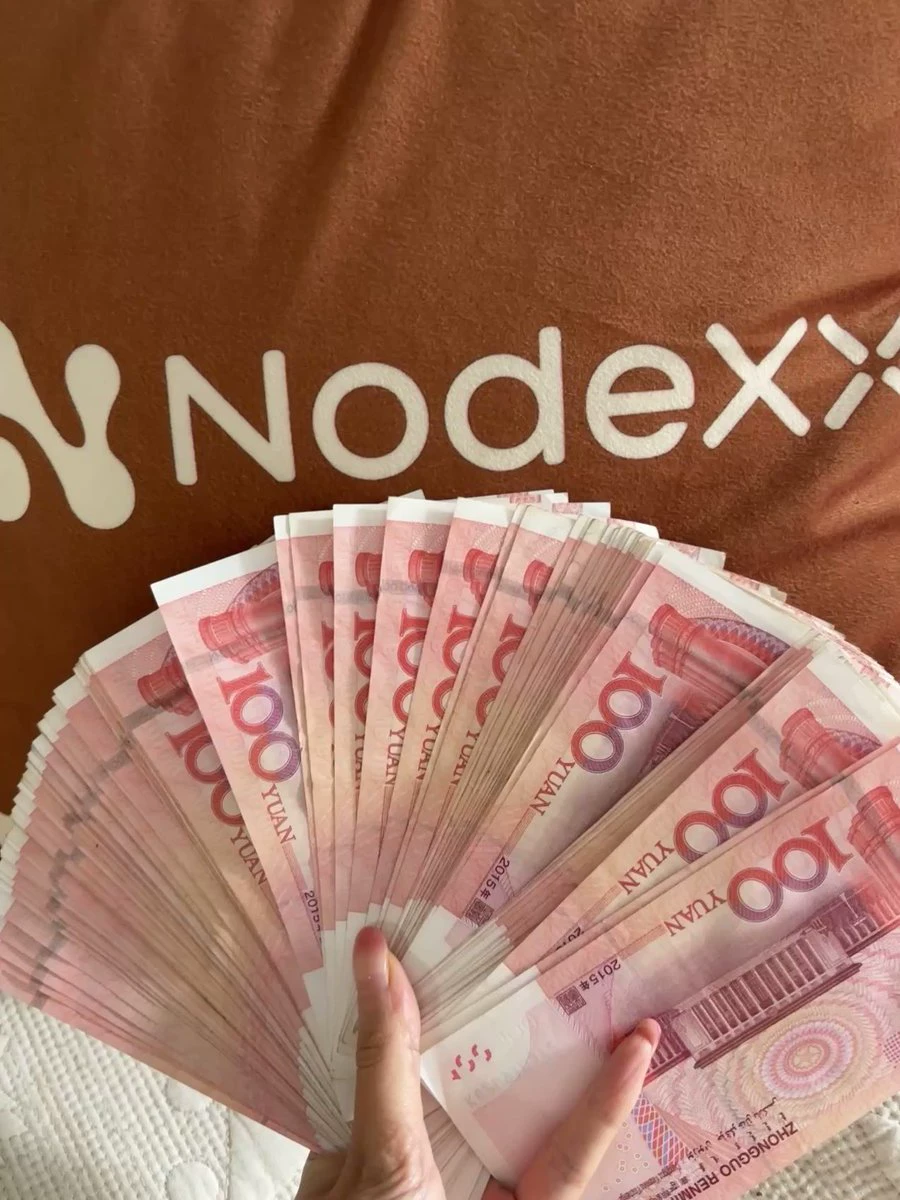
I recently made a small profit of 1771u trading futures. $ETH I’ll protect you forever. Speaking of which, I haven’t handled any RMB in ages. Today I exchanged the money I made trading futures for 10,000 yuan. It feels so nice to hold—like I got it for free 🫣 Next, I’m going to use the RMB to buy myself a gold necklace 😬
post-image
ETH-1.23%
[NEW STREAMER]market update
live-cover
LIVE1,642
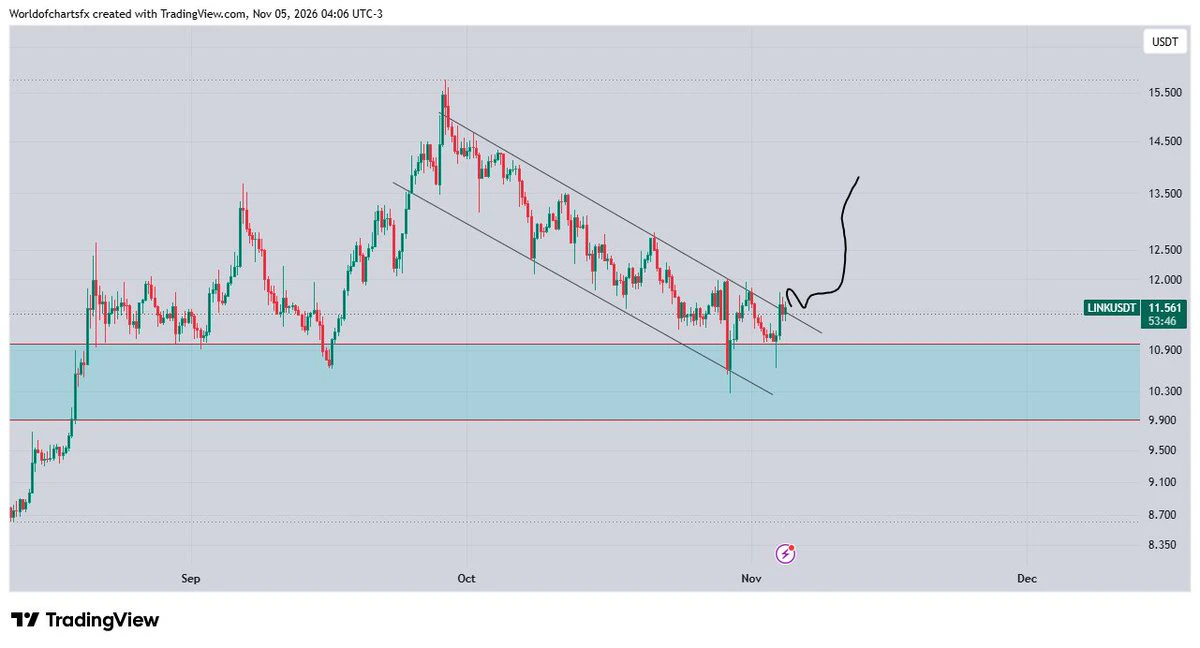
$LINK #Link Breaking Consolidation, Breakout Above Trendline Can Lead Rally Towards 15$
post-image
I had just brewed a cup of tea and sat down
when my phone immediately lit up with a string of discussions about INJC
It turns out Nasdaq has approved the listing application for Canary Capital’s Canary Staked INJ ETF, ticker INJC; Form 8-A12B was filed around November 3, and the prospectus is dated November 4
The fund typically stakes at least 90% of its INJ holdings; BitGo is the custodian, and the fee is 1.10%; it still needs to wait for the SEC to declare its S-1 registration statement effective before it can actually launch, so it can’t yet be considered a tradable product
After the news b
post-image
INJ-1.67%
Gate ETF Golden Rewards is live for a limited time, offering exclusive XAUT rewards to Futures Points users, stock traders, and VIP5+ users. Reach cumulative ETF trading volume milestones to unlock higher rewards. Users eligible for multiple categories can combine rewards by completing the respective tasks. https://www.gate.com/campaigns/6874?ch=9340&ref=VLARBF1YAG&ref_type=132
post-image
XAUT+0.30%
ETH Short-Squeeze Rebound: Primarily Liquidation-Driven, with Weak Follow-Through from Spot Funds
ETH’s intraday price volatility reached 6.89%. Total liquidations across the market over 24 hours were 209 million, of which short positions accounted for 126 million, or 60.33%, showing the market’s typical short-covering-driven characteristics.
Liquidations peaked between 23:00 and 00:00 on November 4, with the largest single liquidation nearing 38 million. Current liquidation volume is 1.9 times the 7-day average, putting short-term sentiment in an extreme range, but it is only 0.59 times the 3
ETH-1.23%
When USDT can be frozen, we should rethink: Who really owns digital assets?
Recently, news of USDT being frozen has once again sparked discussion in the crypto community.
Many people entered the blockchain world because they believed in an idea: assets should be under their own control, transactions should be more transparent, and individuals should not depend too heavily on any single institution.
But reality also reminds us of an important question:
When the digital assets you hold can still have their transfers restricted by a centralized issuer, what do you truly own?
To be clear, we shoul
post-image
📡 BTCSOS Signal Card · Repost Version
Source: BlockchainBaller Channel Asset: $ZEC Long entry: 1334 Targets: 1500 / 1700 / 2000 Stop loss: Not specified (yes, you read that right—they didn’t write one) Time: Not specified
Come to think of it, I reposted this person’s $APPB trade earlier today, and here they are again—their output is pretty prolific 👀
I’m just here to pass it along. Whether you look into it, follow it, and how much you put in is entirely up to you, dear. Signals without a stop loss carry risks you’ll have to weigh for yourself.
Shared as a personal record, not investment ad
ZEC+1.16%
Load More

Join 40 M users in our growing community

⚡️ Join 40 M users in the crypto craze discussion

💬 Engage with your favorite top creators

👍 See what interests you

Trending Topics

GateLaunchesPoSECProofOfSecurity

239 Views448 Discussing

Gate has officially launched Proof of Security, or PoSEC, extending beyond Proof of Reserves by disclosing the distribution of cold-storage and hot-wallet assets and introducing a cold storage coverage ratio to measure protection under extreme-risk scenarios. Gate’s latest cold storage coverage ratio stands at 104.58%, with 88.26% of assets in cold storage and 11.74% in hot wallets. A coverage ratio of at least 100% means cold-storage assets alone would still be sufficient to cover all user assets even if hot-wallet assets were fully lost. Exchange security is not only about whether reserves are sufficient, but also how assets are stored and protected under extreme conditions. Could cold storage coverage become a new industry standard?[👉 Learn more](https://gate.com/proof-of-security)

BTCBackAbove80K

45.78k Views41.27k Discussing

DemocratsWinBothChambers

19.88k Views456 Discussing

View More