Share your thoughts
placeholder
Article
A few days ago, $ARB broke out on heavy volume and held above the moving averages. I reminded myself not to hesitate and added to my long position with the trend. But the wicks early in the breakout were genuinely frightening, and my unrealized profit briefly shrank by more than half.
After the price strengthened again, I closed 70% of the position first and placed a trailing stop on the remaining 30%. Some people prefer to exit all at once, but taking profits in batches suits me better. Even if the price continues to surge on momentum later, I still have a position to participate with and won
post-image
ARB+41.58%
ZEC+1.59%
BNB+6.59%
Everyone’s staring at $ETH /USDT’s 2484 level—but the real signal is a 55% short that nobody dares to fade.

$ETH /USDT - SHORT

Trade Plan:
Entry: 2482.1 – 2487.1
SL: 2508.9
TP1: 2466.3
TP2: 2454.2
TP3: 2435.9

Why this setup?
Why now?
- 4h bias is SHORT but confidence is only 55—this is a knife-edge, not a slam dunk.
- 1D trend is *range*, so we’re not chasing a breakout—we’re playing the mean reversion.
- RSI 15m at 55.69 shows a weak bounce, not a reversal—buyers are gasping.
- Entry zone 2482–2487 is tight; TP1 at 2466 is only 0.7% away—quick scalp fuel, but TP3 at 2435 is the
ETH+1.21%
$UNI basically won't drop much anymore; the futures contract is a sure thing.
UNI+16.52%
Move to Hawaii they said.
It’s paradise they said.
So far, wild fires, tsunami, and now this.
Stay safe everyone.
post-image
Is HYPE’s new all-time high just the beginning? The real test comes after $88!
HYPE broke through $88 and set a new all-time high, and this kind of move is most likely to ignite market sentiment.
Why does a new high matter? Because once the price breaks above all previous highs, the pressure from holders trapped at higher levels is significantly reduced, and the market begins to enter a new phase of “price discovery.” At this point, the market’s focus also shifts from “Can it break through?” to “Where is the next stop?”
But the stronger the rally, the less you should focus solely on the gains.
HYPE+1.10%
  • 48
#Altcoins relative strength vs bitcoin:native is breaking out
What does this mean?
IYKYK
post-image
BTC+0.29%
  • 2
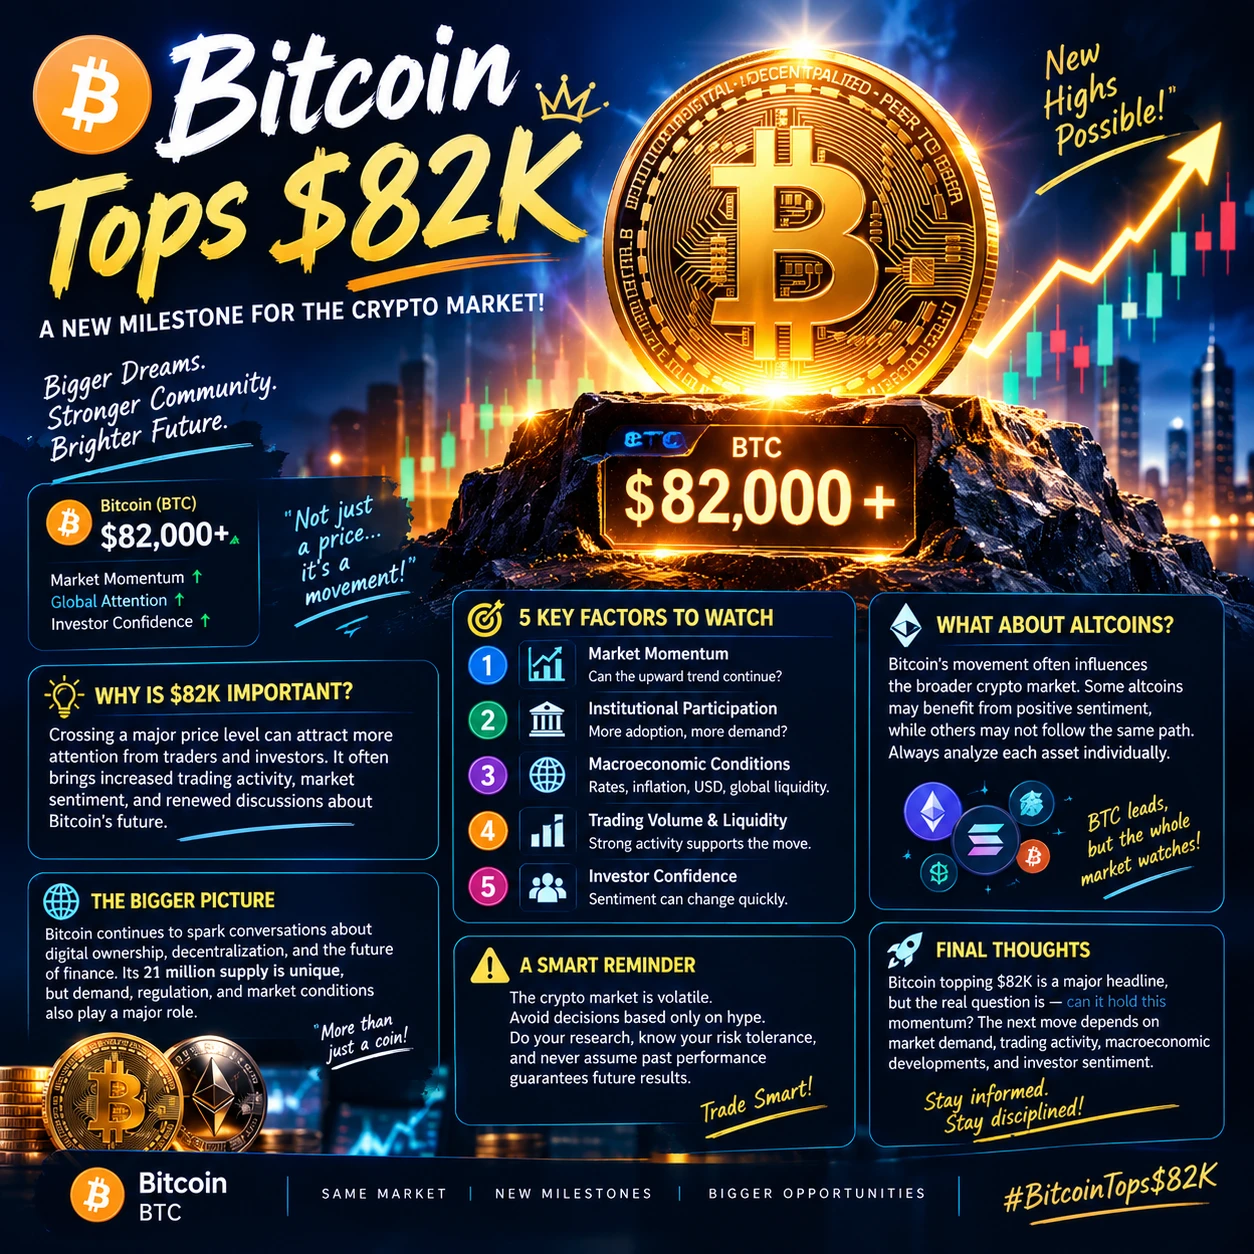
#BTCReclaims80K BTC Reclaims $80K, Market Confidence Returns
Bitcoin reclaiming the $80,000 level is more than just another move on the price chart. It represents an important psychological milestone for the market, because round-number levels often become powerful areas where traders decide whether momentum is strong enough to continue or whether another correction could begin.
The recovery above $80K shows that buyers are willing to step back into the market after periods of uncertainty. When Bitcoin successfully moves back above a major psychological level, market sentiment can change quick
BTC+0.29%
Most traders still think DOGE is bullish—here’s the 4h signal they’re ignoring.

$DOGE /USDT - SHORT

Trade Plan:
Entry: 0.08945 – 0.09013
SL: 0.09301
TP1: 0.08737
TP2: 0.08576
TP3: 0.08334

Why this setup?
Why now?
- RSI 15m at 43.67 = weak bounce, sellers reloading.
- 1D trend is *range*, not uptrend—so shorts work at range highs.
- Entry zone: 0.08945–0.09013. TP1 at 0.08737 is a 2.7% drop; TP3 at 0.08334 is a 7% drop.
- Stop at 0.09301 caps risk above range midpoint.
- Confidence 55% isn’t screaming, but the asymmetry (risk ~3.5% vs reward ~7%) favors the short.

Debate:
If D
DOGE+6.34%
$NVDA NVIDIA's recent price action has been range-bound at high levels, with an overall strong trend and increased volatility, but on the weekly timeframe, it has not seen a truly one-way, straight-line rally or sharp decline.
Based on the latest price action, NVIDIA shares are trading around $230, close to the 52-week high of $236.54, indicating that the bullish trend remains intact, while resistance above is also clearly evident.
The market remains broadly optimistic about its 12-month price target, but short-term funds are more focused on whether the stock can hold the $228–$230 range and c
NVDA+0.87%
Congratulations everyone hehe
Hope we keep profiting together 🥳
"I am proud of you."
post-image
#Bots I'm trading MEMECOINUSDT with the Futures Grid bot on Gate. Join me!
post-image
WLD's 4h chart is whispering a short—but 55% confidence means the market is laughing at certainty.

$WLD /USDT - SHORT

Trade Plan:
Entry: 0.3960 – 0.3982
SL: 0.4076
TP1: 0.3892
TP2: 0.3839
TP3: 0.3760

Why this setup?
Why now? The 1D trend is *range*, not breakout—so mean-reversion rules. RSI on 15m sits at 51.01, dead neutral, giving price room to drop without overbought friction. Entry ref at 0.3971, with TP1 at 0.3892 (a clean 2% sweep) and TP2 at 0.3839—that's where the range's lower lip likely bites. ATR on 1h (0.004387) is tight, so the move should be slow, not violent—perfect for a
WLD+3.21%
K-line pattern: The recent price rebounded sharply from the low of 62,508.3, reaching a high of 82,279.9, and currently stands at 79,874.2, consolidating at elevated levels. The latest candlestick has a relatively small body, with its upper shadow near the previous high, indicating selling pressure overhead.
· Technical indicators
· MACD: DIF (3,246.0) is below DEA (3,423.8), with a negative histogram value (-355.6). A death cross has formed, indicating weakening upward momentum and pullback pressure.
· KDJ: The K value is 87.3 and the D value is 86.9, both in the overbought zone (>80), in
AI
Which company has the best Code Arena WebDev AI model end of September?
OpenAI
76%1.32x
Anthropic
24%4.17x
$14.89K 24H+14 more
BTC+0.30%
ETH+1.21%
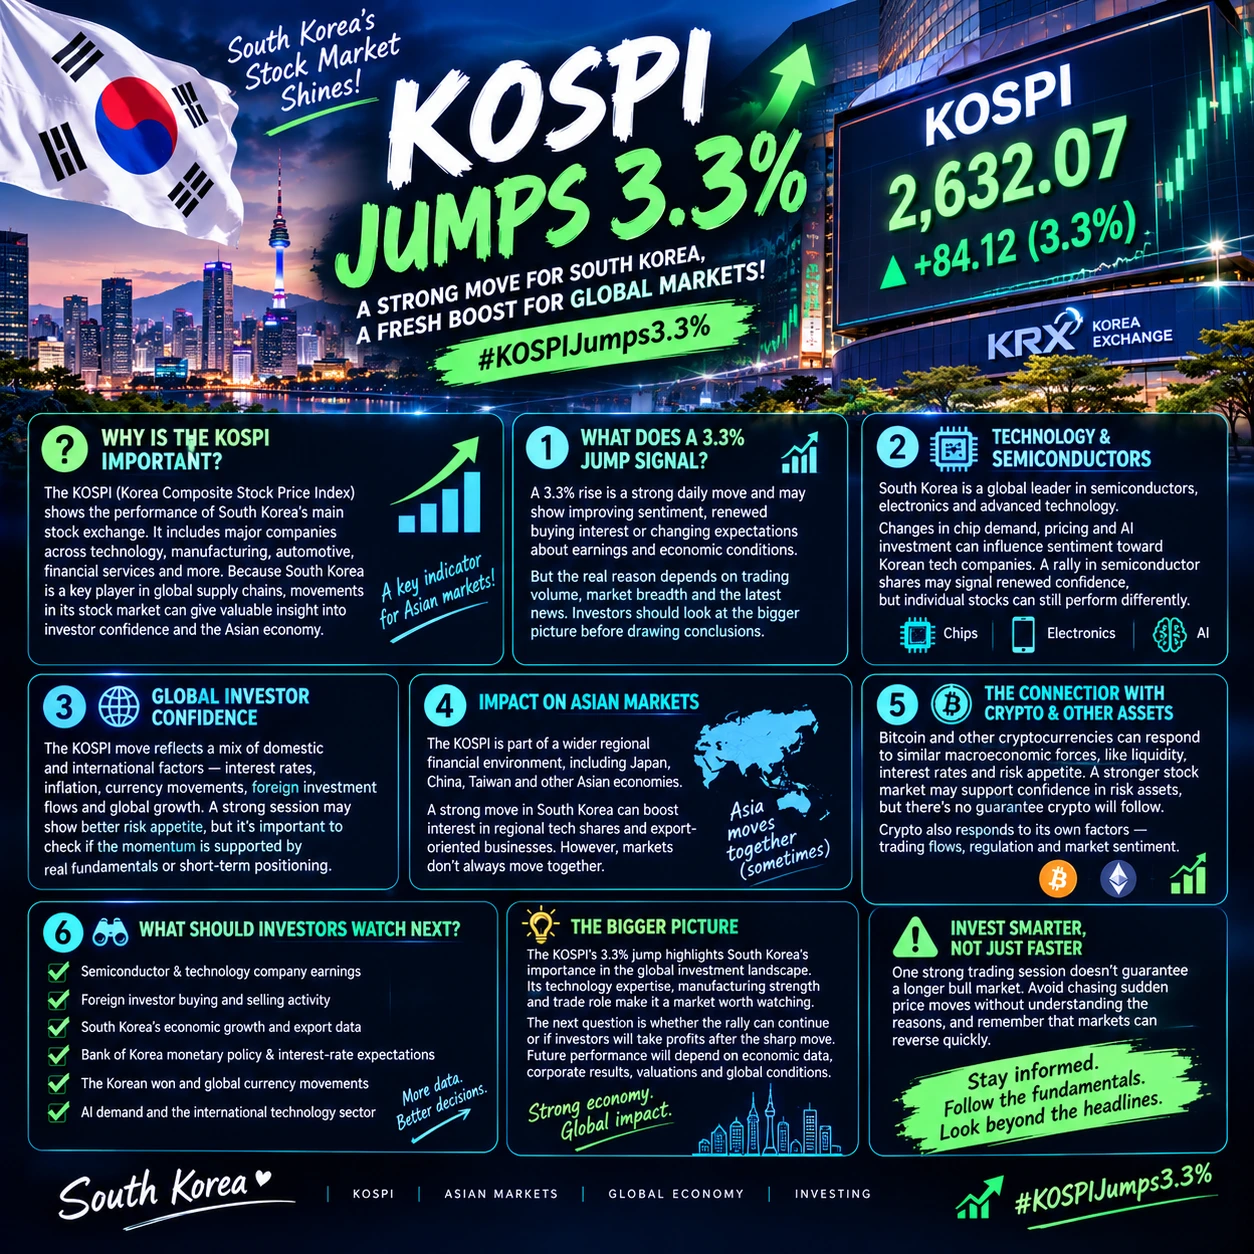
Japanese and South Korean stocks rebound strongly! What is the market trading behind SoftBank's surge?
This rebound in Japanese and South Korean stocks appears on the surface to be driven by rising tech stocks, but in reality, it reflects a renewed recovery in global risk appetite.
Previously, tensions in the Middle East, rising oil prices, and growing expectations of interest rate hikes triggered a clear correction in the Japanese and South Korean markets. On September 2, the Nikkei 225 and KOSPI weakened in tandem, while SoftBank fell more than 6% at one point. But market sentiment quickly r
  • 36
Everyone’s staring at the 1D range—but the 4h is quietly setting a trap on $BNB /USDT.

$BNB /USDT - SHORT

Trade Plan:
Entry: 767.9 – 771.3
SL: 790.3
TP1: 754.1
TP2: 743.7
TP3: 728.2

Why this setup?
- Price pinned at 769.6 with RSI(15m) at 46.96—no momentum to break upward.
- ATR(1h) at 6.63 means volatility is compressing; shorts love this setup before expansion.
- Targets are stacked: TP1 754.1, TP2 743.7, TP3 728.2—room to run if 767.9 fails.
- Why now? The 1D range gives false comfort, but the 4h signal (Conf 77) says the next leg is down.

Debate:
If BNB loses 767.9, are you r
BNB+6.59%
BTC MARKET UPDATE
live-cover
LIVE534
A few days ago, I placed a limit order for $ZEC , which filled at around 828.40. I wasn’t expecting much, but when I woke up, I found that the market had already started moving in the direction I expected. After confirming that the candlesticks and volume were moving in sync, indicating that the upward move was not weak, I held the long position and observed.
After the price surged to the key level, a rapid wick appeared, and short-term divergence began to increase, reminding me not to get greedy. Without clinging to all the unrealized profits, I took profit on 80% first and moved the protectiv
post-image
ZEC+1.59%
BNB+6.59%
SOL+1.58%
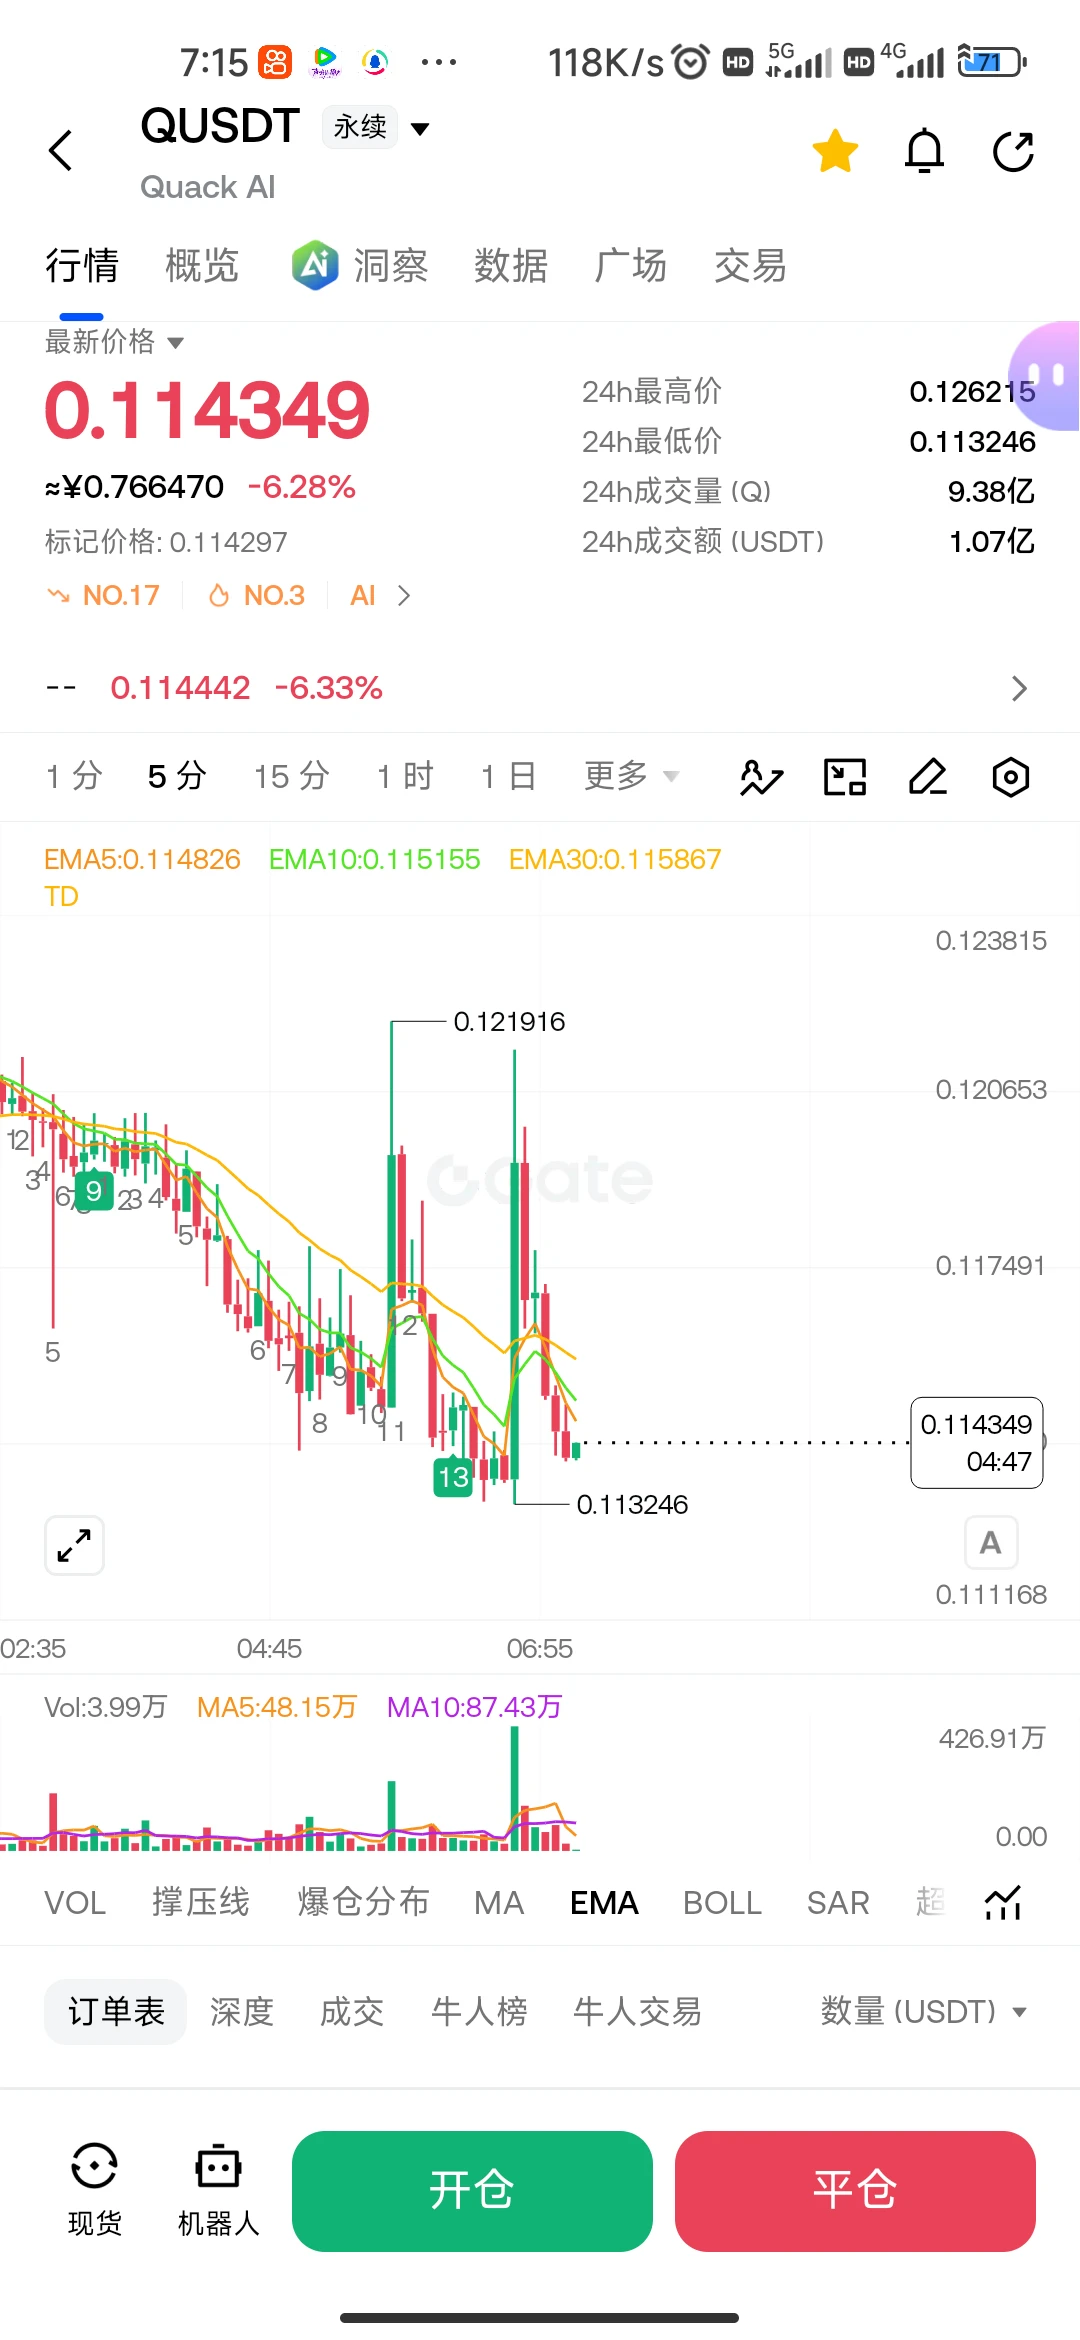
$UAI explain what’s going on with the bot specifically on this coin. The same strategy on other coins works fine and is profitable, but here it closes some trades at a loss and others at a profit, and in the end only half the profit remains. What’s the matter?
post-image
UAI+20.72%
$MARSCOIN starting to form bearish structure on lower time-frames. Gonna try to short it another time from here.
Entry zone 0.2435 - 0.2475
Stop loss 0.25422
#MARSCOIN
post-image
MARSCOIN+30.67%
Load More

Join 40 M users in our growing community

⚡️ Join 40 M users in the crypto craze discussion

💬 Engage with your favorite top creators

👍 See what interests you

View More