Square
Following
Hot
News
Notifications
Profile
Share your thoughts
placeholder
Article
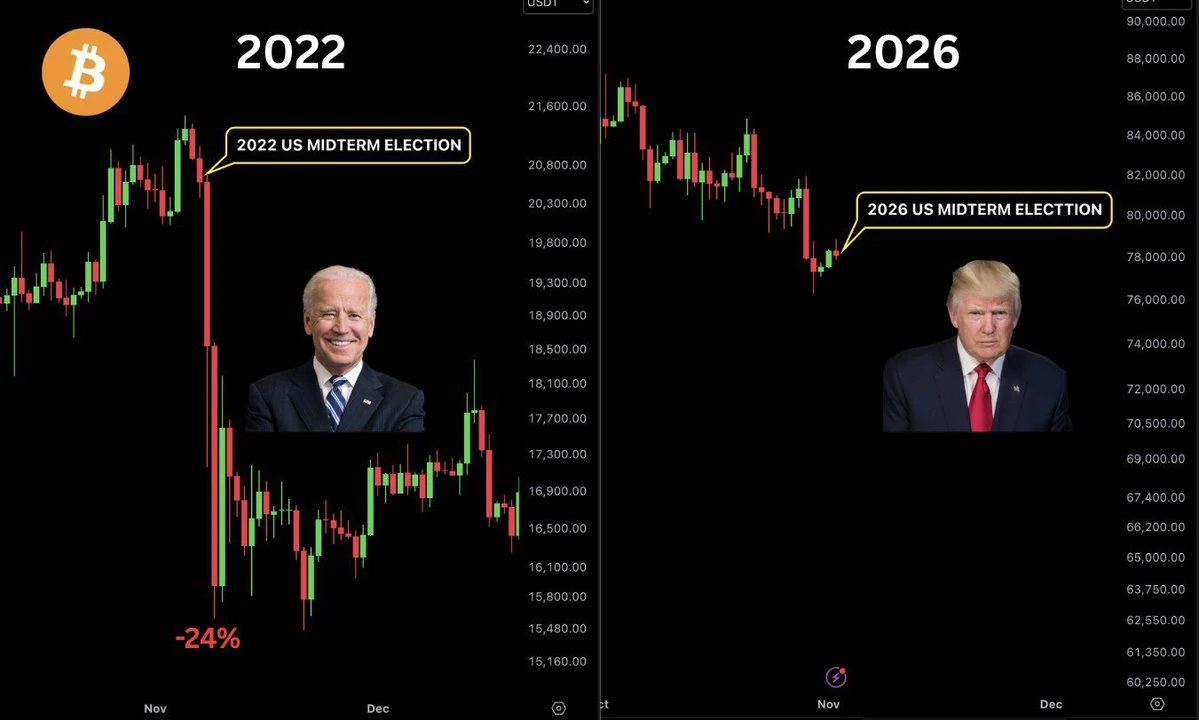
Is the real show only just beginning? U.S. stocks have only just started falling—I can't even imagine 😭
post-image
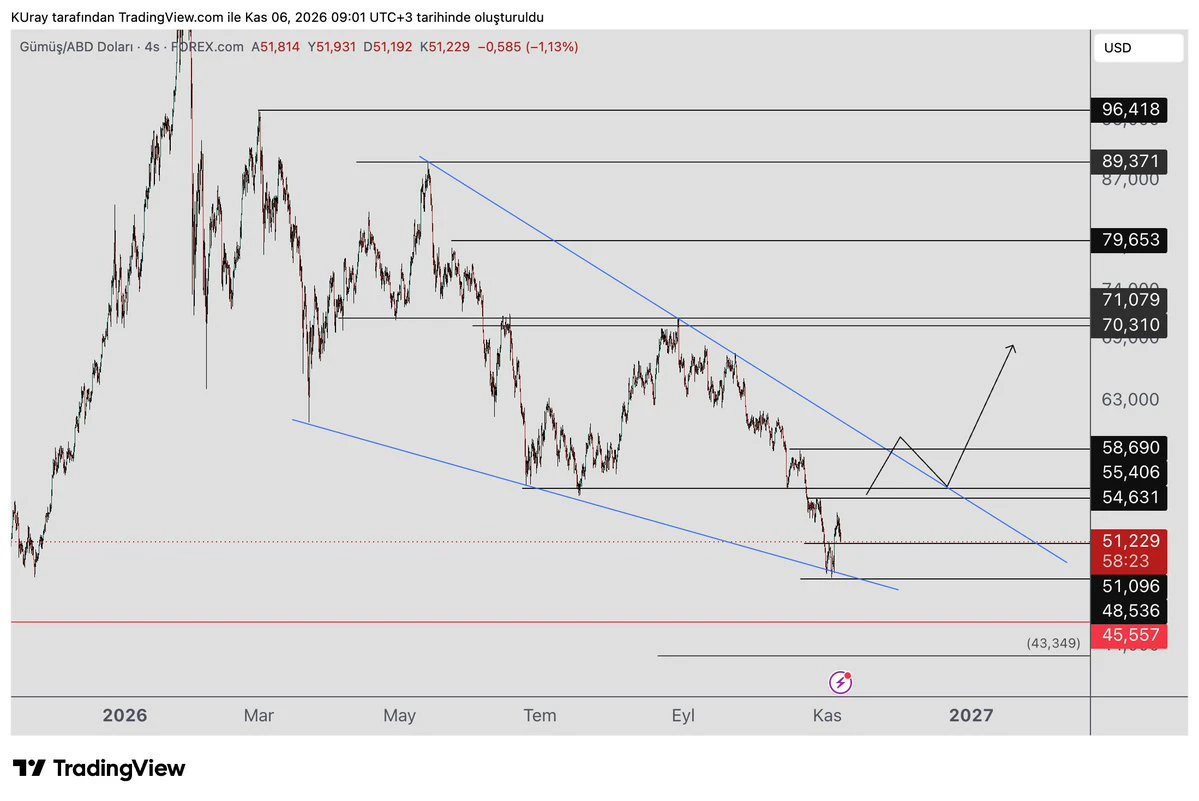
We are tracking the falling wedge forming in #xag #Gümüş . As long as it holds the 48.5 low, the wedge may still play out.
It broke through 51 resistance with volume and is now coming back to test the resistance it broke. The broken resistance may act as support. After the retest, it could rise toward 54-55 resistance.
If there is no close above the 54-55 zone, the decline could resume, indicating that the rise was a reaction to the downtrend.
If it closes above the 54-55 zone, the rise is expected to continue further.
After that, we will watch the 59 level. If it closes above, the upper edge
post-image
XAG+0.47%
Trenches
ZIG
Z
bade
b
ZIG
0x8c...1145
Market Cap
$.
Change
.
24h Vol
$.
Holders
.
BTC
B
bade
b
BTC
C5xp...pump
Market Cap
$.
Change
.
24h Vol
$.
Holders
.
STONK
S
bade
b
STONK
6GmA...UNgx
Market Cap
$.
Change
.
24h Vol
$.
Holders
.
DESSA
D
bade
b
DESSA
npz2...pump
Market Cap
$.
Change
.
24h Vol
$.
Holders
Diamond
D
bade
b
Diamond
5VCE...pump
Market Cap
$.
Change
.
24h Vol
$.
Holders
.
🪔 Happy Dhanteras! 🇮🇳
May this Dhanteras bring wealth, prosperity, and new opportunities.
May your investments grow, your portfolios shine, and your financial goals move closer to reality.
Wishing everyone a prosperous and successful year ahead!
#HappyDhanteras #Crypto #Bitcoin #WealthCreation
post-image
BTC-0.67%
This level once again tested the previous low from the early-morning drop without breaking it. Accumulation at the bottom continues, though there is still some pressure. Go long at the current price—bulls, charge with me!#美股史诗级抛售 #Gate首创资金安全证明
Trump: The stock market plunge was caused by those “stupid Democrats”
Trump has finally found a chance to shift the blame.
If the AI bubble bursts this time, Trump can pin the blame for its collapse directly on the Democrats.
That’s because Democrats support people opposing data centers and slowing their construction, which burst the AI bubble.
As for how the AI bubble got inflated in the first place, don’t ask Trump—he definitely won’t take the blame.
However, I think we should wait and see whether the AI bubble is about to burst completely right now.
Of course, I think the AI bubble bursting
What Is Leveraged Trading? Why Can Leverage Improve Capital Efficiency While Also Amplifying Losses and Liquidation Risk?

In the cryptocurrency market, leveraged trading allows traders to use a relatively small amount of margin to establish a larger position. But leverage is not a free capital multiplier: it also amplifies the impact of price movements on account equity. Without risk management, even a relatively small adverse market move can cause serious losses.

First, what is leverage?

Leverage uses margin to establish trading exposure greater than the amount of margin you provide. For e
post-image
#AsiaPacificStocksPlunge #ShareWeekly
Asia-Pacific Stocks Are in a Sharp Sell-Off: What Is Driving the Plunge, How Far It Has Gone, and Where Stability Could Come From

Asia-Pacific equity markets have entered one of their sharpest sell-offs of the past several weeks. On Friday, November 6, 2026, the region opened with heavy losses, and the move was far larger than the declines seen in the sessions of November 4 and 5. Japan's Nikkei 225 and South Korea's KOSPI led the fall, with chip and AI-linked stocks taking the heaviest damage. Taiwan, Singapore and mainland China also declined, while Ho
  • 13
  • 1
The AI Stock Crash Brings Back Memories of
live-cover
LIVE2,209
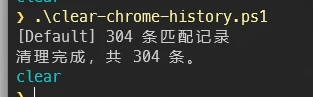
People who get sent flying by cars often know that having to get up and delete their browser history before passing out every time is a hassle.

So we could write a script. Since Chrome stores browsing history locally in plain-text SQLite, we can use SQL to find and delete it directly.

Then we can set the script up as a scheduled system task.

But if you’re signed in to a Google account, I don’t know whether this method will sync automatically.
post-image
How Should You Allocate Position Sizes Scientifically in BTC Trading? Don’t Let One Mistake Wipe Out Your Entire Account!

In BTC trading, many people spend a lot of time researching entry points but overlook an equally important question: How much capital should you commit? Even if you correctly predict the market’s direction, an oversized position can expose you to enormous pressure from a normal pullback. Truly experienced traders consider not only where to buy, but also how much to invest.

First, determine your position size based on your risk tolerance. Don’t use the same amount of capit
post-image
BTC-0.65%
This is the most ridiculous product I’ve seen lately: esports lozenges.
Is this thing basically an IQ test for young people?
Does anyone really believe eating these can improve their gaming skills?
The marketing is even more ridiculous: 36.5% better operational acuity, 35.2% better critical decision-making, 42.6% faster reaction times, 29.8% better overall awareness.....
How are these metrics even quantified? This marketing has no bottom line—they’re just making stuff up.
The crazy part is that people actually buy this! If someone you know takes these, make a note of it so you can sell them he
Alright, now we know the economic environment is bad 😓
People with no artistic bone in their body won’t see this video in their feed.
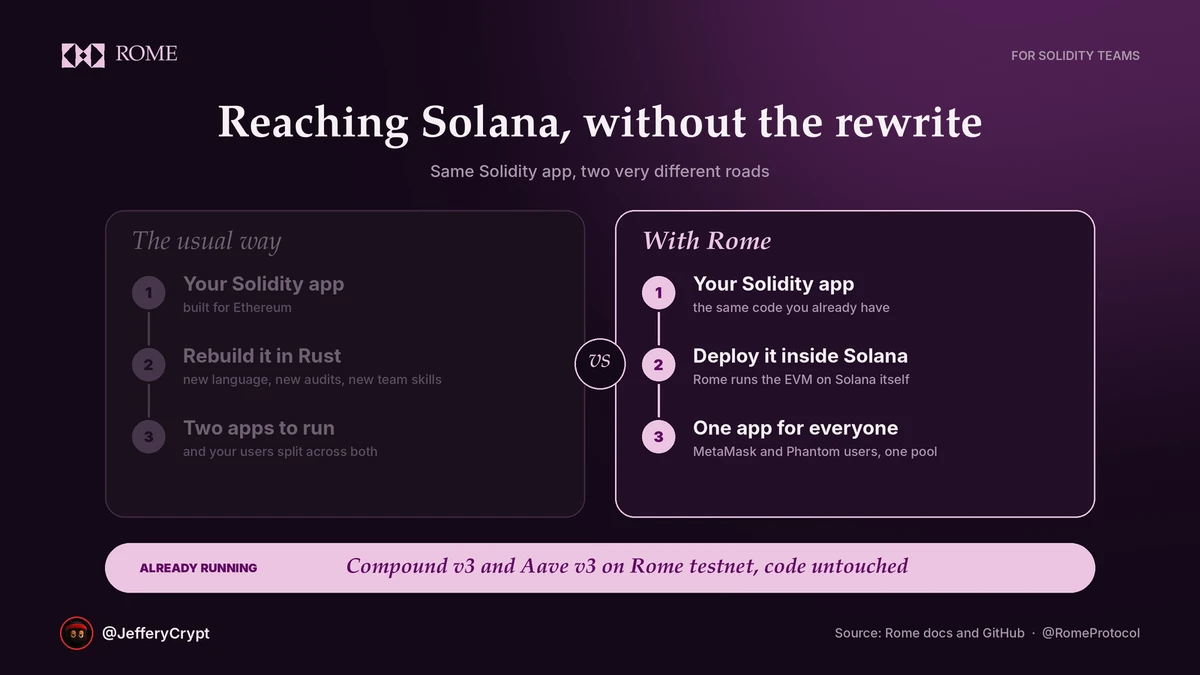
Plenty of Solidity teams want Solana’s users, but the thing that usually stops them is having to rebuild the whole app in a new language, and that’s the exact gap @RomeProtocol closes.
Rome runs the EVM right inside Solana, so contracts written for Ethereum can go live there as they are, and Compound and Aave are already running on Rome’s testnet with their code untouched.
Once you’re there, MetaMask and Phantom users share the same app, and your contracts can tap into Solana apps like Jupiter in a single transaction.
So if you’re a Solidity team that’s wanted Solana but not the rewrite, this
post-image
SOL-0.77%
ETH-1.26%
COMP-10.58%
AAVE-1.22%
JUP-1.73%
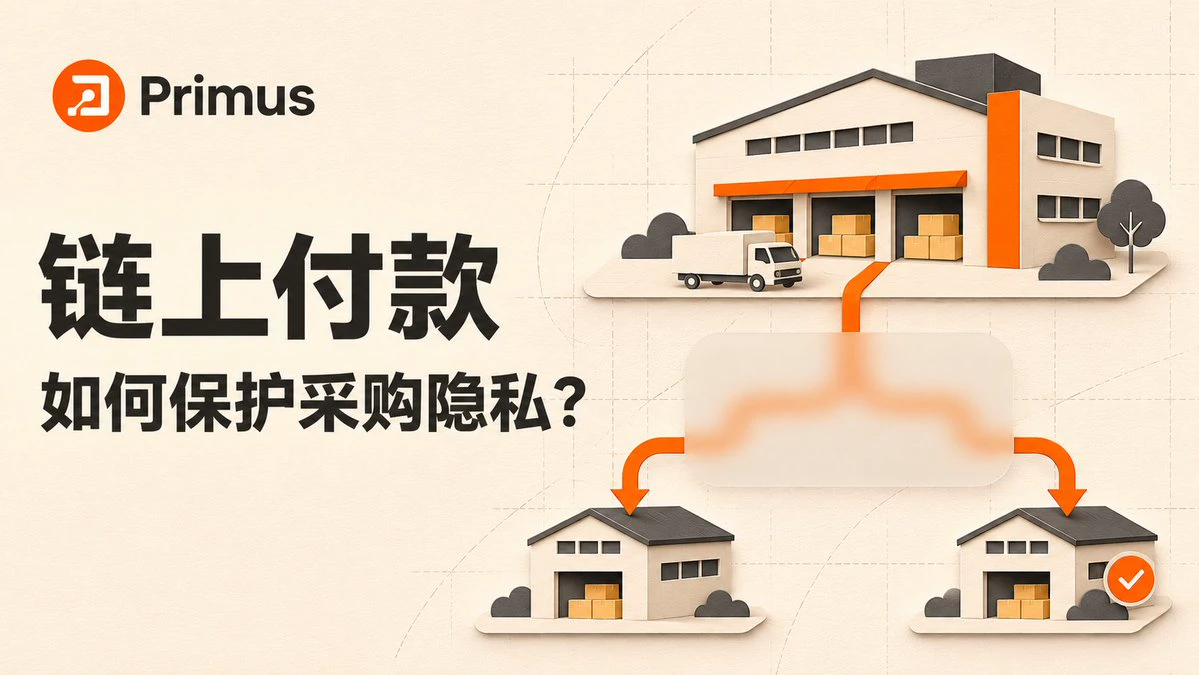
How much business information can others glean from a stablecoin payment once it’s on-chain?
Suppose a company uses stablecoins to pay its suppliers every week. Looking at a single transfer, you might only know how much was paid. But if the payment address is linked to the company’s identity, looking at several months of transactions together could let an observer infer who it works with, whether its purchasing volume has changed, and even which suppliers are being replaced.
This information might normally be scattered across contracts, invoices, and internal ledgers. On a public blockchain, t
post-image
BNB-0.76%
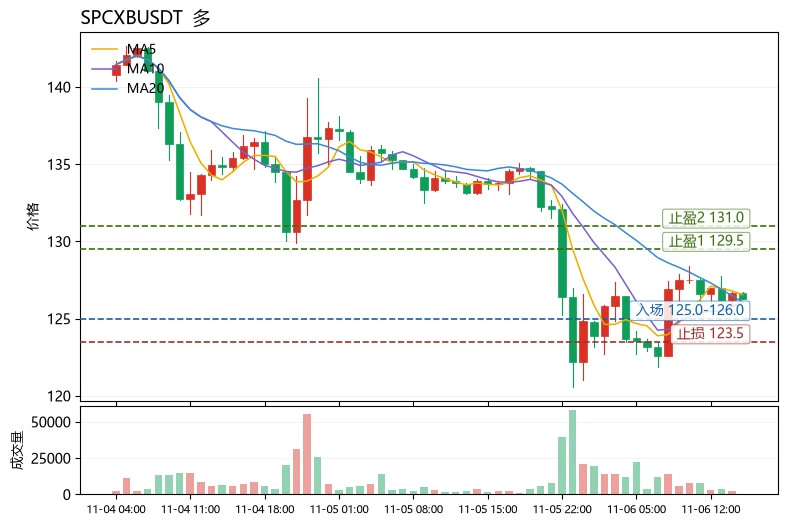
$SPCXB The most unusual detail today is not the drop, but the moving-average structure: the price fell 5.77% in 24 hours, yet MA5 remains above MA20 (126.554 versus 126.081), and the MACD histogram is still positive at +0.4746. This indicates the decline is taking place within a bullish alignment, making it a pullback rather than a trend breakdown—an ideal example for illustrating a reusable method: to judge whether a trend is healthy, first check the relative positions of the moving averages, then see whether momentum indicators are diverging, and finally use the Bollinger Bands to locate the
post-image
SPCXB
SPCXBSpaceX
Four.meme
MC:$0Holders:0
0%
WLFI-0.16%
$SNDK ‌
#USStocksFaceHistoricSelloff SNDKUSDT perpetual contract is currently exhibiting a clear bearish reversal structure on the 15-minute timeframe. Following an initial upward thrust, the asset has completed a classic Head and Shoulders topping formation, signaling a shift in market control from buyers to sellers.

Pattern Identification and Breakdown.

The price action formed a definitive three-peak structure. The initial rally created the left shoulder, followed by an aggressive push to the peak of the pattern (the head) at 879.88. The subsequent bounce failed to reach the prior high,
SNDK-22.24%
  • 8
  • 1
pump market update
live-cover
LIVE518
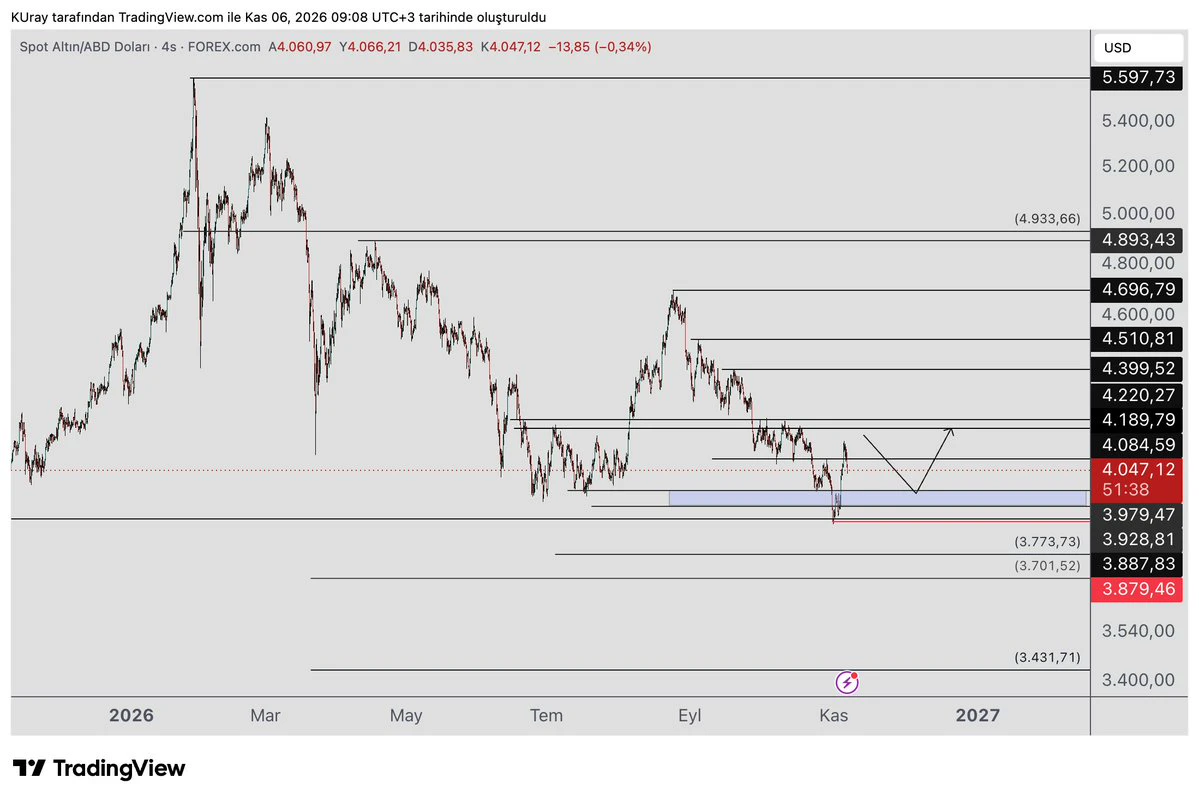
#xauusd #Altın A pullback is occurring after yesterday's rise. The pullback is forming a bullish Libra pattern.
The pattern's entry zone is the blue box at 3979-3928.
Stop: 3879. The first target is 4143, with the next targets at 4220 -4399. After that, as resistance levels are broken, the stop can be raised and the 4510- 4696- 4893-4995-5597 resistance levels can be monitored.
If the decline deepens and price stays below 3880, we can monitor the 3773-3701 zone and the 3431-3301 levels as support. A renewed attempt to rise may come if price holds at any of the support levels.
post-image
XAUUSD-1.00%
  • 1
  • 1
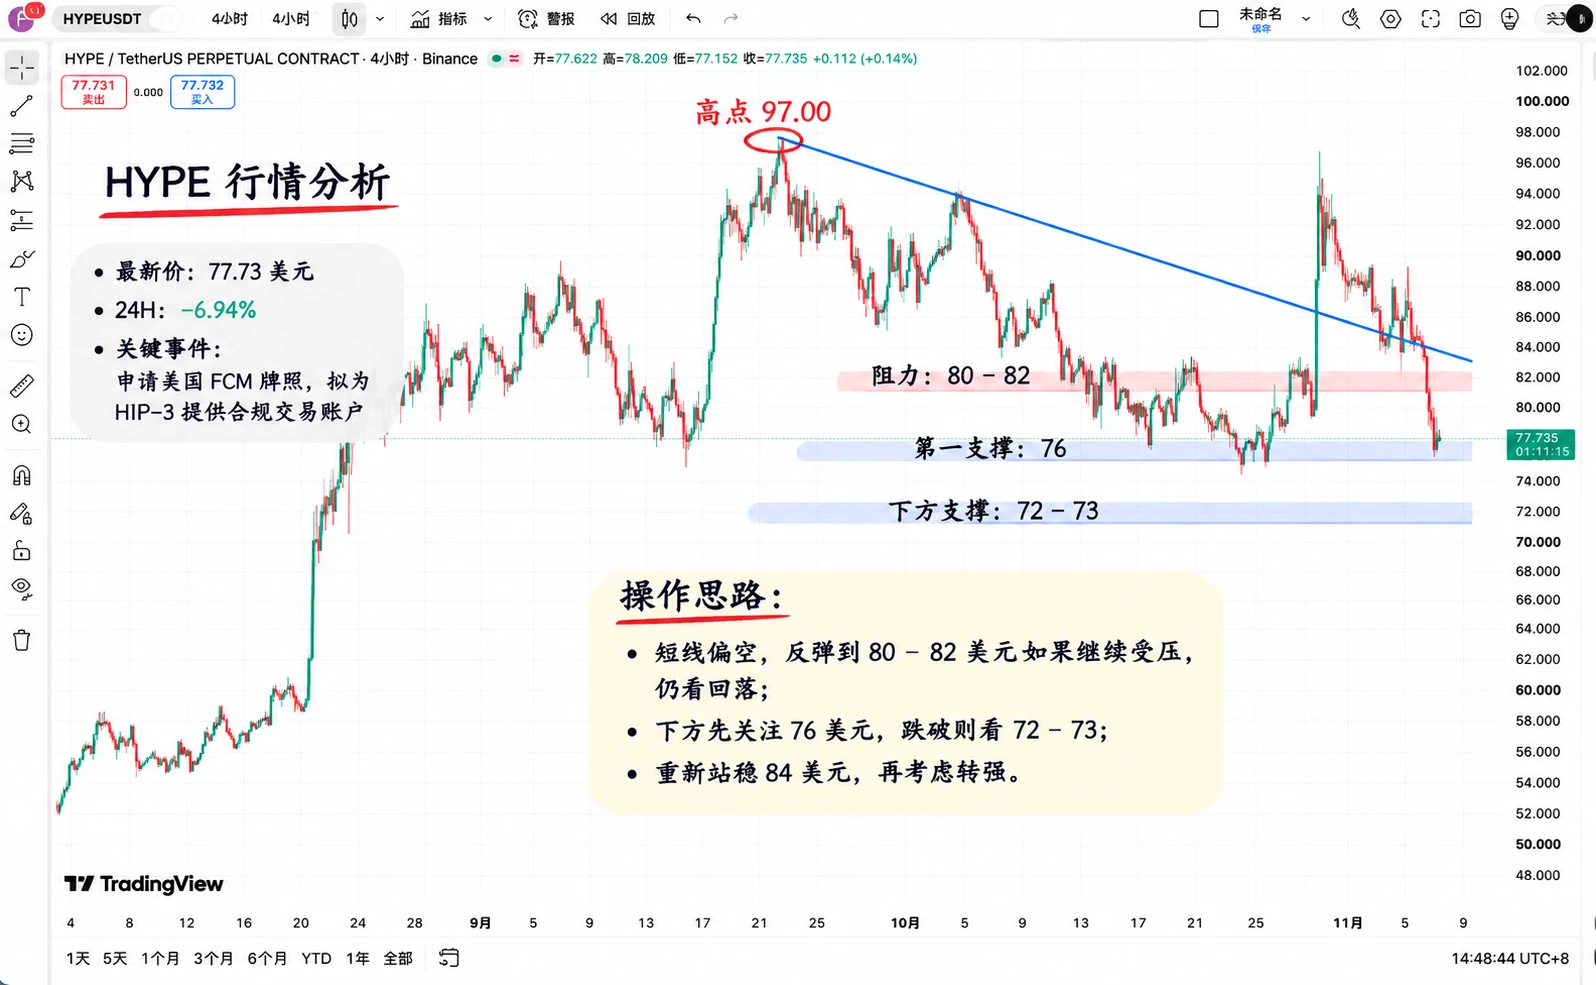
$HYPE This time it's genuinely a bit awkward! More good news from the U.S. regulated market, yet the token price fell nearly 7% and couldn't even hold $80.

On November 6, HYPE was trading at around $77.64, after falling as low as $76.24. Just a few days ago, it surged to $97; now it's given back about one-fifth of its gains.

First, the news.

Hyperliquid Strategies recently disclosed that a subsidiary is applying for U.S. futures commission merchant (FCM) status, preparing to offer compliant trading accounts for HIP-3 markets.

This is significant, but note that it's only an application and
post-image
HYPE+0.33%
BTC-0.65%
Load More

Join 40 M users in our growing community

⚡️ Join 40 M users in the crypto craze discussion

💬 Engage with your favorite top creators

👍 See what interests you

Trending Topics

USStocksFaceHistoricSelloff

2.23k Views3.59k Discussing

U.S. stocks suffered a sharp selloff on Thursday, with the Nasdaq closing down more than 5% and the Philadelphia Semiconductor Index falling over 12%. AI and chip stocks including $NVDA and $AMD were hit especially hard. Markets are reassessing AI valuations, data-center spending and future returns. Is this just short-term deleveraging, or the start of a deeper correction in the AI trade? Which sectors are you watching next?

GateLaunchesPoSECProofOfSecurity

13.06k Views580 Discussing

USNonfarmPayrolls

11.25k Views4.03k Discussing

View More