Share your thoughts
placeholder
Article
Sometimes a continuation pattern does not immediately lead to continuation
$BTC $GT $ETH $SOL $XAUT
#GateIdleEarnAutoYieldUpTo3% #gateio #AltcoinOISurpassesBitcoinforFirstTimeinOveraYear
BTC-0.93%
GT+1.42%
ETH-0.62%
SOL-1.98%
XAUT-0.06%
  • 5
While I was away using the restroom, I came back to find the candlestick chart had already wiped out my losses for me.
After lunch, I saw $MAGMA had returned to around 0.17163. It had bounced off that level several times without breaking through, and each key low was higher than the last, so I placed a long order. By the time I came back, the current price had reached 0.24465, with unrealized gains of +841.19%—the wait was worth it.
I took profit on 80% first and moved the stop-loss on the remaining 20% above the entry price. If it keeps charging, I’ll hold it; if it comes back, I won’t give t
post-image
MAGMA-1.65%
SNDK+0.20%
BTC-0.93%
This isn’t a rebound; it’s just a lifeline for an account that was about to break.
When $SKHYNIX plunged intraday, it had already dropped to 1171.00. I watched the order book for a long while: funds were quietly flowing in, with the volume still concealed and not yet released, so I flagged the long position to be established on the spot. Now it has recovered to 1338.96, with floating profit at +1018.03%. It was genuinely sluggish before, but the result is genuinely satisfying.
First close out +1018.3% and lock in the profit. Move the stop-loss for the remaining 97% up to the breakeven price, g
post-image
SKHYNIX+4.11%
DOGE-0.12%
XRP-2.02%
Smart money is quietly loading $LINK /USDT while everyone else looks away.

$LINK /USDT - LONG

Trade Plan:
Entry: 12.734 – 12.838
SL: 12.284
TP1: 13.163
TP2: 13.414
TP3: 13.790

Why this setup?
Why now? The daily trend is bullish and the 1h price sits at 12.788, giving us a clean setup. The 15m RSI at 41.36 shows room for upside before overbought territory. The 1h ATR of 0.209242 tells us volatility is enough to reach our targets without whipsaws. Entry is anchored at 12.786 with a zone between 12.734 and 12.838, TP1 at 13.163 and TP2 at 13.414, while the invalidation level at 11.785 is th
LINK-1.47%
The direction was right; the only question now is whether you can hold on. I caught this $ROBO rally, which took roughly two or three false breakouts from structural confirmation to a genuine high-volume breakout before finally holding above the level. Floating profit retraced at one point after entry, but once that bullish candle appeared, I knew the bulls had the upper hand.

Technically, I prioritize volume-price confirmation. The breakout candle had sufficient volume, and the pullback did not erase the gains, which is a relatively healthy sign. The price repeatedly tested the 0.01162 area
post-image
ROBO+0.60%
DOGE-0.12%
XRP-2.02%
A hand that set the stop-loss a few days ago trembled slightly; this morning I realized that filial piety was unnecessary. The last thing I saw before bed, $ONDO ’s rebound was weak, with obvious resistance overhead. Every time it pushed up, large orders came in to suppress it. Confirmed once more at the open, then went straight short at 0.4079.

The current price is 0.3859, +259.73%. Feels really good. Keeping a close eye on the market wasn’t in vain—I got the rhythm right.

In terms of execution, take 80% off the table first. Put the bulk in your pocket before anything else. Move the stop-
post-image
ONDO+0.08%
ETH-0.62%
BNB-1.63%
🚨 VIP SIGNAL: $DOT /USDT (SPOT & FUTURES) 🚨
Pair: $DOT /USDT
Direction: LONG 🟢
Trade Details:
Entry Zone: 1.0800 - 1.1000
Leverage: 5x - 10x
Targets:
🎯 Target 1: 1.1350
🎯 Target 2: 1.1800
🎯 Target 3: 1.2400
🎯 Target 4: 1.3000
Stop Loss:
❌ 1.0100
$DOT ‌#GateLaunchesTrenchesWith0GasFee
post-image
DOT+9.30%
  • 9
Market Alert

$BNB /USDT - SHORT

Trade Plan:
Entry: 738.7 – 740.7
SL: 749.5
TP1: 732.3
TP2: 727.4
TP3: 720.0

Why this setup?
Technical setup found.

Debate:
Thoughts?

⚠️ Personal market analysis only. NFA — manage risk and DYOR.
Educational content, not investment advice or a recommendation to buy, sell, deposit, or withdraw any asset. No paid promotion or referral/affiliate links.
BNB-1.63%
Still catching falling knives in the early hours? $ARB Did you miss out on this high-altitude profit opportunity again?
Signal: The market remained under pressure overnight, and the bearish trend is unchanged. Action: Open a 60x short in the direction of the trend, with current returns at 751%.
Don’t chase shorts as volatility intensifies at low levels. Take profits in batches to lock in gains, move the stop higher for the remaining position, secure profits, and wait for a rebound before deciding whether to stay in or exit. $AKE #BTC跌破8万美元
post-image
ARB-10.78%
AKE+22.26%
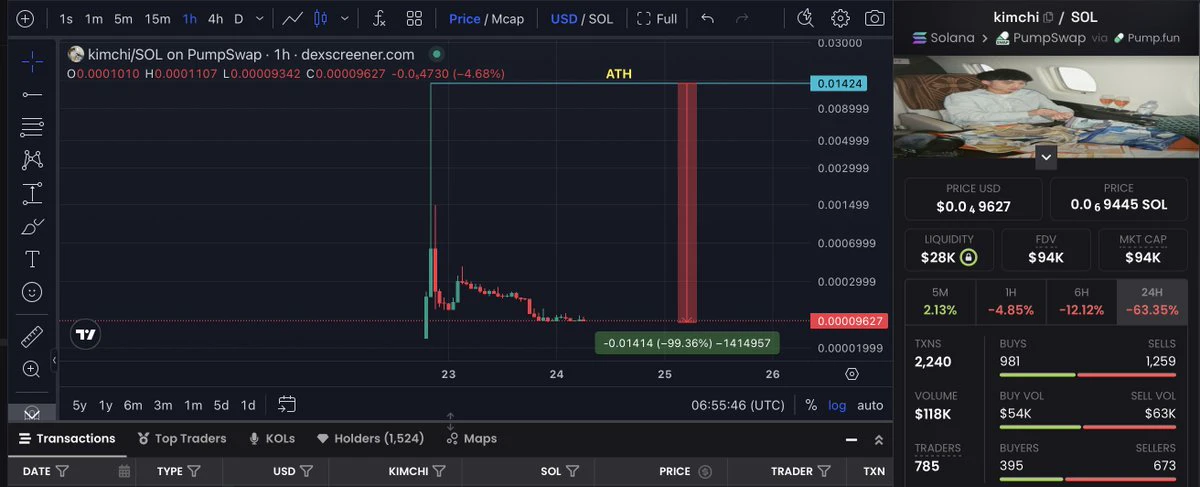
Would you buy this chart if you knew it was guaranteed to go back to ATH?
My bet has always been it will, and many other prominent Solana people agree.
Can you guess what it is?👀👀
post-image
SOL-1.98%
$$IOST 40% gain hasn't caught up? Is it still worth chasing at the 0.0010 price level? When I was watching the market last night, it surged straight through from 0.0007, with $120 million in trading volume—not something retail traders could generate. This volume-driven rally is most likely major players rotating positions, but the 0.0010 round-number level happens to be a dense area of underwater positions from earlier, so if it fails to break through in the short term, it could become a meat grinder.
Scenario analysis: If it holds above 0.0011 over the next 4 hours, it could replicate the 30%
IOST+32.01%
$FF broke through a few days ago, but I didn’t chase the move directly and only entered after waiting for a pullback confirmation. The core logic at the time was that, after breaking above a key level on heavy volume, price did not quickly fall back below it. Once that level was confirmed, there was an open area above. I placed a limit order to enter long, and the market moved relatively smoothly after entry, without any major pullback.

I took partial profits after the rally reached the first target, with roughly 70% of the position locked in at around +643.7%. For the remaining orders, I mo
post-image
FF+1.24%
SOL-1.89%
XRP-2.02%
I didn’t even do anything—I just went to the bathroom, and when I came back, the candlestick chart had already done the work for me. A few days ago, I was still watching the market before bed. $DELL had spent most of the day grinding without breaking below my entry price, with the key level at 453.65 holding firmly and funds quietly flowing in. This kind of bottoming consolidation is the easiest time to trick people into selling; I chose to hold steady.
When I opened the charts this morning, it had jumped straight to 525.22, bringing my unrealized profit to +760.31%. The sleepless nights paid
post-image
DELL+0.30%
ETH-0.62%
SNDK+0.20%
This move is so obvious I don’t even need to think—the account is dancing on its own. 💃

I didn’t chase during the intraday plunge. When everyone else is running, that’s exactly when you need to stay calm. Once $ERA bounced back to around 0.06560, selling pressure clearly strengthened and no one was taking it higher, so I followed the trend and placed a short. Those few bounces looked convincing, but it couldn’t even touch the previous high—pure weakness. If it doesn’t reach my level, I don’t trade; anything outside the plan is gambling.

I just checked and it has already touched 0.06058,
post-image
ERA+1.15%
XRP-2.02%
BNB-1.63%
I originally wanted to cut my losses and sacrifice to the heavens, but the ceremony never happened—the meat roasted itself.
$SNDK ’s rebound this time came much faster than I expected. While it was grinding out a bottom intraday, everyone was shouting that it had broken down. I panicked too, but after looking at 1500.51, I saw that funds were genuinely entering and the buying support hadn’t broken, so I decided to hold a little longer instead of selling at the bottom.
A few days ago, I was still torn when I went to bed. When I woke up this morning, the candlestick chart had already done the wor
post-image
SNDK+0.20%
SOL-1.89%
ETH-0.62%
#Altcoins
OTHERS are on the verge of breaking out of a 2-year falling wedge.
Probably nothing.👀🔥
post-image
I had just switched the software to the background, and it shot right back up—is it playing hide-and-seek with me? I kept watching during the repeated intraday swings; it held sideways at the bottom without breaking down, and buying pressure clearly strengthened, so it directly signaled opening a long position. From 1586.74 to 1787.26, a +897.72% rate of return—there’s the answer, brothers. Take profit on 80% first, and move the stop-loss on the remaining 20% to the entry price for protection, letting the profits continue to run. The market is waited out, and profits are held onto. This is not
post-image
ZEC-7.23%
ADA-0.54%
hot Topics updates
live-cover
LIVE1,128
Nobody is talking about the quiet move forming in SYMBOL right now.

$SOL /USDT - SHORT

Trade Plan:
Entry: 103.64 – 104.06
SL: 105.87
TP1: 102.33
TP2: 101.32
TP3: 99.81

Why this setup?
Why now? The 1h price is holding at 103.85 inside a tight range, and the daily trend is range, which means the market is coiling for a directional break. The 15m RSI sits at 47.23, showing neither overbought nor oversold conditions but a neutral lean that favors the short side when momentum shifts. The 1h ATR of 0.841707 confirms volatility is compressed enough to make the entry zone between 103.64 and 104.
post-image
SOL-1.89%
Layout for Bitcoin, Ethereum, and Dogecoin
live-cover
LIVE1,447
Load More

Join 40 M users in our growing community

⚡️ Join 40 M users in the crypto craze discussion

💬 Engage with your favorite top creators

👍 See what interests you

View More