
Square
Following
Hot
News
Notifications
Profile
Share your thoughts
placeholder
Article
CRYPTO MARKET UPDATES
live-cover
LIVE491
EVAA-0.49%
ETH-1.26%
SOL-0.77%
BTC-0.67%
#BTCBreaksBelow60K
Bitcoin $BTC Breaks Below $60,000 Is a Weekend Rebound Coming, or Is More Downside Ahead?

Bitcoin is facing another important test as selling pressure pushes the market into a more uncertain phase. On November 20, BTC briefly dropped below the psychologically significant $60,000 level reaching its lowest price since July, according to the figures shared in the market update. This move has caught traders' attention because $60,000 had become a major level that many investors were watching as potential support. Now that BTC has slipped below it, the biggest question is whe
post-image
BTC-0.67%
  • 4
Trenches
PIEVERSE
P
bade
b
PIEVERSE
0x0e...25a9
Market Cap
$.
Change
.
24h Vol
$.
Holders
.
FIONA
F
bade
b
FIONA
B34n...pump
Market Cap
$.
Change
.
24h Vol
$.
Holders
.
IDOL
I
bade
b
IDOL
0x3b...ab07
Market Cap
$.
Change
.
24h Vol
$.
Holders
.
Singularity
S
bade
b
Singularity
7R4M...pump
Market Cap
$.
Change
.
24h Vol
$.
Holders
.
CLAUDIA
C
bade
b
CLAUDIA
2j5S...W2ZM
Market Cap
$.
Change
.
24h Vol
$.
Holders
.
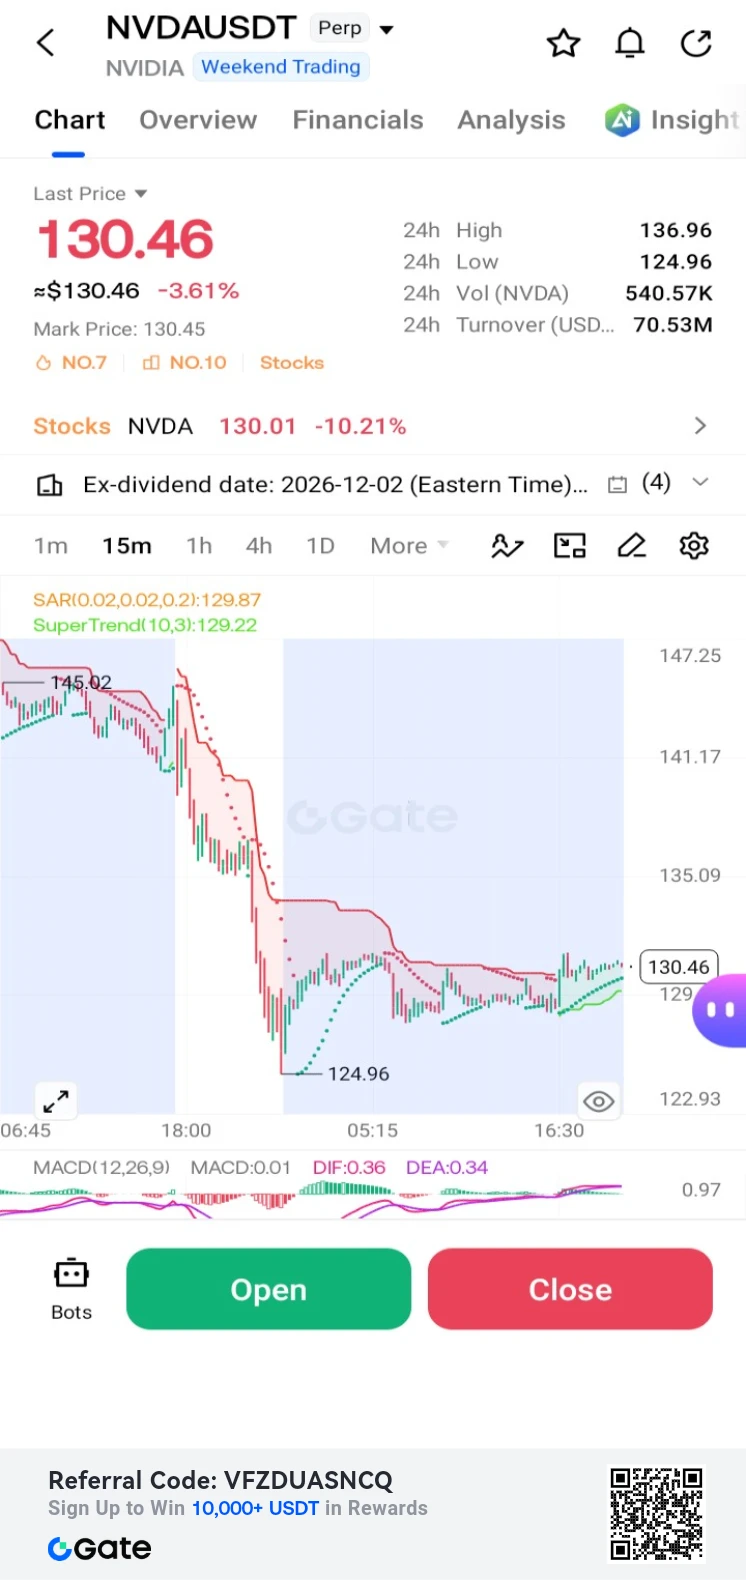
$NVDA /USDT Perp – "Volatile Rebound – Long"**
Trading Plan Long $NVDA
Entry: 130.46
SL: 124.96
TP1: 135.09
TP2: 136.96
NVDA is down -3.61% but recovering from the 124.96 low. MACD is crossing bullish; targeting a retest of the 135.09 EMA cluster.
post-image
NVDA-0.35%
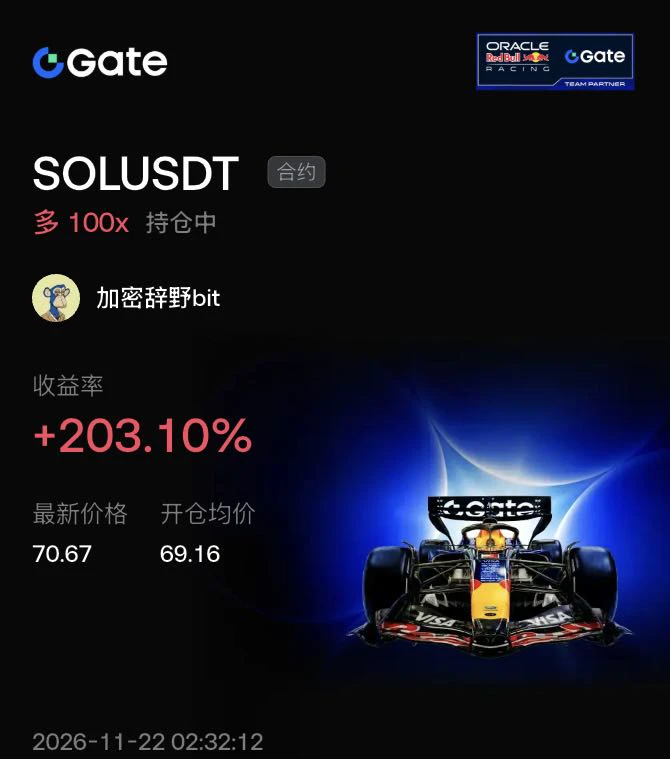
$SOL When trading, you must clearly understand the difference between higher and lower timeframes. The current rally in major coins after this sharp crash is basically just a brief recovery, so don’t mistake it for a reversal.

Look at this 1-hour chart: SOL plunged from 75 to 64.8—a brutal drop. After stabilizing at the bottom, it made a V-shaped rebound. I entered at 69, the right-side confirmation point, and went long with 100x leverage. I caught the profits from this sentiment-driven recovery, which pushed straight up to 70.67, netting 203%!

Why emphasize “brief recovery”? Because there’s
post-image
SOL-0.77%
BTC-0.65%
ETH-1.23%
  • 1
Analysis crypto coin
live-cover
LIVE2,288
ETH-1.26%
BTC-0.67%
GT-2.41%
$ARB $ARB Bullish: Price is hovering in the 0.1124–0.1129 range 👀If 0.112 holds: targets are 0.115, then 0.117. If it breaks below 0.110: this idea is invalidated. Waiting for buyers to step in. If this level fails, I’m out. - The 4-hour chart is at 0.113; this is a bounce attempt, so stop-losses are important. - BTC is short-term bullish, providing a tailwind for this idea. - Stop-loss distance: 2.4%; TP3 distance: 4.0%; if TP3 is reached, the risk-reward ratio is 1.7R. Long at 0.1124–0.1129Take profit 0.1144 / 0.1155 / 0.1172Stop-loss 0.1099Not investment advice. Please manage your position
post-image
ARB+1.17%
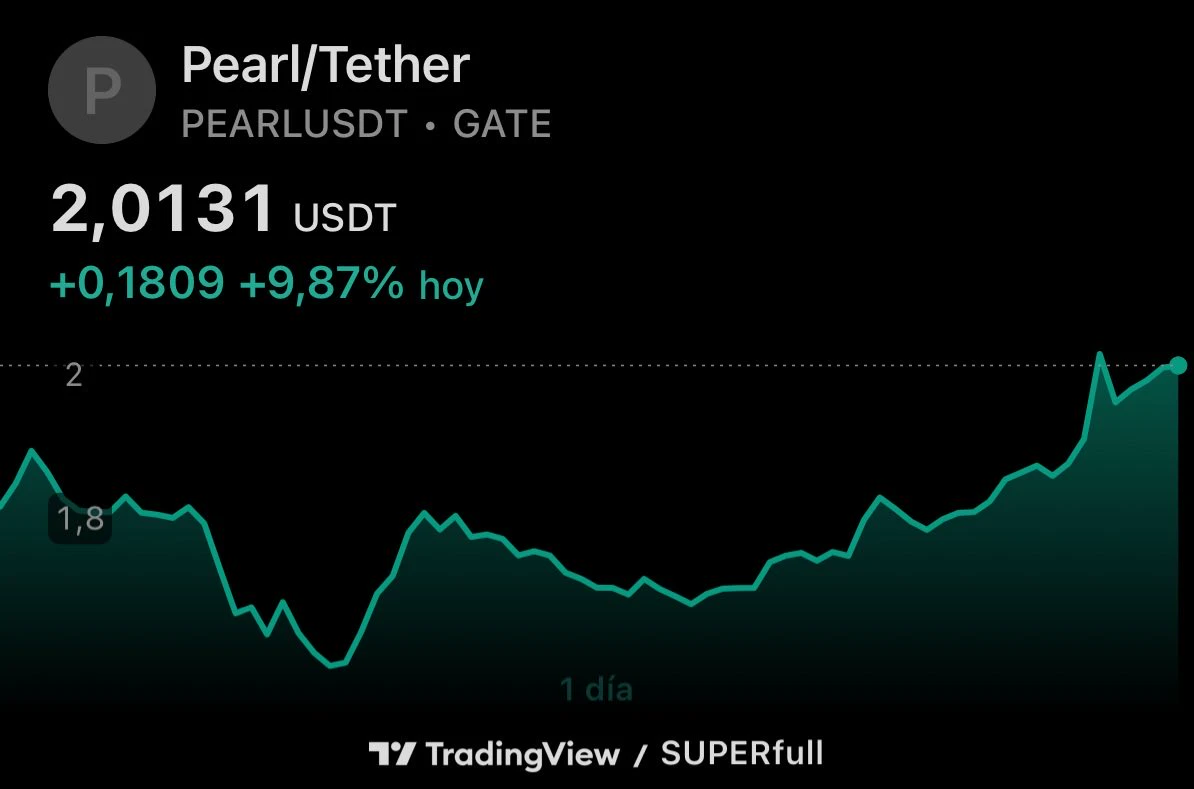
Let’s go, GPU miners—keep giving it your all!
post-image
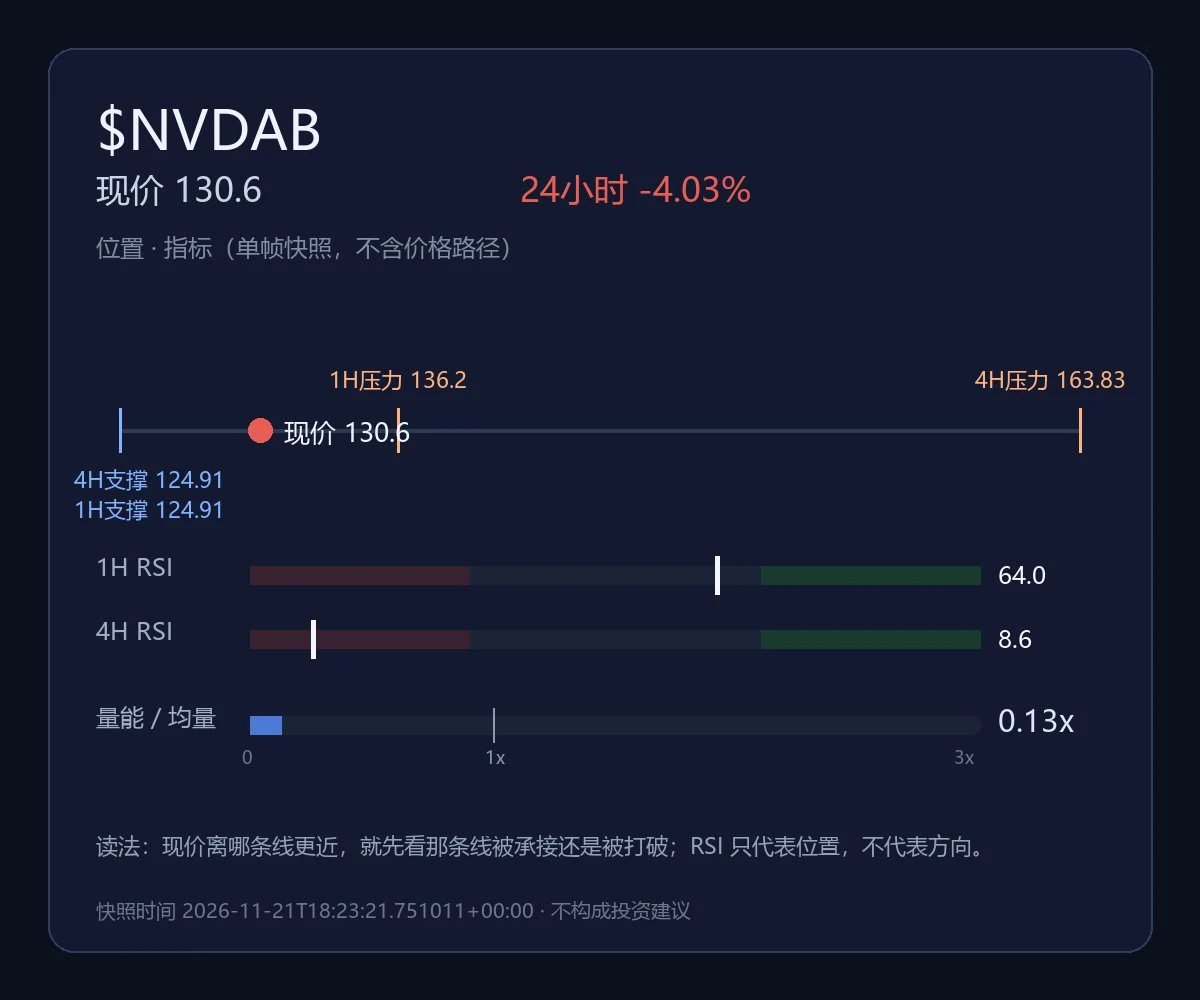
$NVDAB Has Entered Oversold Territory—Why Can’t We Say It Has Bottomed?

$NVDAB is currently trading at 130.6, down 4.027% over 24 hours, with an intraday range of 124.91‑136.77. The 1-hour and 4-hour trends are both considered weak, with the price trading below the 1-hour EMA20 at 130.74 and the 4-hour EMA20 at 139.79. The 1-hour RSI14 is 64, in neutral-to-bullish territory, while the 4-hour RSI14 is just 8.64, deeply oversold. The volume ratio is only 0.13, indicating extremely low recent trading activity. Support on both timeframes converges at 124.91. The price is hovering around that leve
post-image
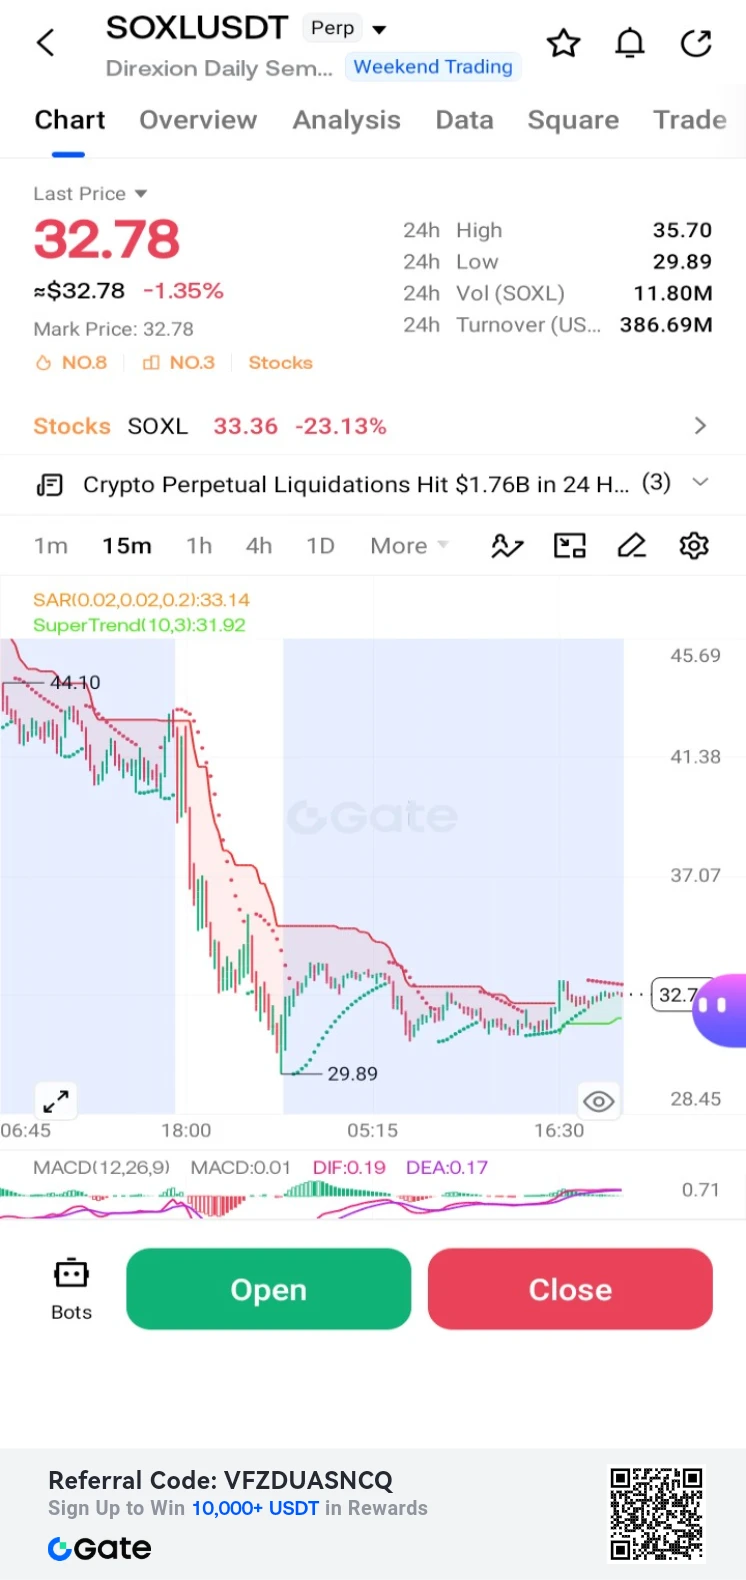
$SOXL /USDT Perp – "Oversold Bounce – Long"**
Trading Plan Long $SOXL
Entry: 32.78
SL: 29.89
TP1: 35.70
TP2: 37.07
SOXL is down -1.35% but showing a slight bounce from the 29.89 low. MACD histogram is stabilizing; targeting the 35.70 resistance.
post-image
SOXL-1.16%
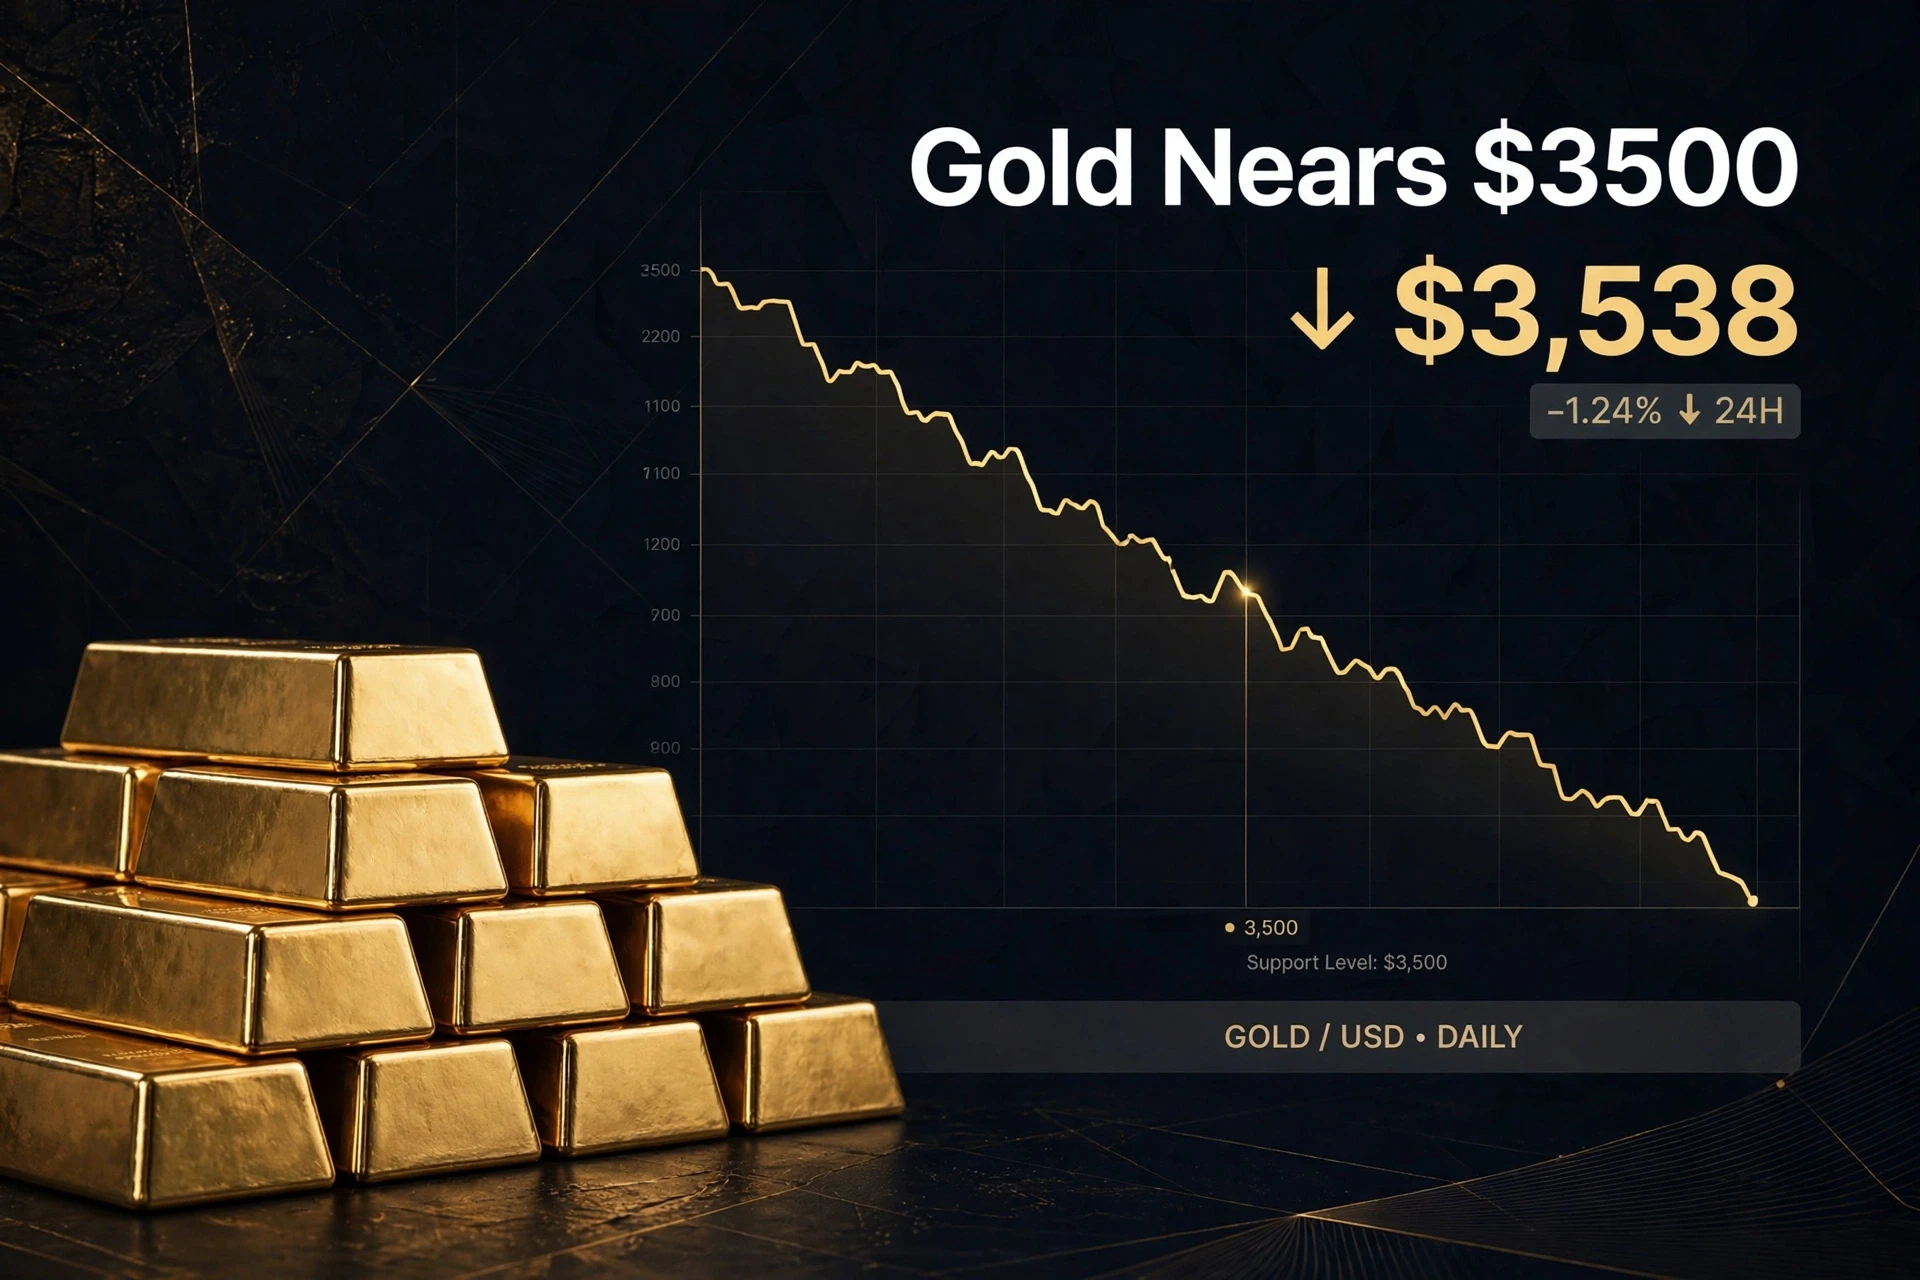
#GoldNears3500 Correction or Opportunity?*

Gold has retreated to $3,538/oz, down $35 on the day, after touching an intraday low of $3,514 — its weakest level since September 2025. In Pakistan, the correction is sharper: per tola down Rs.3,500 to Rs.376,336 today.

What's driving it?
1. Expectations of tighter US monetary policy ahead of the Dec FOMC
2. Profit-booking after a historic run
3. Liquidity rotation into tech sell-off

This is gold's worst weekly performance in 8 months, but technical levels around $3,490-$3,503 are emerging as a major liquidity zone.

Smart money isn't panicking. I
post-image
#BTCETFOutflowsExtendTo3Days

Bitcoin ETF outflows have now extended into a third consecutive day, adding another layer of pressure to an already cautious crypto market. Three straight sessions of net outflows can become an important sentiment signal because it suggests that some investors are reducing exposure to Bitcoin through regulated exchange-traded products.

The development is especially important because spot Bitcoin ETFs have become a major channel for institutional and traditional-market participation. When these products experience sustained outflows, traders naturally start watchi
post-image
BTC-5.94%
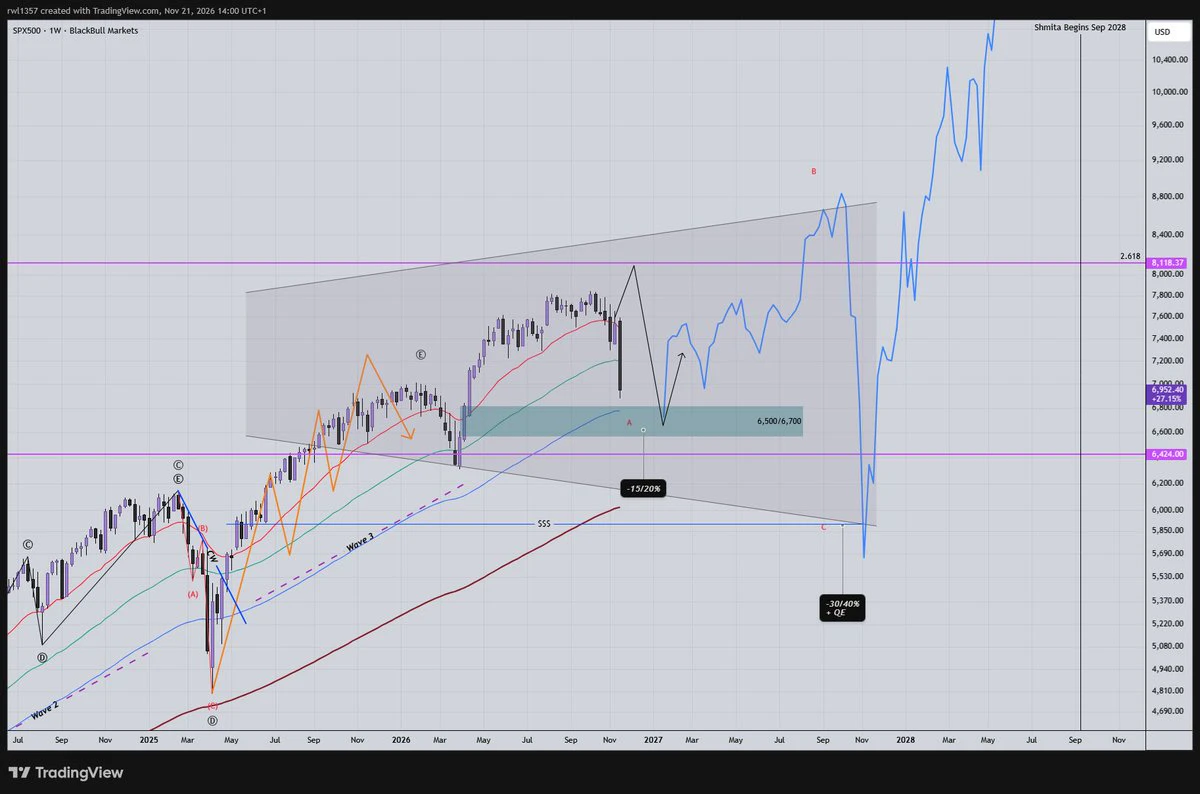
No, the AI bubble is not bursting. This correction will most likely translate back in a V shape for the stock market to a new ath as the earnings next year will remain strong. Only afterwards when nobody expects it, we can see ta reset in the AI cycle from late 2027 into 2028 where the Fed will do a QE. At the current level of interest rates, it wouldn't make any sense for a crisis to pop up out of nowhere since the rates are too elevated, first we must see several cuts that lower interest rates and accelerate AI investment before any system will break down. This has been my macro plan for thi
post-image
SPX500+0.19%
$IDOL : 10/10 signals agree. It's the trade I'd skip.

Not because I'm bearish. Because of three numbers in the same report:

1. Entry 0.0321. Daily resistance 0.0323. That's 0.6%.
Stop is 4.92% away.
0.6% of clear room for 4.92% of risk = 0.12R to the first wall.

2. RSI 83 on 1h, 85 on 4h.
The report's own line: "overbought readings often pull back first, do not chase longs into them."
Ten out of ten signals say long. The report then tells you not to enter. Both are in the same document.

3. Three consecutive bull traps — and every one led to gains.
21 Nov: wicked past 0.03065, closed 0.0305
IDOL-7.01%
BTC-0.65%
ZEC+1.29%
Crypto Market Academician: 11.22 Ethereum (ETH): Can a lower wick save the trend? Bearish alignment remains unbroken, and oversold momentum is fading!
For several days in a row, I’ve mentioned 1650 as the first step for spot positioning; the second step at 1550 has also been entered. The first medium- to long-term target is above 3000. It doesn’t matter how long I hold—in any case, it’s money I’ve set aside for my own funeral. I tried going long with futures five or six times and got stopped out. Fortunately, I always leave myself room to be wrong: if my call is wrong, I exit with a small loss
ETH-1.23%
🌐 Venezuela and the UN sat down to discuss development. And although the statement doesn’t mention crypto even once, the fine print of that conversation matters a lot to anyone moving USDT through P2P.

Foreign Minister Oliver Blanco and the UN Resident Coordinator in Venezuela, Álvaro Rodríguez, met this Friday to review the status of bilateral cooperation and, above all, discuss sustainable development projects. According to the Foreign Ministry’s press release, the conversation focused on the transition from emergency humanitarian assistance to implementing development-focused projects, st
post-image
$BTC The starting point of this trade wasn’t a call on direction, but positioning. The moment 56,000 was swept through, what was stacked below were other people’s stop losses, not my thesis. I placed my order at the lower edge of the cluster and waited for the market to burn through the fuel itself.

Only after reclaiming the round-number level and retesting without breaking lower was the structure confirmed. Until then, it was just a resting order; after that, it became a trade. The difference matters more than direction.

I barely did anything in the middle. With a high-leverage position, th
BTC-0.65%
ETH-1.23%
SNDK-0.18%
  • 2
$NVDA This stretch of the move was “leaking” down, not “getting dumped”: it opened a notch lower and closed another notch lower, with not a single bearish candle worth screenshotting for over ten hours. A dump comes with emotion and rebounds; a leak has no emotion and just inches down one tick at a time. Three rebounds, each lower than the last; the second was only half the first. The layer of sell orders overhead went from a wall to a sheet of paper. The bands are tightening. But for individual stock tokens, tightening is an after-hours effect, not structure—so the only real evidence is that
NVDA-13.84%
  • 1
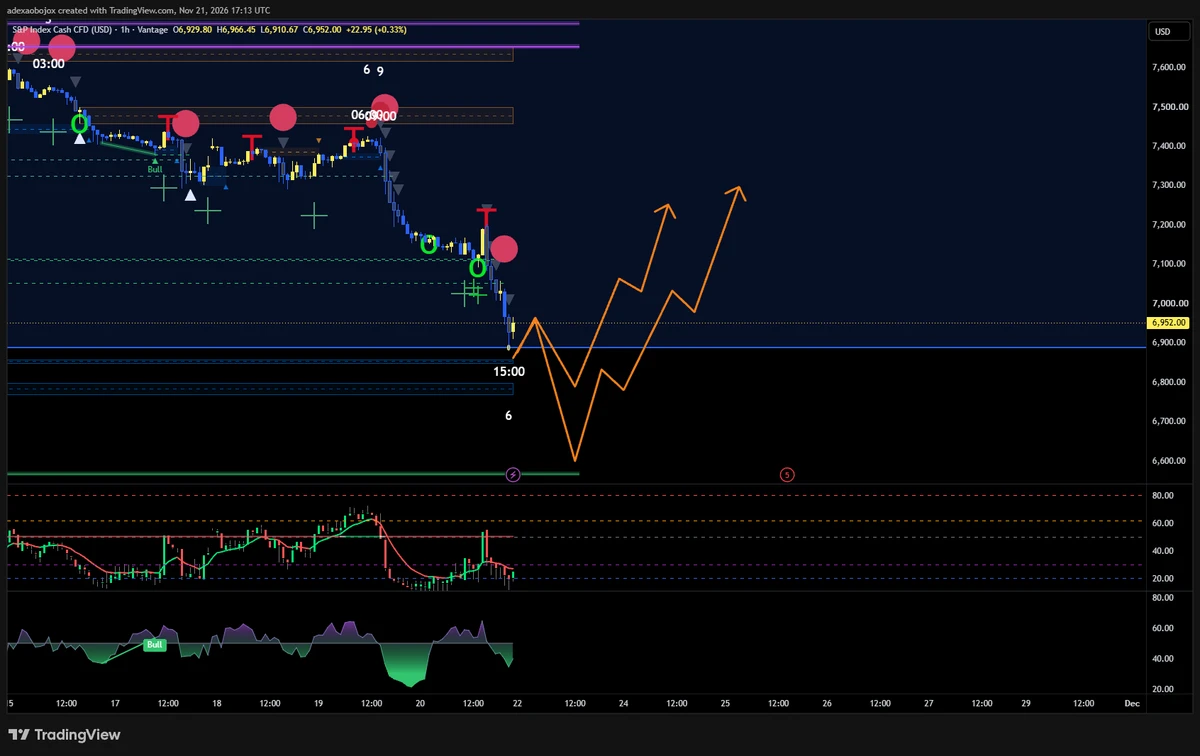
sp500 bottom will be in monday imo most likely all past 4 major dumps bottoms on mondays 6600-6800
post-image
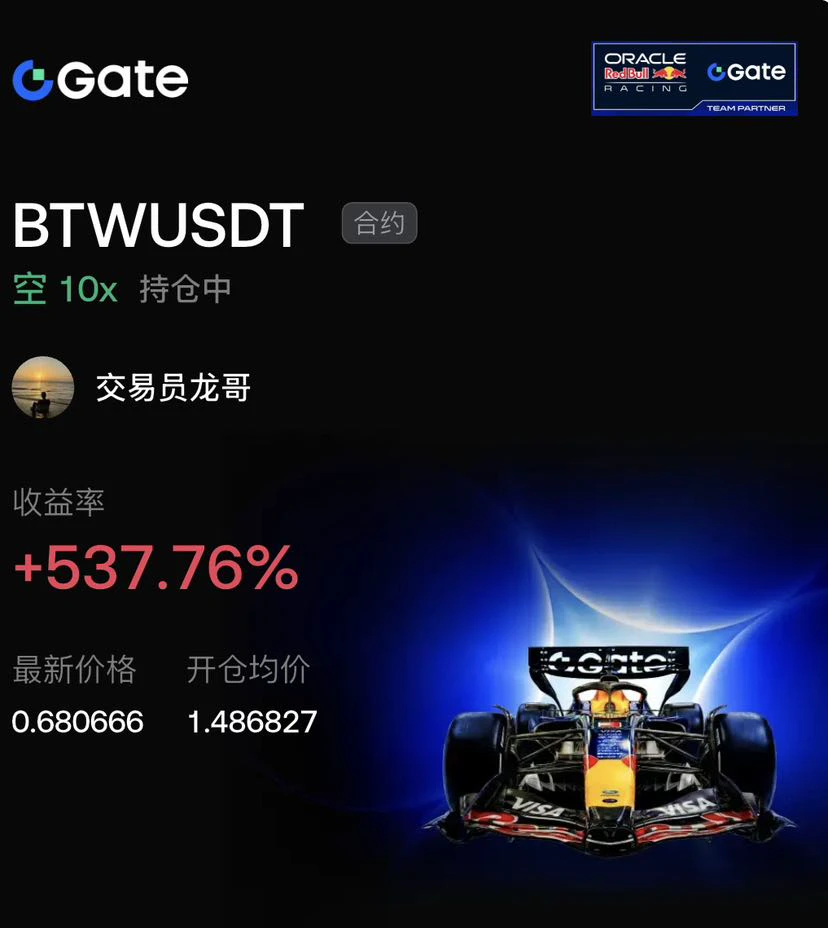
$BTW +537.76% in unrealized profit, thanks to precisely positioning for the rejection at the top. The asset was strongly rejected at 1.486827 and turned sharply downward, with a bearish moving average crossover and rising volume. I entered a 10x short, then bears drove the price down to 0.680666 in one uninterrupted major down wave. Bears are completely in control of the market.

The current profit cushion is substantial, but prices near the lows are prone to a technical recovery. Bearish sentiment is highly unanimous. At 10x leverage, a sudden wick could happen at any time, leaving no safety
post-image
BTW-7.75%
BTC-0.65%
GT-2.24%
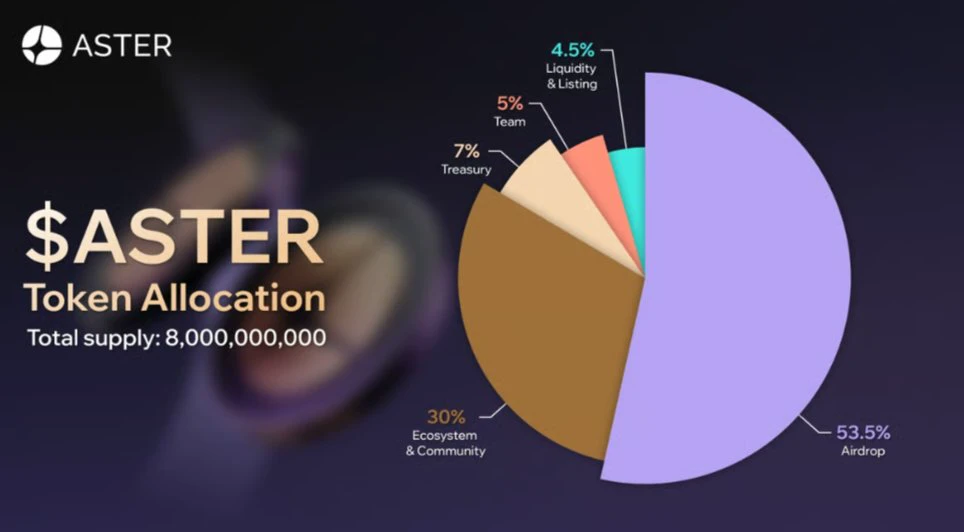
This is really legit $ASTER hurry and sign up for free
#airdrop
post-image
ASTER-0.07%
Load More

Join 40 M users in our growing community

⚡️ Join 40 M users in the crypto craze discussion

💬 Engage with your favorite top creators

👍 See what interests you

Trending Topics

BTCBreaksBelow60K

2.1M Views29.9K Discussing

BTC fell below $60,000 on November 20 for the first time since July, alongside a tech stock selloff and broader pressure on risk assets. Will $60K become resistance, or can BTC quickly reclaim it? What price or volume signals would convince you that selling pressure is easing?

GateDirectIPOPhase3ANTAllocates92100Shares

782.8K Views4.9K Discussing

NvidiaDropsNearly14Percent

328K Views7.6K Discussing

View More