











#DataCentersMayFaceOversupplyBy2028
AI Infrastructure Boom Faces a New Question: Are We Building Too Many Data Centers?
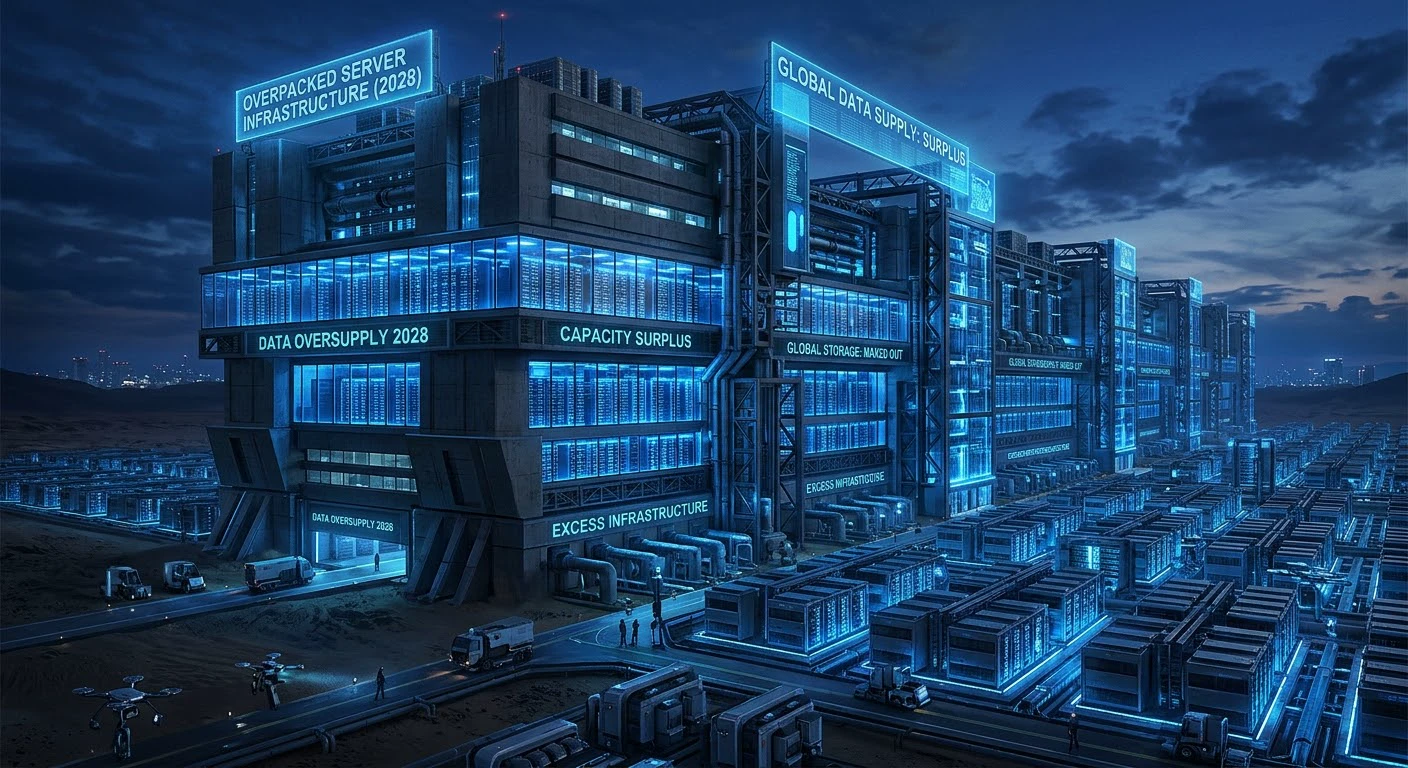
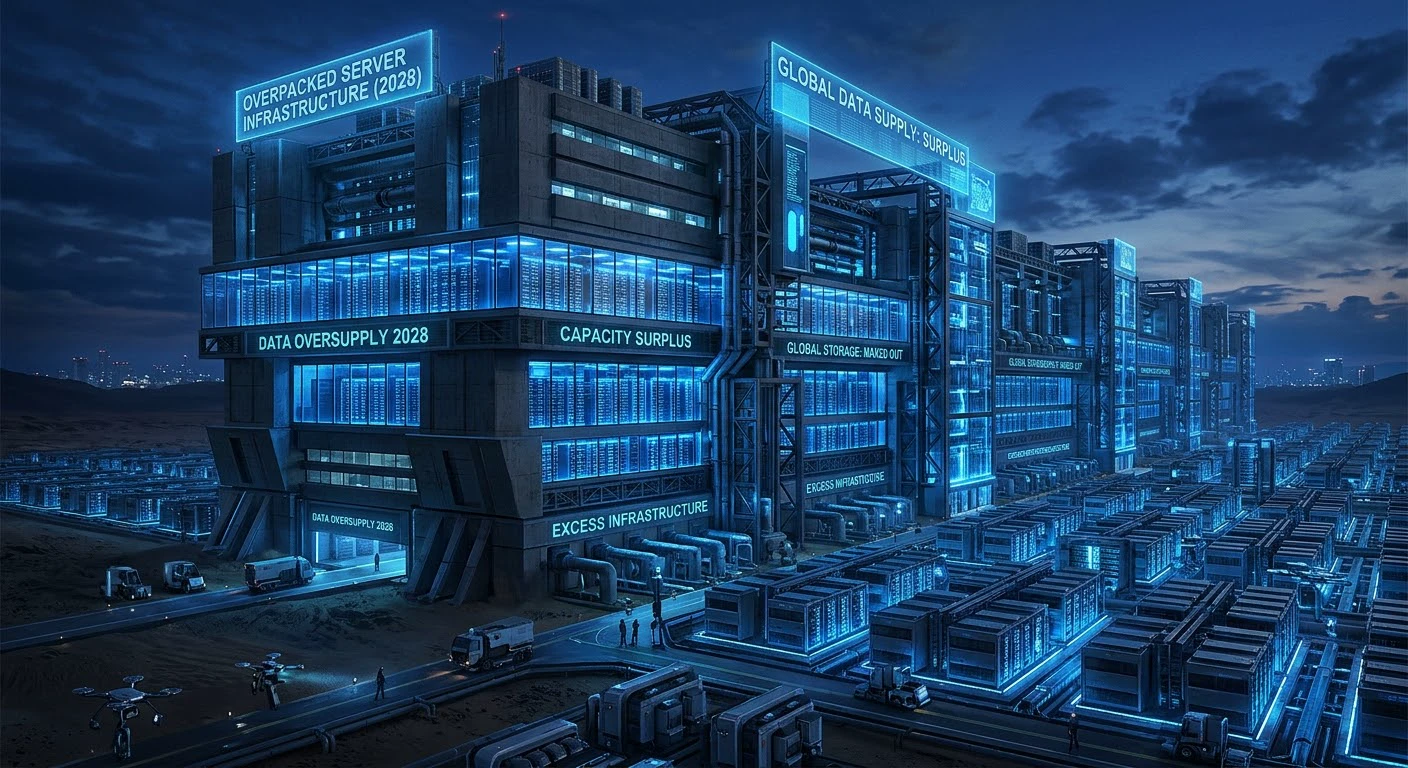
The artificial intelligence revolution is driving one of the largest infrastructure investment cycles in modern technology history. From hyperscale cloud facilities to advanced AI computing clusters, companies are racing to secure electricity, land, servers, and computing capacity. However, a new concern is emerging: could today's aggressive expansion create a data center oversupply by 2028?
The question is becoming increasingly important for technology investors, semiconductor companies, energy providers, and financial markets. The next phase of the AI boom may depend not only on how much infrastructure companies can build, but also on how much computing capacity customers actually need and can afford.
📊 The Investment Numbers Are Getting Bigger
According to a Reuters report published on October 23, 2026, Bank of America Global Research estimates that global data center spending could reach $1 trillion in 2026 and $2.1 trillion by 2028. This forecast illustrates the enormous scale of investment flowing into AI infrastructure.
The spending boom is supported by growing demand for cloud services, generative AI applications, advanced computing, and enterprise automation. Technology giants are investing heavily to maintain their competitive positions and ensure access to the infrastructure needed for future AI products.
Yet rapid investment does not automatically guarantee equally rapid revenue growth. If new capacity comes online faster than demand develops, operators could face lower utilization rates, pricing pressure, and weaker returns on capital.
Source: Reuters — Data center spending forecast.
⚡ Why Could Oversupply Become a Problem?
The potential risk comes from a mismatch between infrastructure construction and actual computing demand.
First, AI companies and cloud providers are committing substantial capital to new facilities. If several large projects become operational around the same time, available capacity could rise faster than customer requirements.
Second, AI hardware availability and electricity access are changing. Developers that previously struggled to obtain computing equipment may find that the main challenge has shifted toward securing reliable power and completing infrastructure projects.
Third, AI monetization remains a critical variable. Businesses must turn AI usage into sustainable revenue to justify the cost of operating expensive computing systems.
Finally, competition could intensify. If multiple providers offer similar computing capacity, customers may gain greater negotiating power, putting pressure on rental prices and profit margins.
🤖 Why the Oversupply Forecast Is Not Guaranteed
It is important to distinguish a possible future surplus from today's market conditions.
CBRE reported in June 2026 that vacancy across the 16 largest global data center markets stood at just 6.7% in the first quarter of 2026, down from 8.3% a year earlier. That indicates strong demand relative to available capacity in those markets.
Meanwhile, JLL's 2026 outlook projects substantial global capacity growth through 2030, driven by AI and cloud computing. These forecasts demonstrate that the industry still has significant expansion potential.
The real issue is timing. A market can experience shortages today and oversupply in particular regions or infrastructure segments tomorrow. Demand for AI computing may continue rising while some projects still struggle with financing, electricity connections, or customer commitments.
Sources: CBRE Global Data Center Trends and JLL Global Data Center Outlook.
📉 What Could This Mean for Technology Stocks?
An oversupply scenario could create pressure across several sectors.
Semiconductor manufacturers could face slower orders if cloud providers delay equipment purchases. Data center operators might experience lower rental rates or underutilized facilities. Companies with high debt and aggressive expansion plans could become particularly vulnerable if expected revenues fail to materialize.
However, the impact would not necessarily be negative for every company. Cloud customers could benefit from lower computing prices, while efficient operators with strong balance sheets, reliable electricity access, and long-term contracts could maintain competitive advantages.
Energy infrastructure, cooling systems, grid equipment, and power generation may also continue to attract investment even if some data center projects are delayed.
🔮 My Market Outlook: Cautious, but Not Bearish on AI
The possibility of oversupply by 2028 deserves attention, but it should be treated as a risk scenario rather than an established outcome.
The most important indicators to monitor are capital expenditure guidance, contracted versus speculative capacity, data center vacancy rates, AI revenue growth, electricity availability, and the utilization of newly built facilities.
If infrastructure spending continues accelerating while monetization disappoints, the market could experience a correction. If AI adoption and revenue grow fast enough to absorb new capacity, the current investment cycle could remain sustainable.
Final takeaway: The AI revolution is real, but not every infrastructure investment will necessarily deliver attractive returns. By 2028, the winners may be companies that combine technological leadership with disciplined spending, dependable power, and proven customer demand.
#DataCentersMayFaceOversupplyBy2028
AI Infrastructure Boom Faces a New Question: Are We Building Too Many Data Centers?
The artificial intelligence revolution is driving one of the largest infrastructure investment cycles in modern technology history. From hyperscale cloud facilities to advanced AI computing clusters, companies are racing to secure electricity, land, servers, and computing capacity. However, a new concern is emerging: could today's aggressive expansion create a data center oversupply by 2028?
The question is becoming increasingly important for technology investors, semiconductor companies, energy providers, and financial markets. The next phase of the AI boom may depend not only on how much infrastructure companies can build, but also on how much computing capacity customers actually need and can afford.
📊 The Investment Numbers Are Getting Bigger
According to a Reuters report published on October 23, 2026, Bank of America Global Research estimates that global data center spending could reach $1 trillion in 2026 and $2.1 trillion by 2028. This forecast illustrates the enormous scale of investment flowing into AI infrastructure.
The spending boom is supported by growing demand for cloud services, generative AI applications, advanced computing, and enterprise automation. Technology giants are investing heavily to maintain their competitive positions and ensure access to the infrastructure needed for future AI products.
Yet rapid investment does not automatically guarantee equally rapid revenue growth. If new capacity comes online faster than demand develops, operators could face lower utilization rates, pricing pressure, and weaker returns on capital.
Source: Reuters — Data center spending forecast.
⚡ Why Could Oversupply Become a Problem?
The potential risk comes from a mismatch between infrastructure construction and actual computing demand.
First, AI companies and cloud providers are committing substantial capital to new facilities. If several large projects become operational around the same time, available capacity could rise faster than customer requirements.
Second, AI hardware availability and electricity access are changing. Developers that previously struggled to obtain computing equipment may find that the main challenge has shifted toward securing reliable power and completing infrastructure projects.
Third, AI monetization remains a critical variable. Businesses must turn AI usage into sustainable revenue to justify the cost of operating expensive computing systems.
Finally, competition could intensify. If multiple providers offer similar computing capacity, customers may gain greater negotiating power, putting pressure on rental prices and profit margins.
🤖 Why the Oversupply Forecast Is Not Guaranteed
It is important to distinguish a possible future surplus from today's market conditions.
CBRE reported in June 2026 that vacancy across the 16 largest global data center markets stood at just 6.7% in the first quarter of 2026, down from 8.3% a year earlier. That indicates strong demand relative to available capacity in those markets.
Meanwhile, JLL's 2026 outlook projects substantial global capacity growth through 2030, driven by AI and cloud computing. These forecasts demonstrate that the industry still has significant expansion potential.
The real issue is timing. A market can experience shortages today and oversupply in particular regions or infrastructure segments tomorrow. Demand for AI computing may continue rising while some projects still struggle with financing, electricity connections, or customer commitments.
Sources: CBRE Global Data Center Trends and JLL Global Data Center Outlook.
📉 What Could This Mean for Technology Stocks?
An oversupply scenario could create pressure across several sectors.
Semiconductor manufacturers could face slower orders if cloud providers delay equipment purchases. Data center operators might experience lower rental rates or underutilized facilities. Companies with high debt and aggressive expansion plans could become particularly vulnerable if expected revenues fail to materialize.
However, the impact would not necessarily be negative for every company. Cloud customers could benefit from lower computing prices, while efficient operators with strong balance sheets, reliable electricity access, and long-term contracts could maintain competitive advantages.
Energy infrastructure, cooling systems, grid equipment, and power generation may also continue to attract investment even if some data center projects are delayed.
🔮 My Market Outlook: Cautious, but Not Bearish on AI
The possibility of oversupply by 2028 deserves attention, but it should be treated as a risk scenario rather than an established outcome.
The most important indicators to monitor are capital expenditure guidance, contracted versus speculative capacity, data center vacancy rates, AI revenue growth, electricity availability, and the utilization of newly built facilities.
If infrastructure spending continues accelerating while monetization disappoints, the market could experience a correction. If AI adoption and revenue grow fast enough to absorb new capacity, the current investment cycle could remain sustainable.
Final takeaway: The AI revolution is real, but not every infrastructure investment will necessarily deliver attractive returns. By 2028, the winners may be companies that combine technological leadership with disciplined spending, dependable power, and proven customer demand.
#DataCentersMayFaceOversupplyBy2028