Share your thoughts
placeholder
Article
🛍️ QOMEX Summit returns to Dubai on 9 September 2026.
Its second edition will examine how AI, personalization and connected infrastructure are changing digital commerce, with 200+ senior leaders expected.
🤖 AI agents and automated customer journeys
⚡ Quick commerce and omnichannel operations
🔗 Data, payments and API-first platforms
📍 Al Habtoor Grand Resort, Autograph Collection, Marina, Dubai
Full announcement on BTCWire:
$BULLA Signal】Long | 1H MACD Momentum Restart
$BULLA RSI 1H 68.78, MACD histogram turns positive and expands, with price moving above 0.0739. The 4H Bollinger upper band is opening upward, order book bid depth has a slight edge, Bid/Ask 1.04. OI is flat, funding rate 0.08%, and short-term upward momentum is still expected.
🎯Direction: Long
⚡Entry/Orders: 0.07371220 - 0.07393400
🛑Stop-loss: 0.07023730
🚀Target 1: 0.07947905
🚀Target 2: 0.08225157
🛡️Trade Management:
- After reaching Target 1, reduce the position by 50% and move the stop-loss up to breakeven. If the price falls back to the e
post-image
BULLA+202.01%
BTC+0.83%
ETH+1.43%
SOL+2.87%
I'm out of ideas; it feels intentional.
post-image
  • 1
📊 MARKET: The crypto market added $14B in less than 24 hours, signaling a fresh increase in market strength.
With capital flowing back into digital assets, traders are watching whether this momentum can continue and push major cryptocurrencies toward new highs.
$BTC $ETH $BNB $SOL
#Gate60MillionUsers
post-image
BTC-2.35%
ETH-2.49%
BNB+8.42%
SOL+2.84%
  • 9
  • 2
I originally only wanted to mooch a breakfast, but the market ended up trapping me in a six-month grind. I opened the chart this morning, and $SNDK ripped straight up from the 1503.37 area, without even giving me time to hesitate.

I had my eye on it during those days of bottom consolidation. Capital was quietly flowing in, key levels kept moving higher, and pullbacks never broke structure. I was actually worried that going long would make me grind through another round, but thankfully it didn't pull any tricks this time.

Now at 1761.84, +1220.73% secured. This run feels incredible—it's li
post-image
SNDK+2.91%
SOL+2.84%
DOGE+6.86%
#Gate事件合约晒单挑战
GT BREAKS ABOVE $9
GT has entered a much more important technical zone after breaking through the $9 psychological level. With GT trading around $9.15, the token is now holding above a level that previously acted as a major resistance reference. The key question is no longer whether GT can reach $9 it is whether buyers can turn $9 into sustainable support and build the next leg higher.
THE BREAKOUT STRUCTURE
The move from the recent $8 area toward $9+ represents a strong short-term expansion. Recent market data shows GT previously reached around $8.65 before pulling back, while
post-image
GT+12.05%
The privacy sector all moved today, but it has shifted from broad-based gains to divergence.
ZEC 1,027 (weekly +23.98%, MACD above the zero line, trend phase)
DASH 68.16 (+9.02%, volume 11.2x average)
LTC 54.70 (+7.7%, following the rally)
ZEN 7.085 (−0.7%, the only one to close down)
DASH touched a high of 74.63 before falling back to 68.16, with the upper wick accounting for half of the day's range. 11x volume combined with a long upper wick = high-level turnover, not a breakout.
$ZEC $DASH
post-image
ZEC+3.21%
DASH+21.40%
LTC+9.08%
ZEN0.00%
MARKET ALERT - TUT/USDT
Analysis and Trading Opportunities.
​1-Hour Timeframe (1H)
The price briefly pumped sharply to 0.029941 but was halted by the strong resistance of EMA 200 (0.030914) and is now undergoing a healthy correction. The short-term trend remains bullish as the price is above EMA 20 (0.026203) and EMA 50 (0.025413).
​Buy on Dip Strategy: Wait for a correction toward the EMA 20 support area (0.0260 – 0.0262).
​Target: Re-test the 0.0299 to 0.0309 area.
​Stop Loss: Below 0.0254 (EMA 50).
​4-Hour Timeframe (4H)
The macro trend remains in a dominant downtrend phase (EMA 20, 50, and
TUT+11.12%
  • 5
Everyone’s staring at BNB’s 772.5—but the real trap is hiding in a 15-minute RSI that just screamed 70.75.

$BNB /USDT - SHORT

Trade Plan:
Entry: 770.7 – 774.3
SL: 789.8
TP1: 759.5
TP2: 750.9
TP3: 737.9

Why this setup?
- The 4h signal says SHORT, yet 1D is range—this isn’t a trend trade, it’s a scalp war.
- RSI 15m at 70.75 = overheated micro-momentum; that’s the exact fuel for a flush toward TP1 (759.5) before TP2 (750.9).
- ATR 1h at 7.2 means we have room to move—but only if price respects the 770.7–774.3 entry zone.
- Why now? The “waiting” status + range day = indecision. The f
BNB+8.42%
Join Sixr and stand a chance to be among the top 4000 to share a $2,000,000 airdrop.
Simply click the link:
It will open telegram
Connect X and begin to complete tasks.
Tasks are simple.
Predicting matches, spinning, playing, and participating in social tasks.
post-image
AIRDROP-3.86%
Most traders will fade this 95% confidence SHORT on $SKYAI /USDT—that’s exactly why you’ll win.

$SKYAI /USDT - SHORT

Trade Plan:
Entry: 0.05937 – 0.05999
SL: 0.06263
TP1: 0.05747
TP2: 0.05600
TP3: 0.05379

Why this setup?
- 4h MTF says SHORT, 1D trend is bearish—this isn’t a scalp, it’s a structural dump.
- RSI 15m at 51.85 is neutral, giving price room to drop without being oversold.
- Entry ref 0.05968, SL at 0.06263 (risk ~4.9%)—but TP1 at 0.05747 is a 3.7% move, TP3 at 0.05379 is a 9.8% drop.
- ATR 1h at 0.001228 means volatility is low—breakdowns here tend to be fast and violen
SKYAI+5.21%
Everyone’s staring at the 15m RSI (52.7)—but that’s the decoy. ESPORTS is about to drop the real trap.

$ESPORTS /USDT - SHORT

Trade Plan:
Entry: 0.01477 – 0.01485
SL: 0.01523
TP1: 0.01449
TP2: 0.01428
TP3: 0.01396

Why this setup?
- 4h bias is SHORT with 95% confidence—this isn’t a guess, it’s a weighted verdict.
- Daily trend is bearish; the 1h ATR (0.000177) shows volatility is compressing—breakouts are violent.
- Entry zone 0.01481–0.01485 sits right under the invalid line (0.01532). Why now? Because the bounce to 52.7 RSI is the “hope pump” that usually precedes the flush.
- Tar
ESPORTS+1.37%
#Bots beautiful pump.
#sol $btc
post-image
SOL+2.87%
BTC+0.83%
Everyone’s staring at SOL’s 103.1—but the real trap is hiding in the 15-minute RSI.

$SOL /USDT - SHORT

Trade Plan:
Entry: 103.0 – 103.2
SL: 104.5
TP1: 102.1
TP2: 101.4
TP3: 100.4

Why this setup?
• RSI at 61.91 on the 15m screams overbought *before* the 4h rejection zone—this is a classic fade setup.
• Trend is range-bound on 1D, so 103.1 is the pivot: shorts target 102.1 (TP1) and 101.4 (TP2), while invalidation sits at 102.3.
• Why now? ATR (0.56) shows low volatility—meaning the squeeze is building, and the first move past 103.2 likely triggers the cascade.

Debate:
Do you trust t
post-image
SOL+2.84%
Why is $ETH /USDT whispering lower while everyone’s still staring at the green 15m RSI?

$ETH /USDT - SHORT

Trade Plan:
Entry: 2455.54 – 2460.20
SL: 2480.25
TP1: 2441.08
TP2: 2429.89
TP3: 2413.11

Why this setup?
A 4h short setup is live at 2457.87, but the invalidation line sits just 2.28 points above—tight, explosive.
- RSI (15m) at 58.3 shows a weak bounce, not a trend shift.
- ATR (1h) at 9.32 means small candles; the range 1D trend is compressing.
- Why now? The entry window (2455.54–2460.20) is a knife’s edge: break above 2460.15 kills the short; hold below, and TP1 at 2441.08
ETH+1.36%
With this trend, I don’t even need to think—the account is dancing on its own.

During the repeated intraday swings, $ZEC kept getting shaken back and forth within a small range, testing most people’s patience. But I noticed one detail: funds quietly stepped in to catch every dip, and the bottom kept rising. This isn’t an unwanted asset—it’s building up strength.

After confirming that it had stabilized, the entry level was 833.19. Looking at it now, it has already reached 1020.2, and calculating the return of +1593.05%, it feels incredibly satisfying. The first half was enough to make you
post-image
ZEC+2.63%
DOGE+6.86%
SOL+2.84%
Nobody’s watching ZEC while it quietly prints a 95% confidence long setup.

$ZEC /USDT - LONG

Trade Plan:
Entry: 1020.16 – 1028.06
SL: 986.17
TP1: 1052.57
TP2: 1071.54
TP3: 1100.00

Why this setup?
Why now?
- 1D trend is bullish, and price is holding above the 4h entry ref at 1,024.
- RSI (15m) at 53 shows room to run—not overheated, not dead.
- ATR (15.8) says volatility is ripe for a squeeze toward TP1 (1,052) and TP2 (1,071).
- Invalidation sits at 986—risk is defined, upside is 7%+.

Debate:
Are you fading this ZEC breakout or riding it to TP2 before the weekend close?

⚠️ Pe
ZEC+2.63%
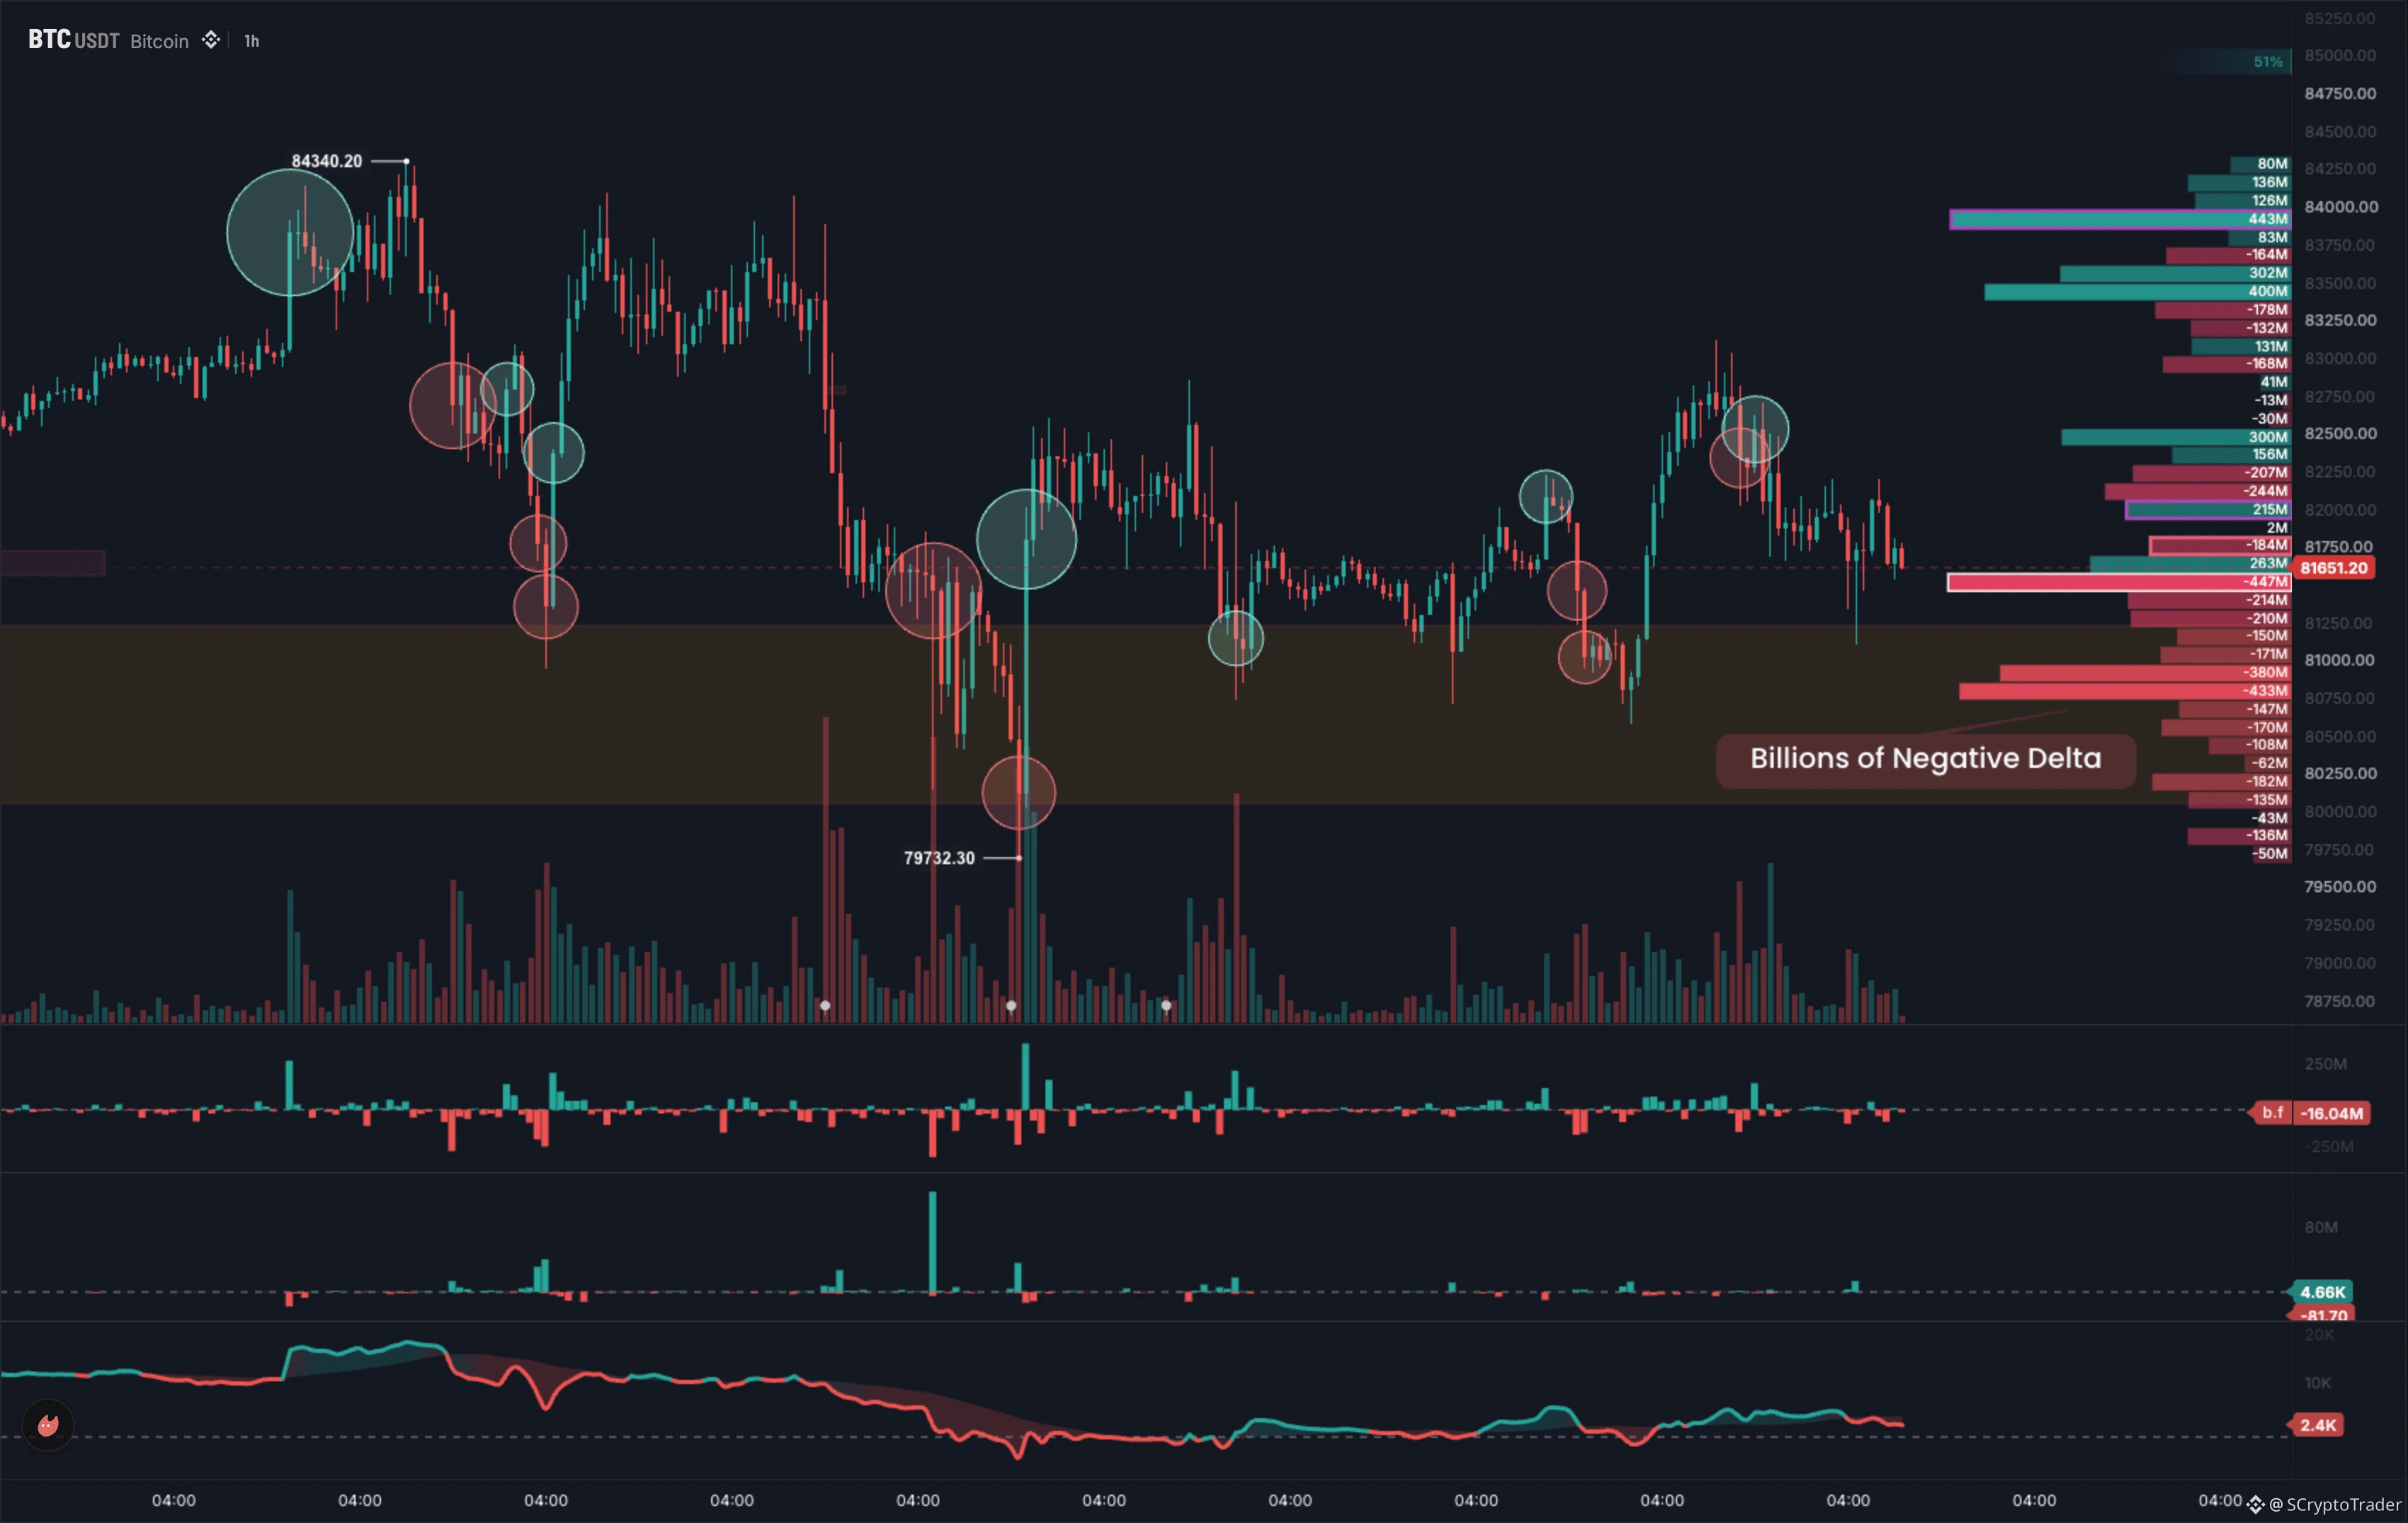
BTC is currently around $79.9K. The short-term structure is neutral-to-bullish, but BTC is facing strong resistance around $82K–$83K. Bullish above $82.8K: breakout confirmation → $85K–$90K possible.
Between $79K–$82K: likely consolidation/choppy movement. Avoid over-leveraged entries.
Below $79K: pullback risk increases toward $75.7K. #BTCReclaims80K $BTC
post-image
BTC+0.83%
Layout for Bitcoin, Ethereum, and Dogecoin
live-cover
LIVE2,460
  • 1
Crypto Market Update
live-cover
LIVE354
Load More

Join 40 M users in our growing community

⚡️ Join 40 M users in the crypto craze discussion

💬 Engage with your favorite top creators

👍 See what interests you

View More