Square
Following
Hot
News
Profile
Share your thoughts
placeholder
Article
#GoogleCloudSurges103%ButStockFalls
The recent Q3 earnings report from Google provides a clear example of the tension between long-term technological expansion and immediate financial realities. The cloud division achieved a 103% year-over-year revenue surge, largely driven by artificial intelligence. However, net profit declined by 25%, free cash flow turned negative, and the stock price dropped more than 10% after hours. This contradiction raises a fundamental question: what does the market value more right now?
Based on the immediate stock market reaction, it is evident that actual earning
post-image
GOOGL-1.32%
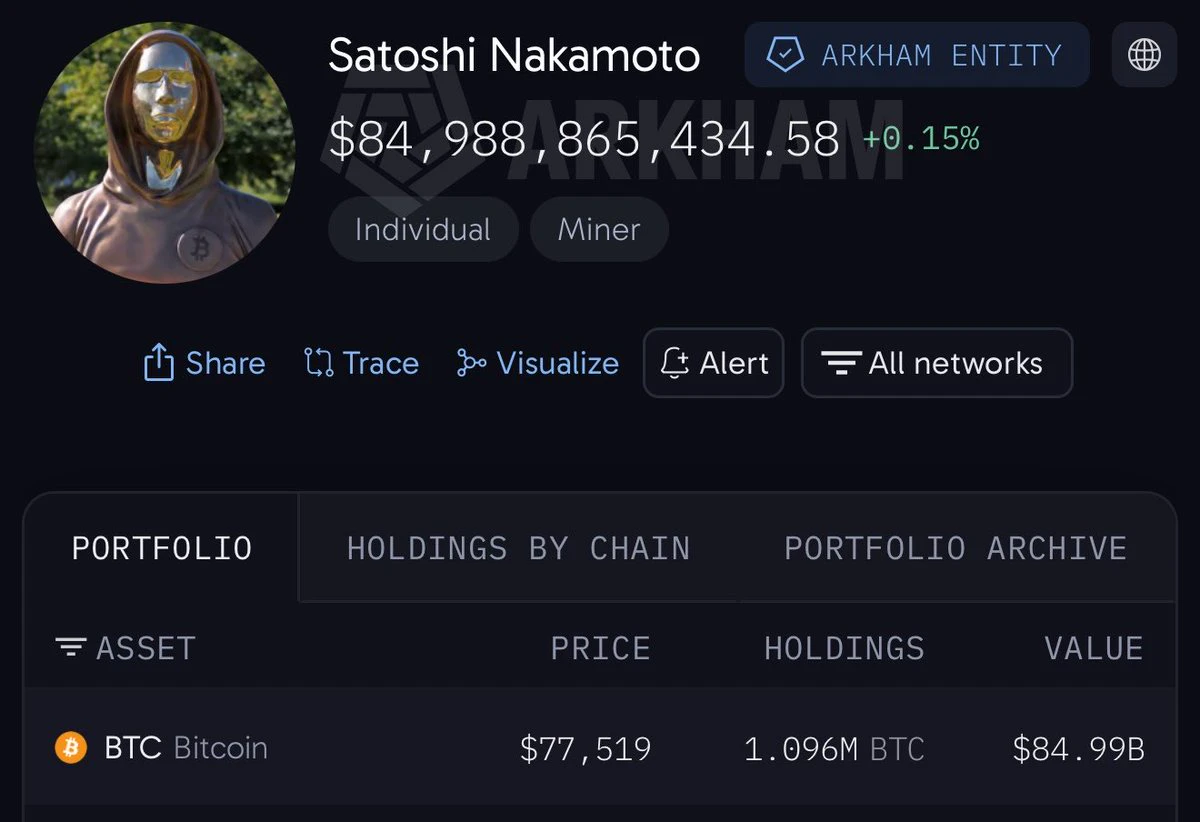
So many crypto hacks happening lately, yet no one has ever tried to hack Satoshi Nakamoto’s wallet, which holds over $85 BILLION worth of Bitcoin.
What’s stopping them ?
post-image
BTC-0.67%
Trenches
IDOL
I
bade
b
IDOL
0x3b...ab07
Market Cap
$.
Change
.
24h Vol
$.
Holders
.
Q
Q
bade
b
Q
0xc0...0589
Market Cap
$.
Change
.
24h Vol
$.
Holders
.
DESSA
D
bade
b
DESSA
npz2...pump
Market Cap
$.
Change
.
24h Vol
$.
Holders
.
ZIG
Z
bade
b
ZIG
0x8c...1145
Market Cap
$.
Change
.
24h Vol
$.
Holders
.
GTA6
G
bade
b
GTA6
4kjr...zDnz
Market Cap
$.
Change
.
24h Vol
$.
Holders
.
Ethereum’s drop below the 200-week moving average matters more than the price itself

Many people look at ETH only in terms of whether it’s at 2,200 or 2,400, but the truly informative signal this week was the breach of the 200-week moving average. Analyst CryptoBullet1 marked 2,000–2,300 as the “Buy The Dip” zone on October 19, and on October 30, ETH actually stepped into that range at 2,229. The problem is that historically, a break below the 200-week moving average has signaled not an ordinary pullback, but a deep correction on a medium-term scale.

What makes me even more cautious is the
ETH-1.23%
It seems like all the women near me are top-tier beauties. Why is that?
post-image
EVAA | Long 🟢 | Bullish | 15-minute 24-hour: +0.32% | Volume: 49.9M USDT
Long rationale: Price above EMA200; EMA20/50/200 are in bullish alignment; RSI14 is 62.2; MACD histogram is positive; ADX14 is 17.7; volume is 0.92 times the 20-candle average; trend pullback/continuation.
Entry: 1.312 Stop loss: 1.22492 Take profit 1: 1.42085 | Take profit 2: 1.48616 | Take profit 3: 1.57325
Entry price is for reference only; do not chase the price. This strategy is invalidated if the stop-loss level is hit. Technical analysis only; this is not financial advice.
$EVAA $EVAA
post-image
EVAA-0.49%
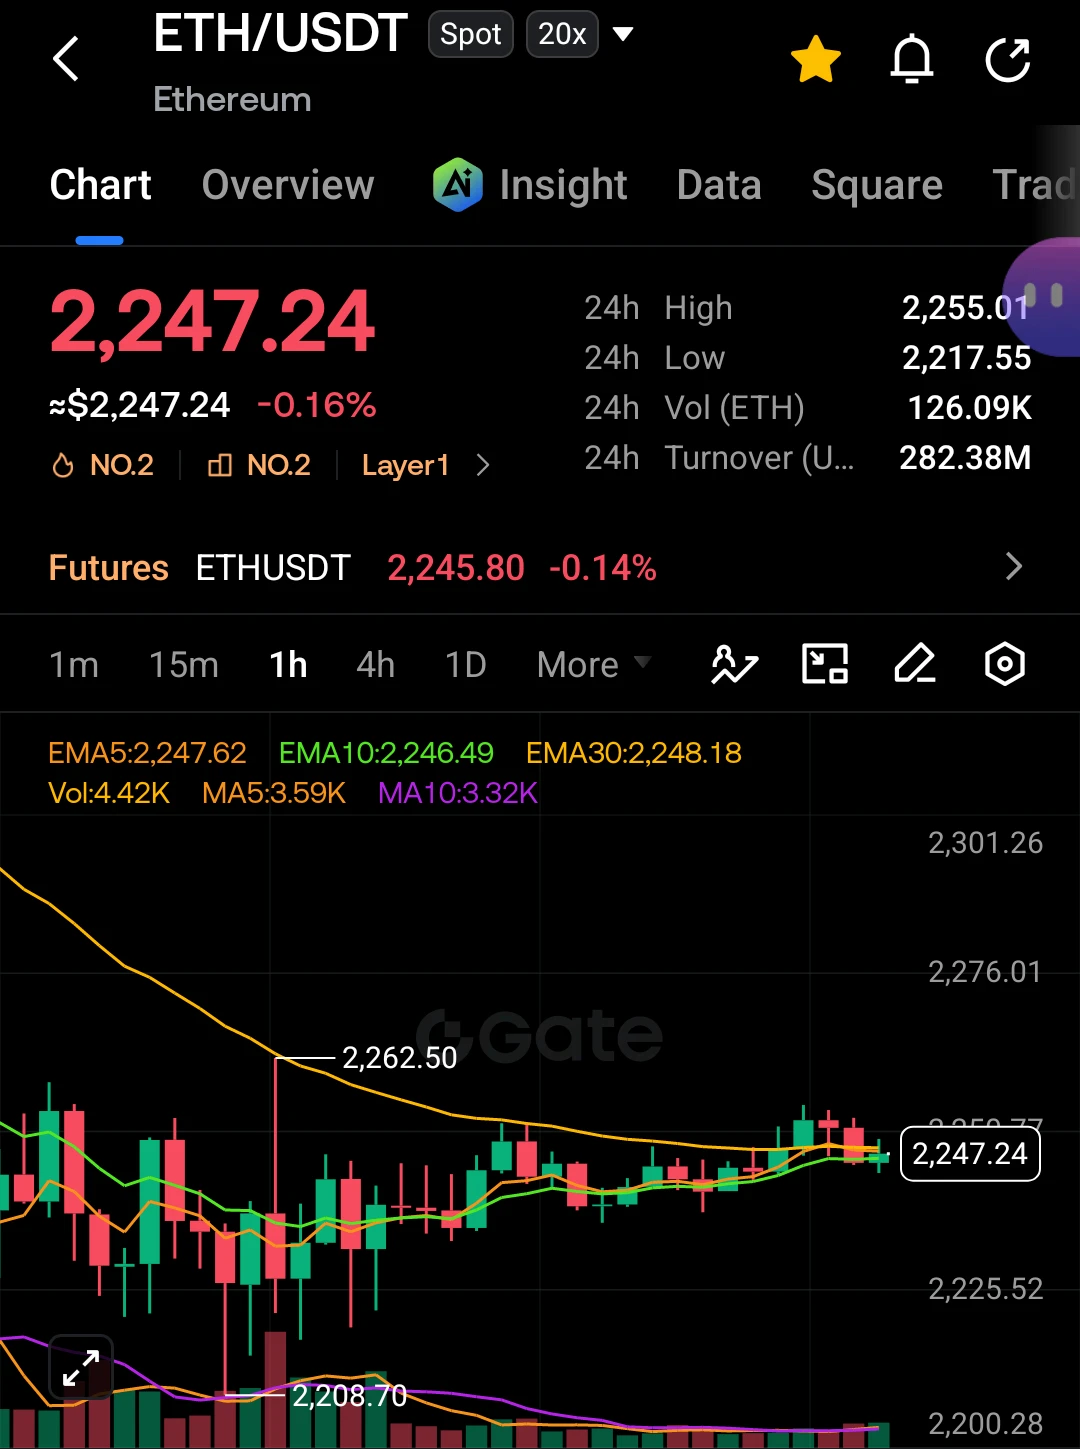
$ETH ‌ETH/USDT – Spot 📊
⛽️ Why did Ethereum go to therapy? Because it couldn't handle the pressure of being stuck in a tight range with high gas fees! 💸📉
Bias: Neutral / Tight Consolidation. Price is flatlining directly on the EMA cluster (EMA5, 10, 30 all around 2,247). Volume is low, indicating indecision. Wait for a bounce from support or a confirmed breakout. ⚠️
🟢 Spot Buy 1 – Support Accumulation
Entry Zone: 2,210 – 2,225 (Confluence: Near 24h low 2,217 + recent swing low 2,208)
TP1: 2,250
TP2: 2,280
TP3: 2,300
SL: 2,190
🟢 Spot Buy 2 – Breakout
Entry Zone: 2,255 – 2,262 (Break above
post-image
ETH-1.26%
MARKET UPDATE
live-cover
LIVE1,465
Good grief, the U price is down to 6.58😂···
During the big bull run in ’21, the exchange rate was only 6.73-6.81, and now this... It’s fallen so badly I can’t even look... What kind of bloodbath is this? You lose holding spot, and you lose switching to U too😂···
post-image
  • 6
  • 2
That 5% wick taught me not to size weekend positions by weekday logic
On Wednesday night, BTC plunged from above 80,000 to 76,260 in one sharp move, with an intraday range of nearly 5%. A trader I know had a stop-loss on a long position at 78,500. That distance is usually safe, but that day a single wick swept it away. By the time he woke up, the price had recovered to 77,500. His position was gone, even though he got the direction right. This was no isolated case. Long positions worth $1.329 billion were liquidated within 24 hours, compared with just $181 million in short positions. Bulls wer
BTC-0.65%
Everyone in the group said at first that they couldn’t understand it. I wanted to ask: does everyone understand it now? Do you still remember PATH’s dividends?
post-image
PATH-0.43%
#HYPERalliesAgainstTheMarket
#ShareWeekly
Hyperliquid HYPE has shown remarkable relative strength by rallying against broader market weakness in late October 2026.
While Bitcoin declined toward the 77,000 range and many altcoins faced selling pressure amid risk-off sentiment and external market events, HYPE climbed sharply from levels near 78 to 80 into the mid-90s before consolidating. This divergence highlights independent catalysts driving the token rather than pure market beta
Point one focuses on the rally itself. HYPE moved from approximately 79 to 80 on October 28 to peaks near 96 to
HYPE+0.24%
BTC-0.67%
  • 7
  • 1
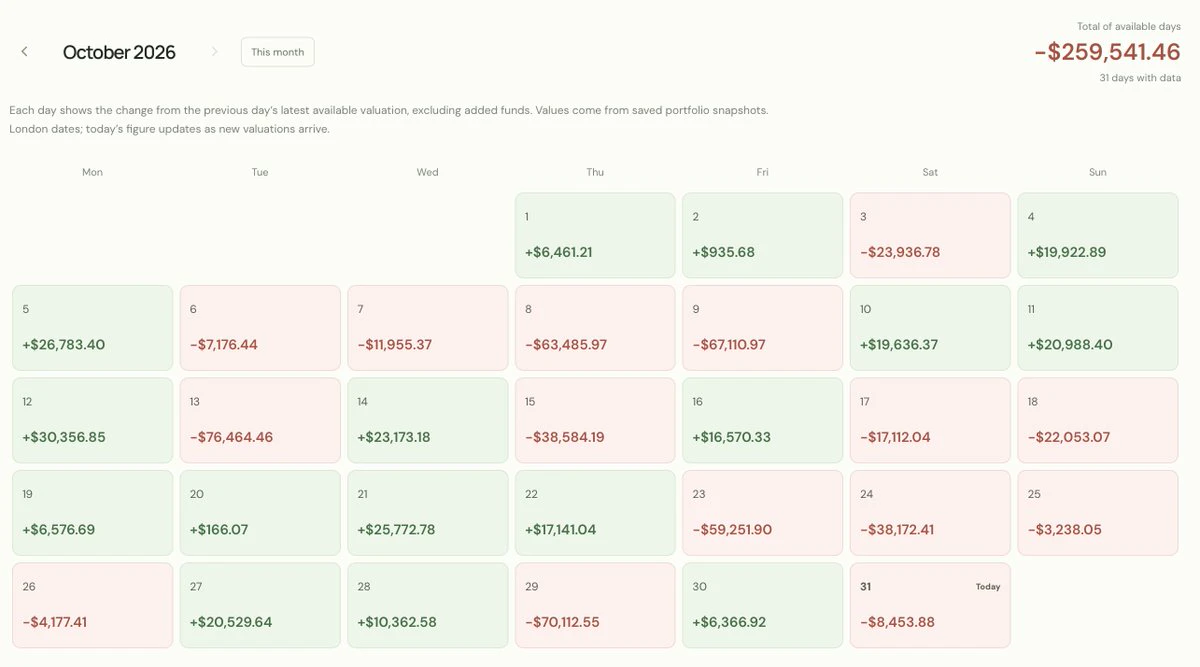
happy halloween to everyone who held through the hack, the alphabet miss and a -3% nasdaq day in the same 48 hours 🎃
what's the scariest thing in your portfolio rn?
post-image
NDAQ+0.65%
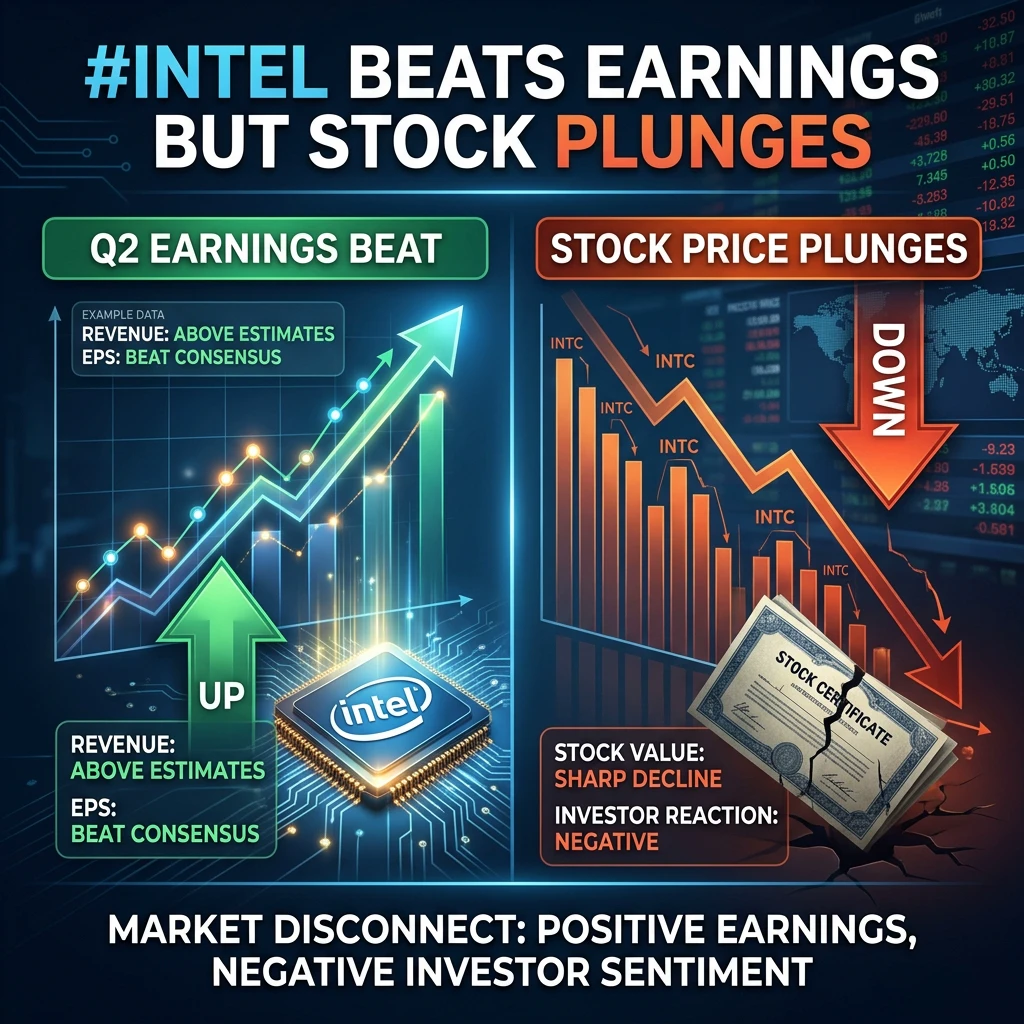
#IntelBeatsEarningsButStockPlunges

Intel Beats Earnings, But Stock Plunges: What Went Wrong?
Why would a company's stock crash even after it reports better-than-expected earnings? Intel has just delivered a powerful example of why investors look beyond quarterly profits. Despite stronger earnings and growing AI demand, its shares suffered a massive decline after investors focused on what could happen next.
For beginners, Intel's latest results offer an important lesson: good earnings do not always mean a rising stock price.
1. Strong Earnings, Weak Market Reaction
Intel reported its third-q
post-image
AMZN-1.55%
  • 3
  • 1
🎃 BITCOIN PRICE ON HALLOWEEN 👻
2010: $0.20
2011: $3.27
2012: $11
2013: $201
2014: $337
2015: $312
2016: $699
2017: $6,369
2018: $6,330
2019: $9,170
2020: $13,540
2021: $61,840
2022: $20,625
2023: $34,495
2024: $72,250
2025: $110,000
2026: $77,400
From $0.20 to $110K...
Happy Halloween 👻 🎃
BTC-0.67%
$UAI $UAI seems to be losing momentum here. It feels like everyone is waiting for the pullback to finally arrive. Take profit: 0.3014 Stop loss: 0.3363 Today's active coins: $ZEC : Current price 1,275.75 - 24-hour gain: +1.87% $LSK : Current price 0.30305 - 24-hour gain: +46.28%
post-image
UAI-7.58%
ZEC+1.16%
LSK-5.32%
ready for a feast 🔥🔥😅
post-image
$LSK Go heavily long today; thank me tomorrow. Stop-loss: $0.24 Take-profit: $0.4 Long now $LSK 👇
post-image
LSK-5.32%
Load More

Join 40 M users in our growing community

⚡️ Join 40 M users in the crypto craze discussion

💬 Engage with your favorite top creators

👍 See what interests you

Trending Topics

BTC大跌

315.48k Views39.64k Discussing

$BTC briefly fell below $77,000 and remains under pressure around the $77K zone, with its 24-hour decline still above 4%. With risk appetite weakening and Fed uncertainty rising, where is the next key support after losing $80K?

IntelBeatsEarningsButStockPlunges

24.47k Views871 Discussing

StrategySTRCNears100ParValue

29.9k Views4.1k Discussing

View More