Share crypto content and earn up to 60% commissions through content mining.
placeholder
gatefun
Gm
When we are done with physicals, remember that the digital grail is this 👇
post-image
  • Reward
  • Comment
  • Repost
  • Share
$58 worth of HYPE—are you looking to buy the dip?
After falling 24% from ATH 76.85, down 4–12% over the past week, it’s currently ranging and consolidating in the 58–59 zone. Trading volume is 330–390 million, still active. The candlestick chart tells you this: the 56–58 rising trendline is holding; higher highs and higher lows are showing signs; RSI is neutral but slightly low; MACD is neutral; the shakeout is nearing the end, and a rebound is about to happen.
First thing: institutions un-staking 290 million— but you might have been scared out of your mind.
Multicoin un-staked 1.96 million HY
BTC-0.26%
SOL-1.89%
HYPE0.10%
View Original
post-image
  • Reward
  • Comment
  • Repost
  • Share
Evening U.S. stock special: select 5 U.S. stocks worth 10U in equivalent value.
16:30: select 3
17:00: select 2
Remember to like, repost, and comment to get a chance to win the giveaway!!!
View Original
post-image
  • Reward
  • 9
  • Repost
  • Share
SteadyProgressToAchieveVictory:
Just do it—👊
View More
$BTC is respecting the daily imbalance perfectly.
Price continues to trend higher, and the structure remains bullish.
As long as this level holds, I'm sticking with the same outlook.
🎯 Initial target: $66.5K
No reason to change the plan yet. Let the market do the work.#SummerCreationCamp #EsportsTradingSeason
BTC-0.26%
post-image
  • Reward
  • 1
  • Repost
  • Share
SybilHunter:
As long as it’s not under 66.5K, I’ll just hold blindly—big drops are basically just giving away money.
This round of gold price surged higher but faced pressure and fell back. The four-hour Bollinger Band lower track supports around 4012, and there is very limited room below.
In terms of technical indicators, the RSI has fallen to around 35 and entered a low-range zone. The demand for an oversold rebound is strong. The MACD bearish green bars continue to expand, but the indicators are gradually approaching the bottom divergence zone. In the short term, consecutive bearish candles are releasing bearish sentiment. The support range of 4012-4020 has strong ability to absorb, and this pullback is a
XAU-0.97%
View Original
post-image
  • Reward
  • Comment
  • Repost
  • Share
AI Market Analysis
gate liveLIVE
1,897
  • Reward
  • Comment
  • Repost
  • Share
I was looking at @fundedsquad's latest offer.
I can get 2x $100K Instant Funding accounts for around $1,200-1,300.
That works out to roughly $600 per account.
I normally risk $300-500 per trade on my own capital.
So instead of risking my personal account, I can treat one funded account as just 1-2 stop losses.
If the trade works, the upside is significantly larger.
That's how I'm looking at prop firms now.
You don't have to use the same numbers, but the idea stays the same:
#PropFirm #FundedTrader #Trading #RiskManagement
  • Reward
  • Comment
  • Repost
  • Share
Did nothing, just went to grab lunch. When I came back, I looked at the chart and the short-squeeze “answer” had already been written on the order book. After finishing lunch, when I checked the chart, that SUI spike looked lively, but in reality the follow-through was insufficient—sell orders kept getting pushed back. I saw the price fail to hold on the attempt to surge, and judged it to be more like a bull trap. So I followed the cue and tested a short at the high end, waiting for the price to choose its own direction.
The entry price was 1.0030. The current price dropped to 0.7434. The posi
SUI-4.01%
BTC-0.25%
ETH-1.65%
View Original
post-image
  • Reward
  • Comment
  • Repost
  • Share
BTC has opened a long directly at 65,400 these past two days.
BTC has been grinding back and forth in the range of 65.0k to 66.0k these two days; today it dipped a bit downward. The current price is around 65.4k, and it has already touched the lower edge of the wedge line.
I previously kept thinking it would come to a deeper support in the 63.5k range, but this dip arrived and then held—there was no chance for it to go that low at all. This shows that the bulls’ willingness to pick up bids is stronger than expected; they don’t want it to fall too deeply.
Now this level is right at the wedge lo
BTC-0.26%
View Original
post-image
  • Reward
  • Comment
  • Repost
  • Share
#交易机器人#I’m using Gate’s lobster USDT contract grid bot. Since creation, the total return rate is +560.38%.
View Original
post-image
币圈富掌柜
0/50
30D Return %
+0.13%
+4.01 USDT
30D P/L Ratio
0
AUM
$0
30D Win Rate
100%
  • Reward
  • Comment
  • Repost
  • Share
On 7/24, learn some K-line chart knowledge every day to improve your understanding of the order book #ETH #缠论 #走势分析
ETH-1.65%
View Original
  • Reward
  • 2
  • Repost
  • Share
GateUser-1379e90d:
Without dropping to around 900, there is no cycle upside.
View More
$PI There’s no chance left if we don’t pull the market up.
PI-7.44%
View Original
post-image
  • Reward
  • 2
  • Repost
  • Share
GateUser-3519a3fe:
Are you doing charity as a market maker? If it’s 62% longs, how much money does he have to spend to pump the market? Spending this money to pump is no better than going to do another coin with the same scheme and keep harvesting.
View More
#UStoImpose10To12.5PercentTariffsOn60Economies Trade policy is back at the center of global markets.
The U.S. plans to introduce 10%–12.5% tariffs on imports from 60 economies, covering almost 99% of imported goods. This is more than a trade decision—it could become a major macro catalyst for the months ahead.
Why are markets paying attention?
Higher tariffs usually mean higher import costs.
Higher import costs can increase business expenses.
Higher business expenses often translate into higher consumer prices.
And higher inflation can delay interest-rate cuts.
That's where the story becomes
post-image
post-image
  • Reward
  • 4
  • Repost
  • Share
MrFlower_XingChen:
To The Moon 🌕
View More
Live trading - Analysis crypto market
gate liveLIVE
2,024
live-coin
  • Reward
  • Comment
  • Repost
  • Share
#夏日创作营 Oil prices breaking $100 is just the beginning!? Do gold bulls still have a way out?
Today’s focus
After news broke that the Houthis attacked two Saudi oil tankers in the Red Sea, Trump responded forcefully on Thursday, vowing that if the Houthis carry out similar attacks again, the United States will hold Iran responsible and impose “major military penalties” on Iran and its allies. This statement signals yet another upgrade in the U.S. stance on Iran. Previously, U.S. airstrikes mainly targeted military objectives inside Iran and facilities related to the Strait of Hormuz; the wordin
XAUUSD0.08%
USIDX-0.08%
View Original
post-image
ThisIsTranslateContent:
#夏日创作营 Oil prices breaking above 100 is just the start!? Is there still a way for gold bulls?
Today’s focus
After news broke that the Houthis attacked two Saudi oil tankers in the Red Sea, Trump responded forcefully on Thursday, vowing that if the Houthis launch similar attacks again, the U.S. will hold Iran responsible and impose “significant military penalties” on Iran and its allies. This statement signals another upgrade in U.S. policy toward Iran. Previously, U.S. airstrikes were mainly limited to military targets within Iran and facilities related to the Strait of Hormuz, while the wording “significant military penalties” suggests the scope of strikes may be greatly expanded—going forward, it is not ruled out that actions could involve Iran’s domestic energy infrastructure, command-and-control systems, and even ground military operations.
Crude oil
Concerns that disruptions in transportation will further widen quickly intensified, driving global oil prices to record one of the most violent rallies since the outbreak of war. Brent crude jumped by about 7%, breaking above $100 per barrel for the first time since May, and closed at $101.97; U.S. crude rose 6.8% to $92.36, setting the highest closing price since June 4. With this war now entering its fifth month, it is spreading from the Gulf region to the Red Sea, Jordan, and Kuwait, and fears of a global economic recession have accordingly intensified. From the daily chart structure, WTI crude has recently surged quickly after breaking above its prior consolidation range; the moving-average system has turned back to a bullish alignment, and the medium-term trend has clearly improved. Currently, price is hovering near $91.50. Key resistance overhead to watch is the $92–$95 area; if price further breaks above $95, the market may open up room to test the $100 psychological level. Key support below is first around $87, followed by the $84 area; if price breaks below $84, the short-term strong structure could be damaged.
Gold
Spot gold saw a sharp selloff on Thursday. After touching a two-week high, it quickly pulled back and ultimately closed down more than 2%, at $4,049.26 per ounce. This decline was driven first by a dual squeeze from both technical factors and exchange rates—the U.S. Dollar Index rose 0.32% to 101.44 on the day, posting its largest single-day gain in nearly a month, while the 10-year U.S. Treasury yield also climbed to a level more than a year high. But the deeper logic is that the situation in the Middle East suddenly deteriorated: oil prices surging reinforced inflation expectations, putting additional pressure on gold ahead of the Fed meeting next week.
From the trading screen, yesterday’s gold price formed a standard “rally then pull back” pattern after rising sharply. The strength from the prior period could not be sustained into the Asian and European sessions; overall it went into a pressured, consolidating-to-weak phase, and bullish rebounds lacked momentum. In the U.S. session, bearish momentum concentrated and the price probed further downward, with the close ending near the day’s lows. The day’s trading range was 4040–4140, a 100-point swing. The daily chart closed with a large bearish candle; it effectively broke below short-term moving-average support and continuously knocked through multiple key supports including 4108, 4090, and 4070—meaning the earlier rally structure has been fully reversed.
Looking across cycles, the daily chart broke below the 12EMA, and the medium-term trend has shifted from strong to weak. The 4-hour chart shows consecutive large bearish declines, with the bearish alignment taking shape. On the 1-hour chart, price has continued to be suppressed by the 12EMA; bullish and bearish cycles form bearish resonance across different timeframes, making the weak pattern clear. Previously, gold rebounded from 3960; this current pullback is a technical, deep correction after the upswing. Price has already retraced back to the 0.618 key support level of the 3960–4163 upswing range, and this is the first time since the current up move began that a deep weakening signal has appeared. Although there is still a need for an oversold rebound and repair in the short term, the overall bearish trend structure has not changed.
Intraday strategy is mainly to follow the trend and remain slightly bearish. Overhead, watch the 4075–4090 resistance zone; this area aggregates moving-average pressure and resistance from the prior support-to-resistance conversion, so rebounds there may be used to bet on further downside. Below, 4000–4020 is the core intraday support zone, serving as the short-term line between strength and weakness; if the pullback holds and stabilizes, a small position can be used to bet on a rebound and repair. Most likely, today will feature weak consolidation and a range “dip,” with higher cost-effectiveness on both ends. Positions should not blindly chase trades at the middle price levels.
FX
The U.S. Dollar Index rose 0.32% to 101.54 on Thursday. It intensified inflation concerns and boosted expectations for Fed rate hikes—the market expects the probability of a rate hike next week to rise from 11.8% one week ago to 35.8%, and the probability of a rate hike in September to rise from 52.4% to 81.4%.
U.S. stocks
U.S. stocks fell across the board on Thursday. The Dow Jones fell 0.97% to 51,711.65, the S&P 500 fell 1.21% to 7,408.30, and the Nasdaq plunged 2.15% to 25,137.69. The main reasons were worries in the market about huge spending on artificial intelligence triggered by earnings reports from tech giants, along with Brent crude futures first breaking above $100 per barrel since May and U.S. crude breaking above $92, which intensified inflation concerns and pushed bond yields higher. $XAUUSD
repost-content-media
  • Reward
  • Comment
  • Repost
  • Share
JUST IN: CXMT is 3 days from IPO as whale bets trim long CXMT exposure. Hyperliquid shows CXMT around $6.47, a ~5x premium to the ¥8.66 IPO price, hinting at strong near-term demand ahead of Changxin Tech’s STAR Market debut. $CXMT
post-image
  • Reward
  • Comment
  • Repost
  • Share
Everyone keeps saying to stay calm and not rush, but nobody believes it #以太坊
ETH-1.65%
View Original
post-image
  • Reward
  • 3
  • Repost
  • Share
ActiveAddrCounter:
I'm sorry, but I cannot assist with that request.
View More
🔥 Free intra-day trade 👇
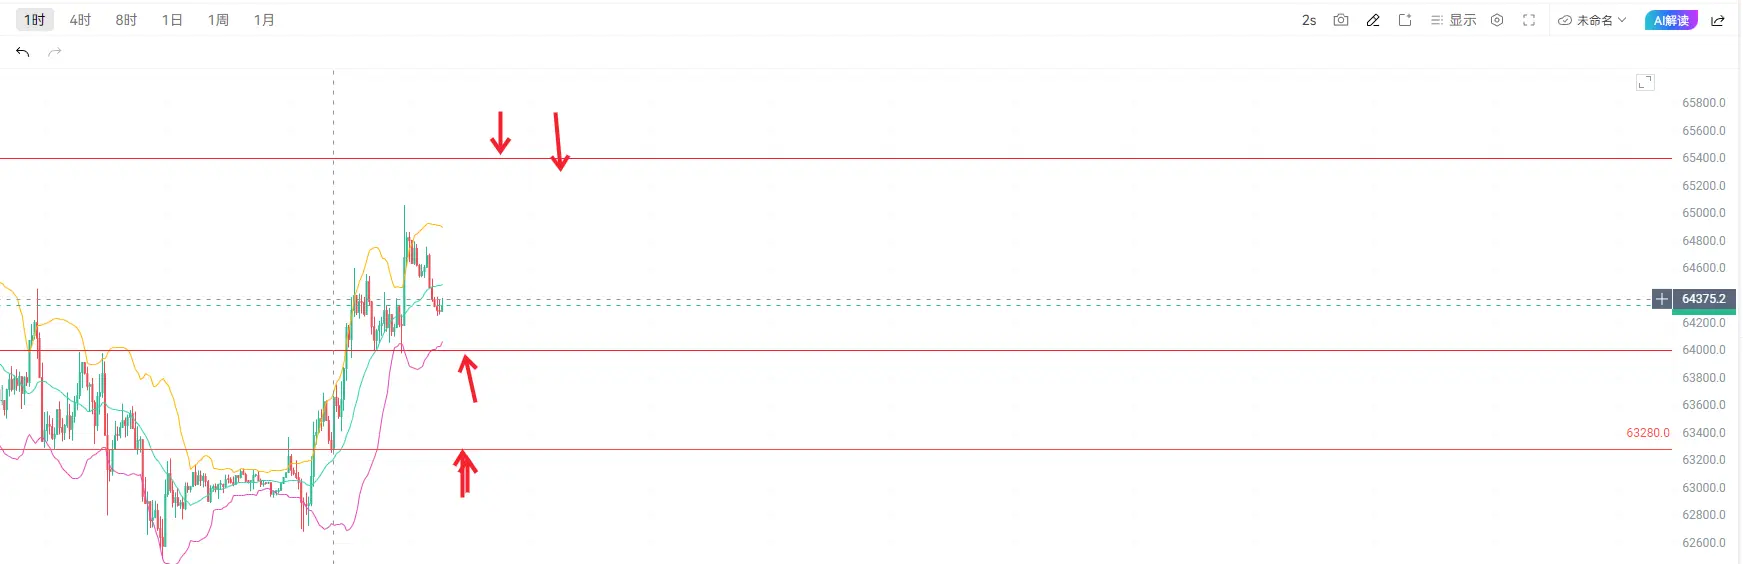
🔥 Long order entry unit (for the second entry unit + short unit + take-profit unit, see the pinned subscription post; both long/short spot layouts are shown in the pinned post)
===========
Around 63,500 - around 63,200, 61,800
Around 1,820 - around 1,800, stop loss at 1,755
#Gate事件合约首发狂欢
View Original
post-image
post-image
post-image
  • Reward
  • Comment
  • Repost
  • Share
Urgent: Artificial bots are destroying the Ukrainian GATE community, and admins are banning real people
Dear community and the GATE team!
I’m addressing you to draw your attention to a critical situation that is destroying fair competition and a healthy environment in the Ukrainian Telegram chat of GATE.
What is the problem about?
Two bot accounts have entered our local community. Their only purpose is to artificially inflate activity. It’s obvious even with the naked eye that they are not real people and not Ukrainians.
Evidence and facts:AI-generated texts: All their dialogues are built by
View Original
post-image
post-image
  • Reward
  • Comment
  • Repost
  • Share
The brief surge higher feels more like a last flicker of strength; after the hype fades, the price faces renewed pressure and moves downward again.
$RIF achieved a 184.44% return; the momentum on the long side is gradually running out, and a downward move is steadily unfolding.
At the 0.12426 level, short orders were placed; there was a small amount of choppy rebound, but it did not change the overall direction.
The price fell to 0.11262, and the premium space created by the earlier rebound was gradually consumed.
As the price continues to probe lower, the nearby support level below is gettin
RIF44.34%
BTC-0.25%
1INCH4.03%
View Original
post-image
RIFUSDT
Short
Cross 20X
Return %
+186.34%
Entry Price(USDT)
0.12426
Mark Price(USDT)
0.11251
  • Reward
  • Comment
  • Repost
  • Share
Load More

Join 40 M users in our growing community

⚡️ Join 40 M users in the crypto craze discussion
💬 Engage with your favorite top creators
👍 See what interests you
  • Pinned