Brittany_willo

vip
Active for: 1.5y
Peak Tier 1
Web3 Creator
Content creator and 24/7 trader
Hi everyone! I’m a Gate user, and I recently came across a program on Gate called #ContentMining.
Could anyone here guide me on how to participate in it? I’d also like to know what type of content we’re supposed to post, which hashtags to use, and what the main requirements are.
Any guidance from someone who has already participated would be really appreciated!
#BTCSurges20%in3Days #GateLaunchesJapaneseStockTrading
  • Reward
  • 9
  • Repost
  • Share
Jumane22:
btc
View More
$ETH /USDT 1H — The Rebound Is Losing Momentum
I’m watching $ETH a little more carefully here because the chart looks less like a clean breakout and more like a rebound that is starting to cool off.
On the 1H chart, ETH is around $2,435, after making a sharp move from the $2,355 low to the $2,484.94 high. That’s a strong recovery, but price is now pulling back from the upper part of that range.
Here’s what stands out to me:
Current price: $2,435.48
24H high: $2,484.94
24H low: $2,355.01
Moving averages
The short-term averages are giving a slightly cautious signal:
- MA5: $2,440.04
- MA10: $2,4
ETH1.33%
  • Reward
  • 5
  • Repost
  • Share
GasMonk:
The MACD histogram bars have all turned green, so short-term momentum is indeed weak. However, the support from MA30 is somewhat interesting. Both longs and shorts are in an awkward position here, so I’m inclined to wait and see for now.
View More
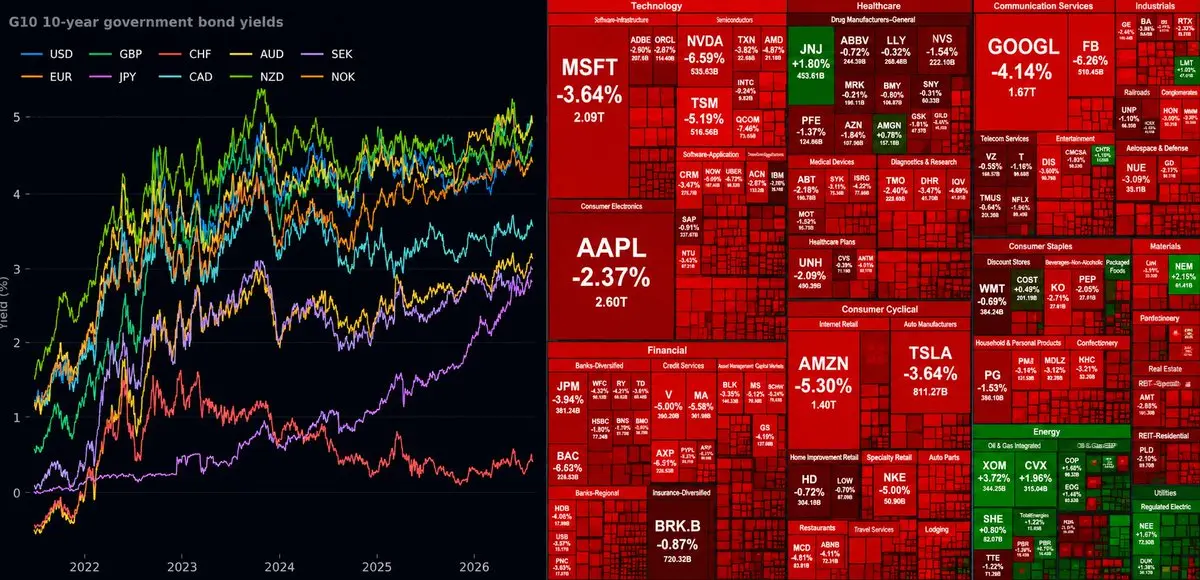
🚨 GLOBAL BOND MARKET IS STARTING TO LOOK SERIOUS
This is the part of the market I’m watching right now.
Long-term bond yields are pushing to levels we haven’t seen in years across major economies.
The U.S. 30-year Treasury yield has moved above 5.3%, its highest level since 2007.
Japan’s 10-year yield is sitting close to 3%, around a three-decade high. France and the UK are also seeing heavy pressure in their longer-dated bonds.
And this is important because rising yields basically mean governments, companies and consumers are facing higher borrowing costs.
But there’s another problem underne
BTC1.20%
SOL1.41%
0G1.92%
post-image
  • Reward
  • 6
  • Repost
  • Share
Bit_Rise:
Very nice information
View More
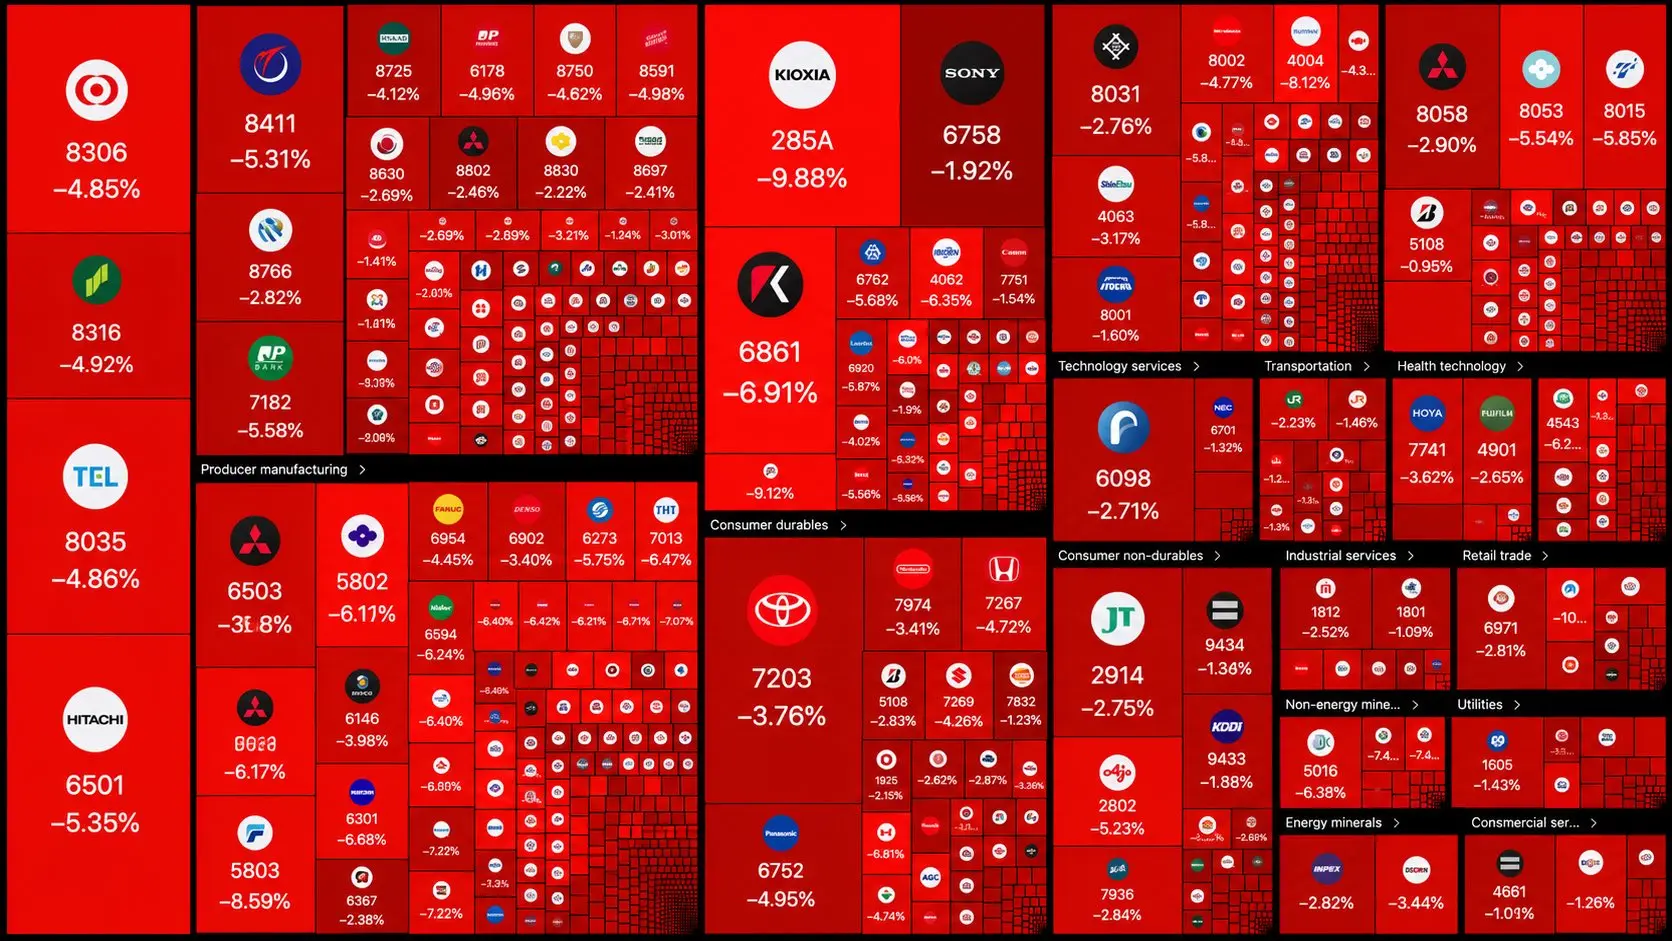
🚨 JAPAN’S STOCK MARKET IS GETTING HIT AGAIN
The Nikkei is down around 3% today, and roughly ¥35 trillion ($225B) in market value has been wiped out.
That’s not a small correction.
What caught my attention is that this isn’t happening in isolation. Japanese stocks are getting hit as global tech shares weaken, bond yields stay elevated, and investors become more cautious about risk.
The Nikkei has been especially sensitive to the selloff because chip and tech-related names are taking some of the biggest pressure.
And honestly, this is the part I’m watching.
When stocks fall because of one bad h
BTC1.20%
ETH1.33%
post-image
  • Reward
  • 6
  • Repost
  • Share
RJT_WAGMI:
bullish on it go go go
View More
📉 $PRL USDT (Perp) - SHORT
➡️ ENTRY: 0.4437 - 0.4550
➡️ LEVERAGE: 3x - 5x
➡️ TARGETS: 0.4209 | 0.3957 | 0.3635
⛔️ STOP LOSS: 0.4720
$PRL #GateEventPointsSystemLaunched
PRL0.89%
  • Reward
  • 4
  • Repost
  • Share
RJT_WAGMI:
Bullish on it go go go go go
View More
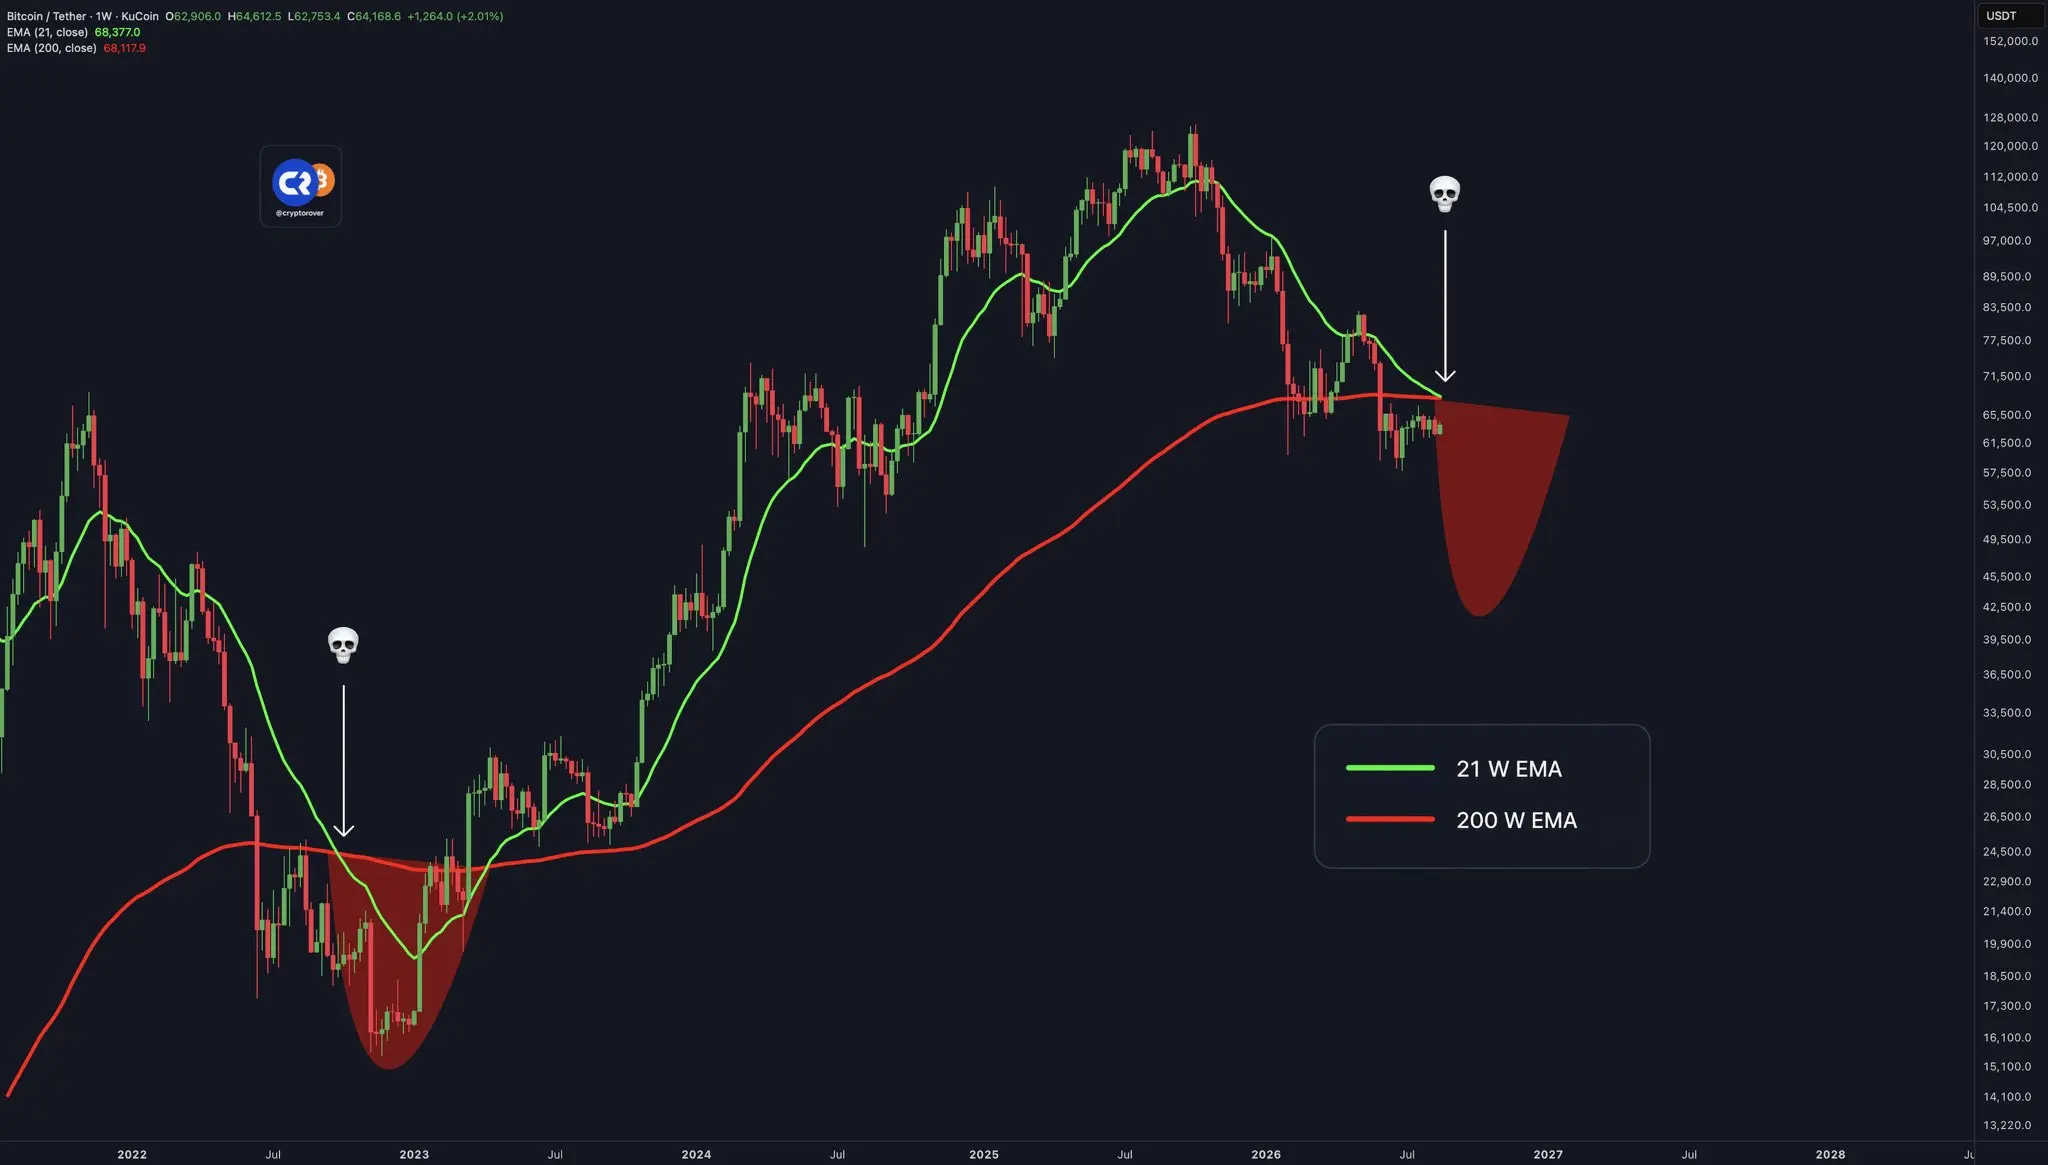
🚨 $BTC is flashing a bearish cross.
This is getting my attention because the last time we saw a similar setup was around August 2022 — before Bitcoin went through that final major flush.
I’m not saying history will repeat exactly. It won’t.
But when a signal with that kind of history shows up, I’d rather slow down and watch the market closely than blindly chase a bounce.
For me, the important part now is how BTC reacts around key support. If buyers can defend it, this could end up being just another warning signal.
If support starts breaking with volume, though, the risk of a deeper move bec
BTC1.20%
post-image
  • Reward
  • 2
  • Repost
  • Share
PhishDetector:
I treat it all as noise until support breaks; then we’ll talk. Still, it’s a good reminder not to blindly chase longs.
View More
$AEON USDT the pullback is where I’m interested, not the green candles
I’m looking at $AEON on the 30m chart and the part I keep coming back to is the move from 0.07982 to 0.09480.
That was a pretty aggressive push, and volume expanded with it. After that high, price started cooling down instead of immediately making another breakout. For me, that changes how I want to trade it.
I don’t want to buy just because the chart still looks green.
I want to see whether the market can build a higher low first.
Right now AEON is around 0.08991, with MA5 at 0.09007, MA10 at 0.09048, and MA30 much lower
AEON-0.32%
  • Reward
  • 5
  • Repost
  • Share
VaultArchitect:
What I admire most is not predicting the next candlestick, but waiting for the price to provide the answer. Don’t chase a breakout above the previous high, and don’t hold on when the structure breaks down—this discipline matters more than direction in futures trading.
View More
$UNITREE USDT — I’m watching this for a possible long, but I don’t want to chase it
I’ve been looking at the 1H chart, and the setup is interesting mainly because price is trying to recover after that sharp pullback.
$UNITREE ran from around 90.35 all the way to 104.80, then started giving back a good part of that move. Since the top, we’ve seen a series of lower highs and lower lows, so I’m not calling this a confirmed uptrend yet.
What I like right now is that price has bounced from the 95–96 area and is back around 98.50.
The moving averages are also starting to bunch together:
- MA5: 97.54
UNITREE-1.43%
  • Reward
  • 6
  • Repost
  • Share
GateUser-6f197465:
1000x Vibes 🤑
View More
$CAP USDT the bounce is interesting, but I’m not chasing it
I’m looking at CAP on the 15m chart here, and honestly I like the structure more than the current price.
$CAP pushed down from the 0.071+ area and eventually printed a local low around 0.06724. Since then, buyers have stepped in and price has started making a small recovery. We’re now around 0.06913, but I don’t want to treat one green bounce as a confirmed reversal yet.
What caught my attention is the moving averages.
MA5 is around 0.06904, MA10 around 0.06851, while MA30 is still higher near 0.06932. So price has recovered the short
CAP-0.84%
  • Reward
  • 2
  • Repost
  • Share
FEREars:
The analysis is quite practical. Although the 15-minute chart closed with a slight rebound, MA30 is still overhead, so chasing at 0.0691 could easily leave you trapped halfway up. It would be better to wait for a pullback to 0.0685–0.0689, near MA10, before entering, with a stop-loss below 0.06715; only then is the risk-reward worthwhile. The key level remains 0.06724—once it breaks and closes below on heavy volume, the rebound thesis is invalidated, so don’t keep holding the losing position. If it later surges to 0.06985–0.07100 but faces clear resistance, I’ll also choose to take profits first rather than keep fighting it. Overall, it’s a trading plan with clear boundaries and controllable risk, not a trade call, and that attitude is commendable.
View More
I keep coming back to one crypto narrative lately: proof of human.
Not because I think every “AI + crypto” project is automatically interesting. Honestly, most of them don’t hold my attention for long.
What’s different with $WLD s the problem it’s trying to sit around.
AI is making it harder to know whether the person on the other side of an account is actually a person. Bots are getting better, fake accounts are getting cheaper, and online platforms are starting to care a lot more about proving that there is a real human behind an interaction.
That’s why I’ve been watching World again.
And th
WLD0.37%
  • Reward
  • 7
  • Repost
  • Share
Lalasahil:
The chart is still hovering between 0.34 and 0.35; a breakout above 0.355 would make it somewhat interesting. However, the circulating supply is still several billion, so don’t get carried away by a small rise.
View More
$LINK /USDT — I’m watching this one closely
I’ve been looking at LINK on the 1H chart, and my first thought is honestly… this doesn’t look like a clean breakout setup yet.
LINK is around $9.43 right now. We had that big push from roughly $8.88 up to $9.74, then the market cooled off and LINK gave a good chunk of that move back.
Since then, price has been chopping around $9.28–$9.56.
That part matters to me.
I don’t really want to buy in the middle of a range just because the last few candles turned green.
Right now price is sitting almost exactly around the short-term moving averages. MA5 is a
LINK1.84%
  • Reward
  • 1
  • Repost
  • Share
LotManager:
This analysis is spot-on. LINK is still grinding within the range; until it breaks above 9.5, I’m treating it as consolidation. I’ll make a move once it holds above that level.
$ETH /USDT — this is the setup I’m watching
I’m looking at $ETH on the 30m chart and honestly, I don’t see a clean breakout here yet. Price is sitting around $1,880.87, basically stuck in the middle after that drop toward $1,877.24.
So I’m not trying to force a trade at the current price.
What I’m watching is the $1,879–$1,881 area. ETH has been bouncing around there, but the bigger problem for me is that the 30 MA is still around $1,882.2, so there’s some resistance sitting just above us.
My plan would be to look for a LONG if ETH reclaims $1,881.5–$1,882.5 and actually holds it on the 30m ch
ETH1.34%
  • Reward
  • 1
  • Repost
  • Share
AuroraSnowyWildernessSolitary:
This approach is right. Don’t chase before it firmly holds 1881.5–1882.5; wait for confirmation on the 30-minute timeframe before entering. Setting the stop-loss at 1877.5 is also quite reasonable. Trading requires patience.
$BTC ‌ This is the setup I’m watching, not a signal
Looking at the 15m chart, BTC is sitting around $63,007 after getting rejected from the $63,150–$63,160 area and dropping toward $62,965.
What caught my attention is that price bounced from that low, but I’m not treating the bounce as a confirmed reversal yet. The short-term structure still looks a bit weak, and the MACD is below zero. So I’d rather wait for BTC to actually prove strength instead of chasing a green candle.
My trade plan
Direction: Conditional LONG
Entry zone: $62,980–$63,015
I’d only consider the entry if price holds this ar
BTC1.18%
  • Reward
  • 2
  • Repost
  • Share
SlowStrategy:
Bro, this plan is very clear, and placing the stop-loss close to the structure does make sense. However, I think 63.15 could easily be pushed back down if it breaks out without strong volume, so I’ll wait until it gets there before deciding.
View More
$HEMI /USDT — just sharing my personal trade observation, not a signal.
I’ve been watching HEMI after this strong move up. Price is around 0.00799, with the recent high near 0.00845. The 1H structure still looks bullish to me, but I wouldn’t want to chase a green candle up here.
My personal trade plan:
• Entry zone: 0.00755–0.00780
• Support: 0.00750 area, then 0.00700–0.00710
• Resistance: 0.00845
• Stop-loss: around 0.00715
• Target 1: 0.00840–0.00845
• Target 2: 0.00900
• Target 3: 0.00950 if momentum stays strong
What I like here is that the 7 MA is above the 25 and 99 MA, and volume has
HEMI-4.99%
  • Reward
  • 1
  • Repost
  • Share
AirdropRefugee:
The strategy is clear this time. Waiting for a pullback to around 0.0075 before entering is indeed safer than chasing the price, and the stop-loss is set reasonably. I’ve learned something.
$CSPR is trading around $0.002824, up +10.48%.
📊 Trading Signal:
🟢 Direction: LONG / BULLISH
💰 Entry: $0.00278 – $0.00282
🎯 TP1: $0.00290
🎯 TP2: $0.00300
🎯 TP3: $0.00315
🛑 Stop Loss: $0.00270
⚠️ Risk: HIGH
Strong 15m uptrend with rising volume and price above the MAs. A clean break above $0.002828 could push the next leg higher.
Not financial advice. $CSPR #GateLaunchpool141MDOS
CSPR-2.35%
  • Reward
  • 2
  • Repost
  • Share
BlackSwanObserver:
The 15-minute chart has indeed strengthened, but I generally only dare to take a small position in high-risk coins. If it can hold above 0.00283, I’ll add; otherwise, I’ll wait to buy near a pullback to 0.00278. For now, I’m targeting 0.0029 for take-profit.
View More
🧠 I actually staked a small amount of $DUSK myself instead of just reading the docs, and honestly… the mechanics were more interesting than the pitch.
The first thing I noticed: when you add to an existing stake, only 90% becomes active immediately. The other 10% sits inactive, and you can't touch it unless you fully unstake.
Then there’s the maturity window.
A stake needs to pass 4,320 blocks — roughly 12 hours — before it can even count toward consensus selection.
I wasn't expecting that when I first started playing with it.
And another thing I think people can easily misunderstand: the r
DUSK-0.57%
post-image
  • Reward
  • 5
  • Repost
  • Share
RJT_WAGMI:
bullish on it go go go
View More
Bitcoin: A Historical Pattern Worth Watching
There is an interesting similarity on the
$BTC
Bitcoin chart that is worth studying — not because it predicts the future, but because markets sometimes repeat similar behavior.
If we compare the 2022 decline with the more recent 2025–2026 decline, we can see two major bearish waves that look surprisingly similar in several ways:
The percentage of the decline is relatively close.
The speed of the sell-off is comparable.
The duration is similar.
More importantly, the overall shape and rhythm of the two moves have similarities.
But there is one ver
BTC1.18%
BTC1.20%
post-image
post-image
post-image
  • Reward
  • 8
  • 1
  • Share
mdmintukhan700:
This historical comparative analysis is spot on! While history doesn't repeat itself exactly, it certainly rhymes in terms of cycle duration and sell-off speed. Recognizing these fractal patterns gives traders a huge edge in anticipating potential cycle bottoms and trend shifts. Great insight!
View More
$LAB has been trending lower throughout the chart, with the latest selloff pushing price down toward $0.0850 – $0.0880. The breakdown below the $0.1000 area has left the short-term structure firmly bearish.
There is no clearly marked support zone on the chart yet, so the current area around $0.0840 – $0.0870 is the first level to watch for a reaction. Any rebound would likely face resistance around $0.0900 – $0.0950.
If $0.0840 – $0.0870 holds and buyers reclaim $0.0900 – $0.0950, a short recovery could develop. A clean break below the current base would keep the downside structure intact.
#L
LAB16.02%
post-image
  • Reward
  • 1
  • Repost
  • Share
RarityInsider:
This price action looks really painful—0.1 couldn’t hold. Now we’ll see whether 0.084–0.087 can provide support; a rebound to around 0.09 will probably bring another wave of people selling. Don’t recklessly chase shorts in the short term—wait until the structure becomes clearer.
$VELVET is definitely catching attention today.
Up 43.77% in 24H and currently trading around $1.01. The chart is showing strong buying pressure, with price still holding above the key moving averages.
The bigger question for me now: is $VELVET just getting started, or are we getting close to a local top?
Keeping a close eye on this one. 👀
$VELVET ‌
#Velvet #VELVET #Crypto #GateLaunchpool141MDOS
VELVET-6.01%
post-image
  • Reward
  • 4
  • Repost
  • Share
CoffeeBeanie:
Honestly, a coin that’s up more than 40% in 24 hours either has genuinely positive news behind it or is being pumped by market makers. It looks strong technically, but could form a sharp wick at any moment. I’m staying away—just watching.
View More
  • Pinned