Square
Following
Hot
News
Profile
Share your thoughts
placeholder
Article
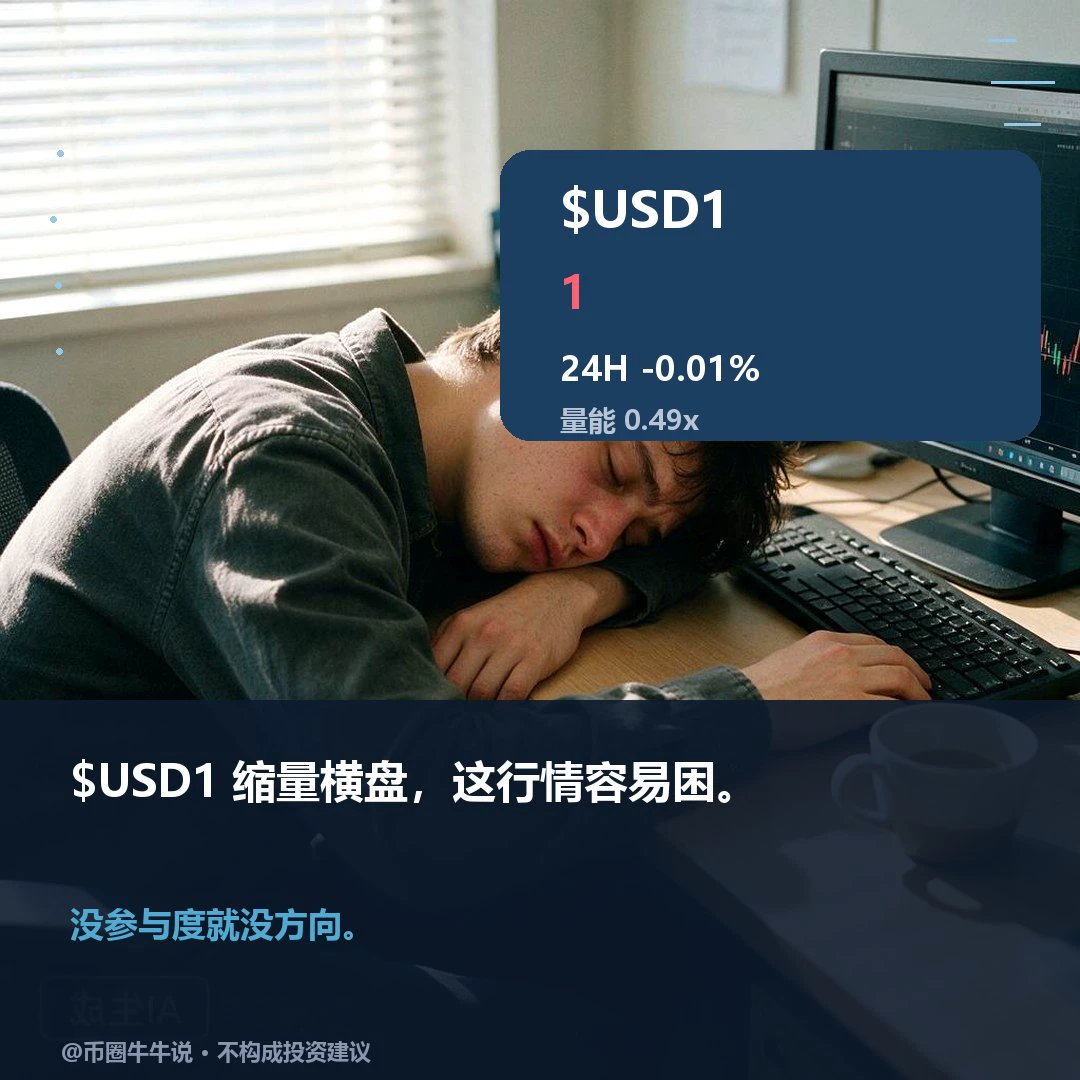
$USD1 Currently at 0.99895, down 0.01% over 24H (range: 0.99868–0.99947). The 1H outlook is weak, with an RSI of 45; the 4H outlook is weak, with an RSI of 28. If it holds above 0.99947, continue watching for upside potential. If it breaks below the 0.99868 support, the short-term structure may weaken. Markets are volatile; for observation only.
post-image
USD1+0.00%
$INJ network continues to grow its real-world asset (RWA) footprint, featuring partnerships like BDACS (making the KRW1 Korean won-pegged stablecoin an exclusive RWA settlement asset) and native USDC integration via Circle CCTP.
Price Range: ~$8.00 – $9.60 USD
Circulating Supply: ~99.97M – 100M tokens (fully unlocked)
INJ-1.67%
Trenches
ZIG
Z
bade
b
ZIG
0x8c...1145
Market Cap
$.
Change
.
24h Vol
$.
Holders
.
KIM
K
bade
b
KIM
8pjf...pump
Market Cap
$.
Change
.
24h Vol
$.
Holders
.
BTC
B
bade
b
BTC
C5xp...pump
Market Cap
$.
Change
.
24h Vol
$.
Holders
.
Anakin
A
bade
b
Anakin
Exxz...pump
Market Cap
$.
Change
.
24h Vol
$.
Holders
.
IDOL
I
bade
b
IDOL
0x3b...ab07
Market Cap
$.
Change
.
24h Vol
$.
Holders
.
MARKET UPDATE
live-cover
LIVE1,311
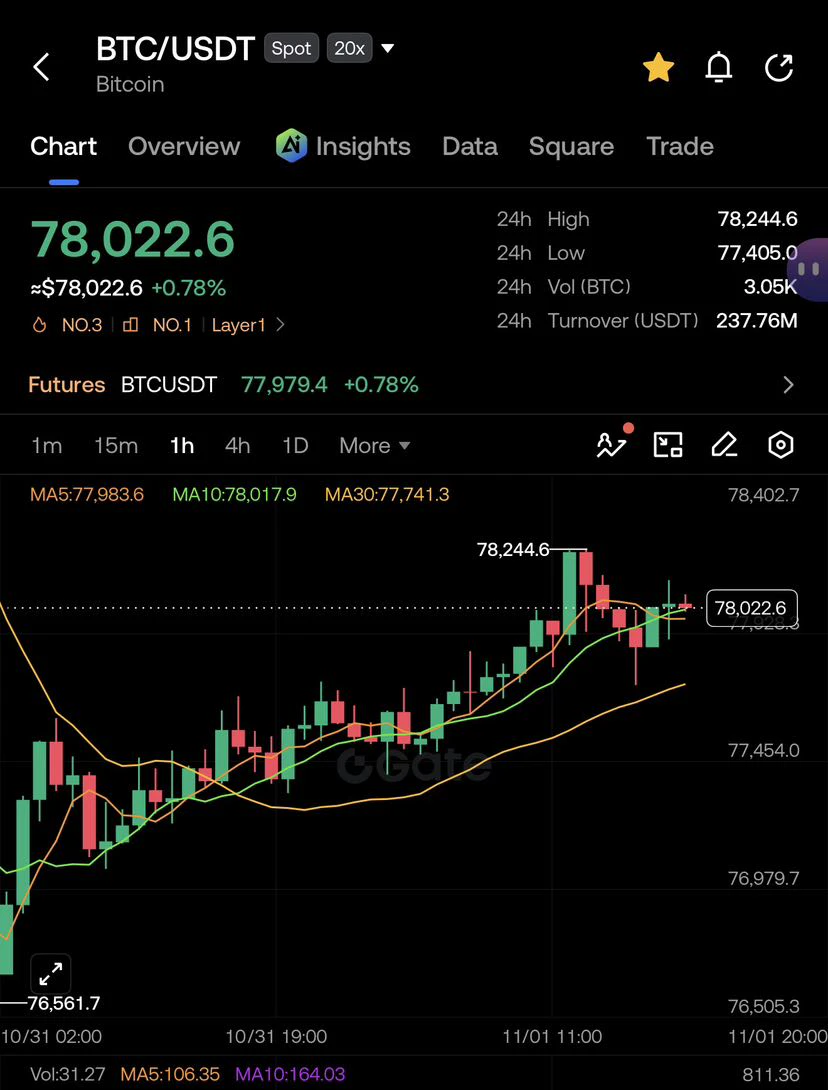
$BTC is trading at $78,022!
Bitcoin is holding near the $78K level as market participants watch for the next major move. A strong push above this zone could bring fresh bullish momentum. Eyes on BTC!
post-image
BTC-0.67%
  • 3
Top 5 Most Popular Hong Kong Stocks — Current Overview
1. $0700 $TENCENT
Last Price: 385.4 HKD, up 2.1%. The most actively traded stock, with daily trading volume of 9.47 billion HKD.
Founder: Pony Ma Huateng and partners — 1998.
Purpose: Social networking and communication through WeChat and QQ, gaming, cloud computing, and fintech infrastructure.
Past Performance: 52-week range: 376–664 HKD. Reached a historic peak above 700 HKD in 2021, followed by a 40% correction.
Support and Resistance: Support around 340–350; resistance at 509, with a target of 647.
Outlook: Game licenses, AI, and reve
TENCENT+1.58%
ALIBABA-W+0.98%
HK50+1.02%
A Whale’s "Two-Sided" Move: A Simple Buy, or a Balancing Act?
An address tagged as a "whale" has added liquidity to the ZIG/USDT pool on PancakeSwap three consecutive times. At first glance, it’s easy to assume that someone is making a massive purchase. In reality, however, the situation is a bit more nuanced: this move involves providing liquidity to both sides of the trading pair. Rather than a one-sided bet on a "pump," this is an effort to build the infrastructure that allows the market to breathe. Meanwhile, another address has withdrawn a small amount of liquidity—a typical, natural adju
post-image
ZIG-8.79%
  • 13
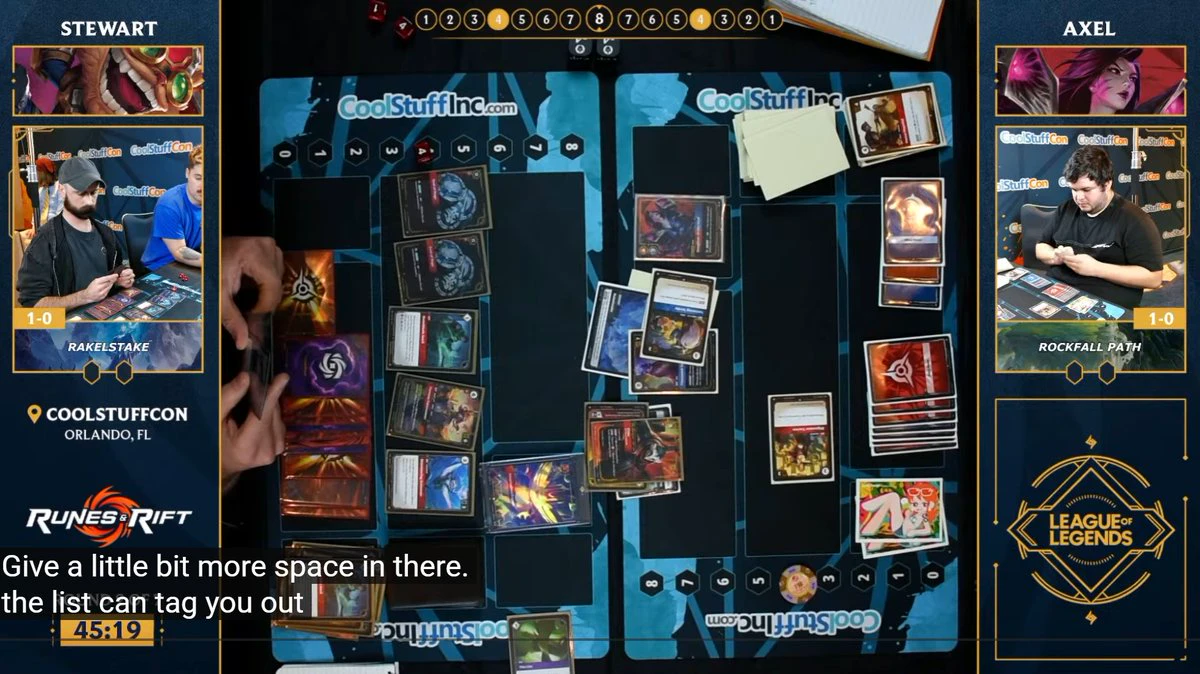
Let's talk about my absolute garbage blunder on stream. TLDR; I forgot about tank on yordle so I unnecessarily trade ferrous for yordle. Then shortly after he breaches watcher and I forgot about the -3M on my swimmer, so I push 1M swimmer + 5M ambush Rengar into the battlefield to just die.
First time on stream, playmat is super cramped, placement of deck is different -- I feel out of place and forget so much.
What the likely optimal line would have been:
Pack and Rengar in hand. The list in exile, able to be played. 11 runes up.
Watcher and yordle at BF, most certainly a breach is hidden. I
post-image
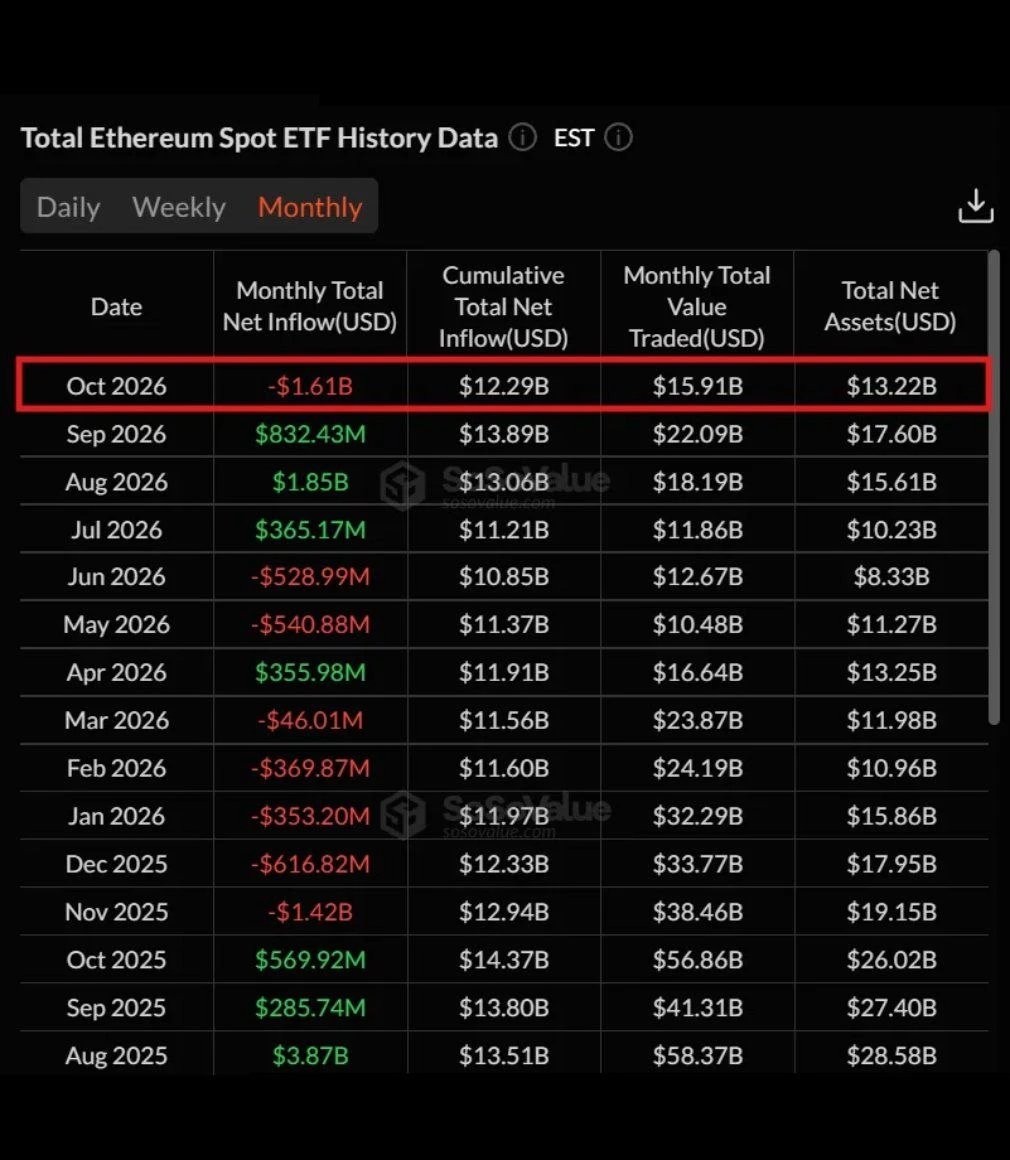
Ethereum ETFs post record monthly outflows of $1.61B.
$ETH
post-image
ETH-1.26%
  • 1
$AKE Down 19% in a single day—would you dare buy at 0.0090?
24-hour trading volume hit $96.9 million, with the price plunging straight from a high of 0.0124 to 0.0084. This isn’t a shakeout; someone is dumping without regard to cost. I’ve been watching on-chain data for two days: large transfers have been flowing into exchanges, and paired with this high-volume bearish candle, it’s a classic distribution pattern—not just panic selling.
Translated into trading logic, it comes down to three points: first, the price is down nearly 20% intraday, but volume hasn’t contracted, which means selling pr
AKE+6.07%
  • 9
  • 1
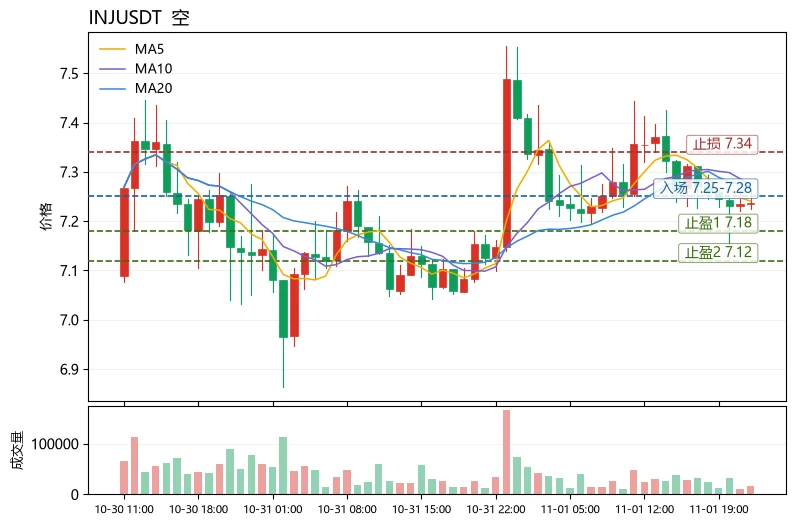
Fear and Greed Index: 34 (Fear), $INJ current price 7.236, 24h +1.19%, trading volume 6.3M USDT. The moving averages show a bearish alignment, with MA5=7.2406 below MA20=7.2694. RSI is only 47.5, the MACD histogram remains negative at -0.01079, and the price is below the Bollinger Band middle line. The 30-candle range is 6.94%, indicating relatively high volatility with no clear direction. The funding rate of +0.0100% shows that longs are still paying to hold positions, creating a divergence between sentiment and market structure: amid broader market fear, BTC's weak consolidation is weighing
post-image
INJ-1.67%
BNB-0.76%
FET-1.52%
#IntelBeatsEarningsButStockPlunges
Intel Beats Earnings But Stock Plunges - Why Beat Was Not Enough
Intel posted a clean beat in Q3, yet the stock collapsed right after, a classic case of strong report versus stretched price.
The Beat
Q3 revenue came at 13.7 billion USD, up 3% year over year, ahead of Street view near 13.17 billion USD. Adjusted EPS was 0.23 USD, well above consensus near 0.02 USD, and far above Zacks view of 22 cents. GAAP net income swung to 4.1 billion USD profit versus a 16.6 billion USD loss a year ago.
On the print, shares first jumped 6% to 10% in after hours, trading
INTC-28.49%
  • 24
  • 3
#美股财报季
The US stock market is entering one of the most important periods for investors as major companies release their quarterly financial results. Earnings season is not just about how much money companies have made. It also reveals the strength of the economy, consumer demand, business confidence, technological development, and expectations for future growth.
This earnings season is particularly interesting because artificial intelligence, rising operating costs, inflation, interest rates, and changing investor sentiment are all influencing market direction.
In my opinion, the biggest ques
$XTIUSD ‌$XBRUSD ‌
1. The quiet slowdown in the Strait of Hormuz
In the final week of October, the daily flow of crude oil passing through the Strait of Hormuz dropped to 7.3 million barrels—more than 40% below pre-war levels. While the average for the entire month hovered around 11.1 million barrels per day, the decline in that last week raises a question: Is this a temporary fluctuation, or the first whisper of a more permanent shift in direction? For the individual investor, the answer to this question has less to do with lines on a chart and more to do with one’s own perception of risk.
XTIUSD+0.03%
XBRUSD+0.56%
  • 12
  • 1
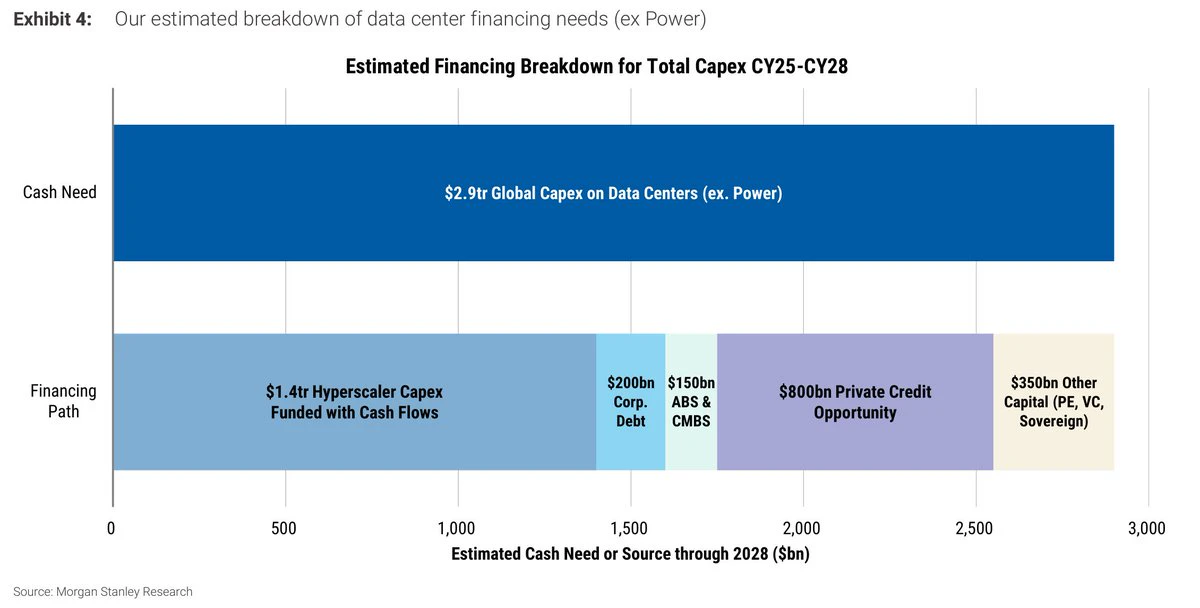
Not sure we'll see strength return to the stock market until we get more data on whether 2026 marks a peak in revenue growth for $ANT/OAI, with a steep slowdown in 2027
Even if we get a resolution with Iran, doubts about capex financing will persist as long as it's unclear whether AI can really scale to trillions in annual revenue before 2030
post-image
#Gate广场万圣节 Bitcoin tests $64,000 to $65K resistance before election, options signal low volatility
BitGo Research notes that as election day approaches, the Bitcoin options market shows traders expect low volatility, with prices forecast to fluctuate only slightly around the election.
BTC is currently testing key resistance in the $64,000 to $65,000 range, with sellers continuing to suppress upward momentum. BitGo’s analysis suggests that although the election results could significantly affect future crypto policy, the calm reflected in options pricing indicates traders remain wary of potent
post-image
BTC-0.67%
Market prediction
live-cover
LIVE1,683
#英特尔财报超预期股价却暴跌 Love you, mwah!😘😘😘😘😘😘😘😘😘😘😘😘😘😘😘😘😘😘😘😘😘😘😘😘😘😘😘😘😘😘😘😘😘😘😘😘😘😘😘😘😘😘😘😘😘😘😘😘😘😘😘😘😘😘😘😘😘😘😘😘😘😘😘😘😘😘😘😘😘😘😘😘😘😘😘😘😘😘😘😘😘😘😘😘😘😘😘😘😘😘😘😘😘😘😘😘😘😘😘😘😘
post-image
INTC-28.49%
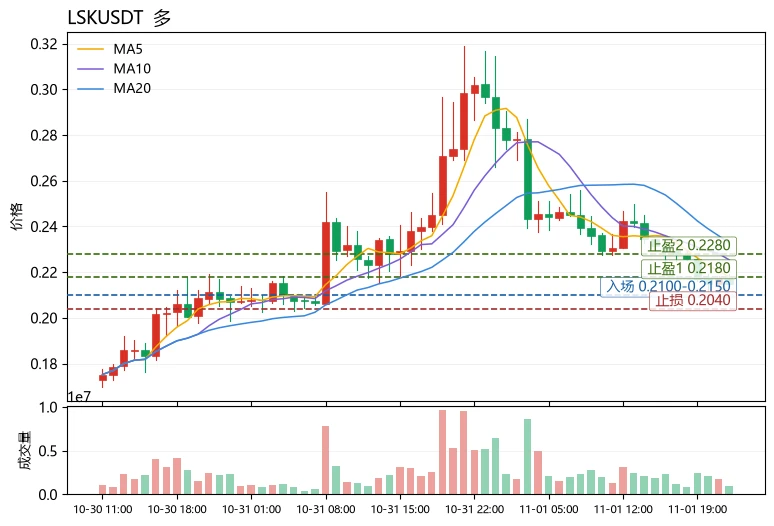
$LSK Bottom line: The funding rate is extremely negative, the price is hugging the lower Bollinger Band, and RSI at 35.7 has not broken below 30. Short crowding has reached a contrarian trading window, favoring a short-term bullish rebound, but only as a small-position recovery trade—not a trend-long position.
Rationale: The funding rate of -0.1487% is deeply negative, making it costly to hold short positions; further price declines could easily trigger short covering. The current price of 0.2148 is close to the lower Bollinger Band at 0.211813. Although MA5 at 0.2179 is below MA20 at 0.23278
post-image
LSK-5.32%
TAO+0.41%
UNI+3.05%
$HOOK Uniswap announced that the volatilepair hook is now live on Ethereum mainnet, initially supporting the ETH/USDC trading pair. The mechanism replaces fixed fees with dynamic fees, adjusting the fees for buyers and sellers separately based on market price movements and recalculating them for every trade. When the price of ETH rises, the buy fee increases and the sell fee decreases, and vice versa when the price falls. After a significant price movement, trades that push the price back toward its previous level also temporarily incur an additional fee. The mechanism aims to reduce losses li
HOOK-9.09%
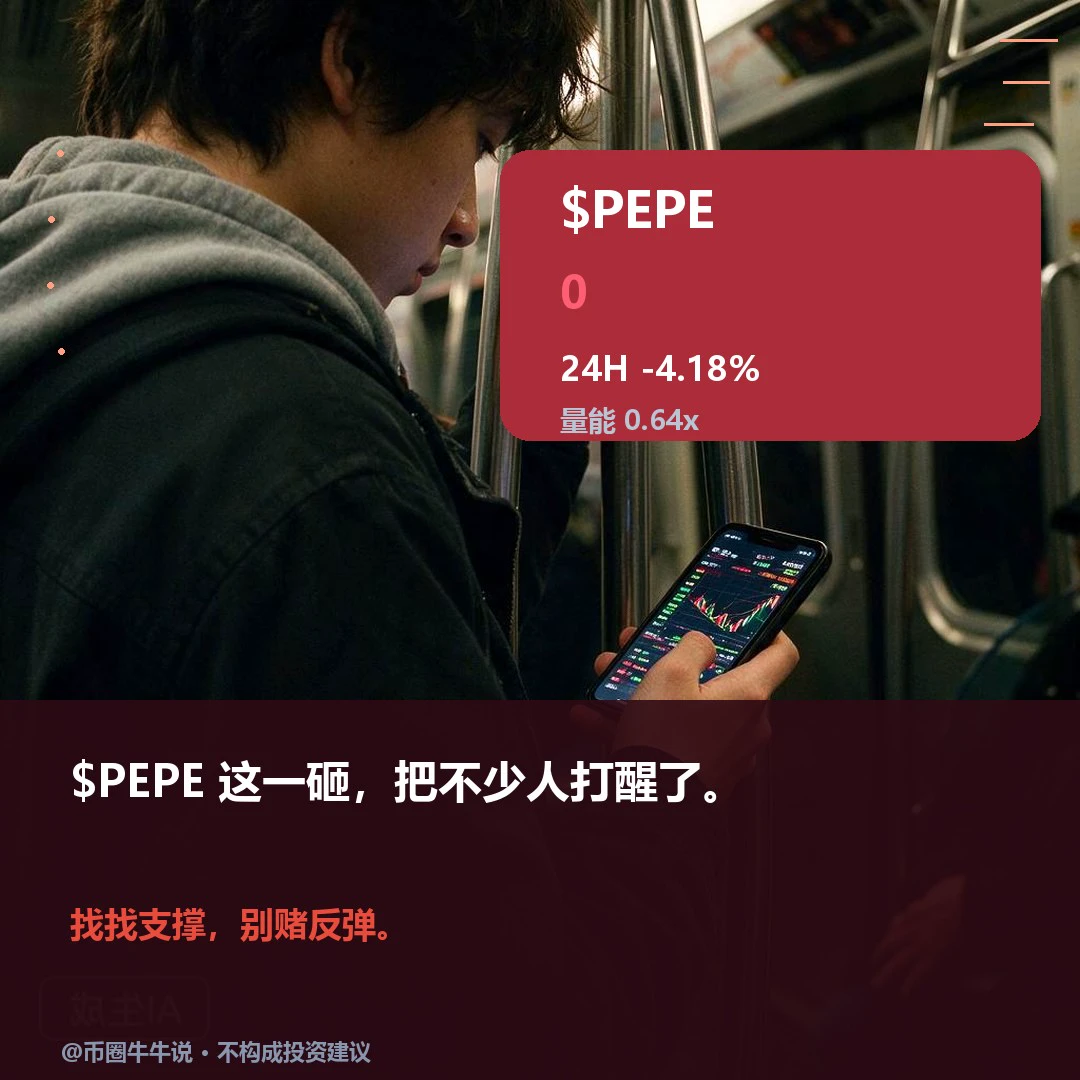
Weakness persists; oversold does not mean the bottom is in. $PEPE is currently trading at 0.00000481. Both the one-hour and four-hour trends are weak. Short-term RSI has entered oversold territory, but trading volume is only a little over 60% of average, indicating that selling has occurred without any stronger signs of buying support. The price is near the intraday low. Oversold conditions only show that selling pressure has occurred; they do not prove that anyone is defending support. If oversold really meant the bottom was in, why is the price still edging closer to the low instead of first
post-image
PEPE+0.97%
Load More

Join 40 M users in our growing community

⚡️ Join 40 M users in the crypto craze discussion

💬 Engage with your favorite top creators

👍 See what interests you

Trending Topics

BTC大跌

478.6k Views39.86k Discussing

$BTC briefly fell below $77,000 and remains under pressure around the $77K zone, with its 24-hour decline still above 4%. With risk appetite weakening and Fed uncertainty rising, where is the next key support after losing $80K?

IntelBeatsEarningsButStockPlunges

43.38k Views1.06k Discussing

StrategySTRCNears100ParValue

51.71k Views4.21k Discussing

View More