


Square
Following
Hot
News
Profile
Share your thoughts
placeholder
Article
ETF funds wash back and forth like tides, flowing in quickly and leaving just as fast. Market sentiment swings sharply with the direction of fund flows—inflows spark cheers that the bull market is back, while outflows trigger fears of an impending crash. 😂
But looking at the market calmly, this looks more like a typical shakeout and should not be overinterpreted.
The short-term outlook is indeed weak, and another sizable correction is likely ahead. The key variable is the Fed meeting: if it signals a continued hawkish stance, rate-cut expectations disappoint again, and U.S. stocks weaken, Bit
post-image
BTC-0.75%
crypto Market updates
live-cover
LIVE805
Trenches
STONK
S
bade
b
STONK
6GmA...UNgx
Market Cap
$.
Change
.
24h Vol
$.
Holders
.
BTC
B
bade
b
BTC
C5xp...pump
Market Cap
$.
Change
.
24h Vol
$.
Holders
.
CNPY
C
bade
b
CNPY
0xc6...ddd2
Market Cap
$.
Change
.
24h Vol
$.
Holders
.
ZIG
Z
bade
b
ZIG
0x8c...1145
Market Cap
$.
Change
.
24h Vol
$.
Holders
.
LAUNCH
L
bade
b
LAUNCH
AhBi...Qj6C
Market Cap
$.
Change
.
24h Vol
$.
Holders
.
🚨 Just opened a quick short trade on $DODOX
; it will drop. Take profits: 0.0230/0.0255
post-image
Floki all time high hype ath go
post-image
FLOKI-2.67%
The empty-basket strategy from Sunday evening continued to decline as expected into this morning: $BTC fell from 80919 to 79773, and $ETH fell from 2364 to 2308, yielding 1100 plus 56 points.
ChenMingyuan_guanjin
Good evening, October 25! Bitcoin’s daytime bullish candle rose to 81008 before turning bearish and falling to 80050. This week: four longs, four shorts, eight wins and one loss. Everything is publicly transparent online and can be reviewed repeatedly, for a total of 8000+360 points in gains.
Sunday evening
Short near 80600-81100, targeting
around 79700-78900
Short near 2345-2365, targeting
around 2300-2260
$BTC $ETH

BTC-0.79%
ETH-1.11%
Stablecoins Are Not Cash: 4 Boundaries to Understand Before Using Them
Stablecoins are often seen as a bridge between traditional finance and the cryptocurrency market.
They can be used for trade settlement, on-chain transfers, DeFi applications, and cross-border value transfers. But many people overlook one issue:
A relatively stable price does not mean an asset is risk-free.
Before using stablecoins, there are four boundaries worth understanding.
1. A price peg does not mean you can always redeem at the target price
Stablecoins are usually pegged to an asset, such as the U.S. dollar. But the
post-image
  • 1
  • 1
Good morning, Zuo Zuo has caught you up on weekend U.S. markets☕
Trump laid it all out on Fox on Sunday:
“I have a decision to make: do I wrap this up, or make a deal? That’s it.”
Then, after leaving the White House later, he added: “There won’t be a strike today.”
The market is betting on “a deal” for now:
U.S. stock futures bounced slightly, with the S&P 500 up 0.4% and the Nasdaq up 0.6%
Brent crude pulled back from Friday’s $116.72 to around $115
BTC is quietly holding at 80.3K, ETH at 2,336, SOL at 101
Zuo Zuo thinks this week is basically the gas station scene from No Country for Old Men
post-image
BTC-0.75%
ETH-1.04%
SOL-0.79%
MSFT+0.56%
GOOGL-1.21%
  • 1
Market update BTC
live-cover
LIVE795
a16z-backed DATA just retired its own blockchain and moved onto Sui, with a $30M check from the Sui Foundation attached.
That's a team choosing to rent instead of build, guys.
Stack that on Samsung Wallet bringing USDC on Sui to 82M US Galaxy phones, and Mysten Labs handing its CTO Evan Cheng a dedicated AI unit to run.
And sui:native? Around $0.92, back under a dollar.
Builders keep moving in while the chart keeps sliding, right?
How long can that gap stay open?
post-image
SUI-1.76%
USDC+0.00%
SAMSUNG+0.00%
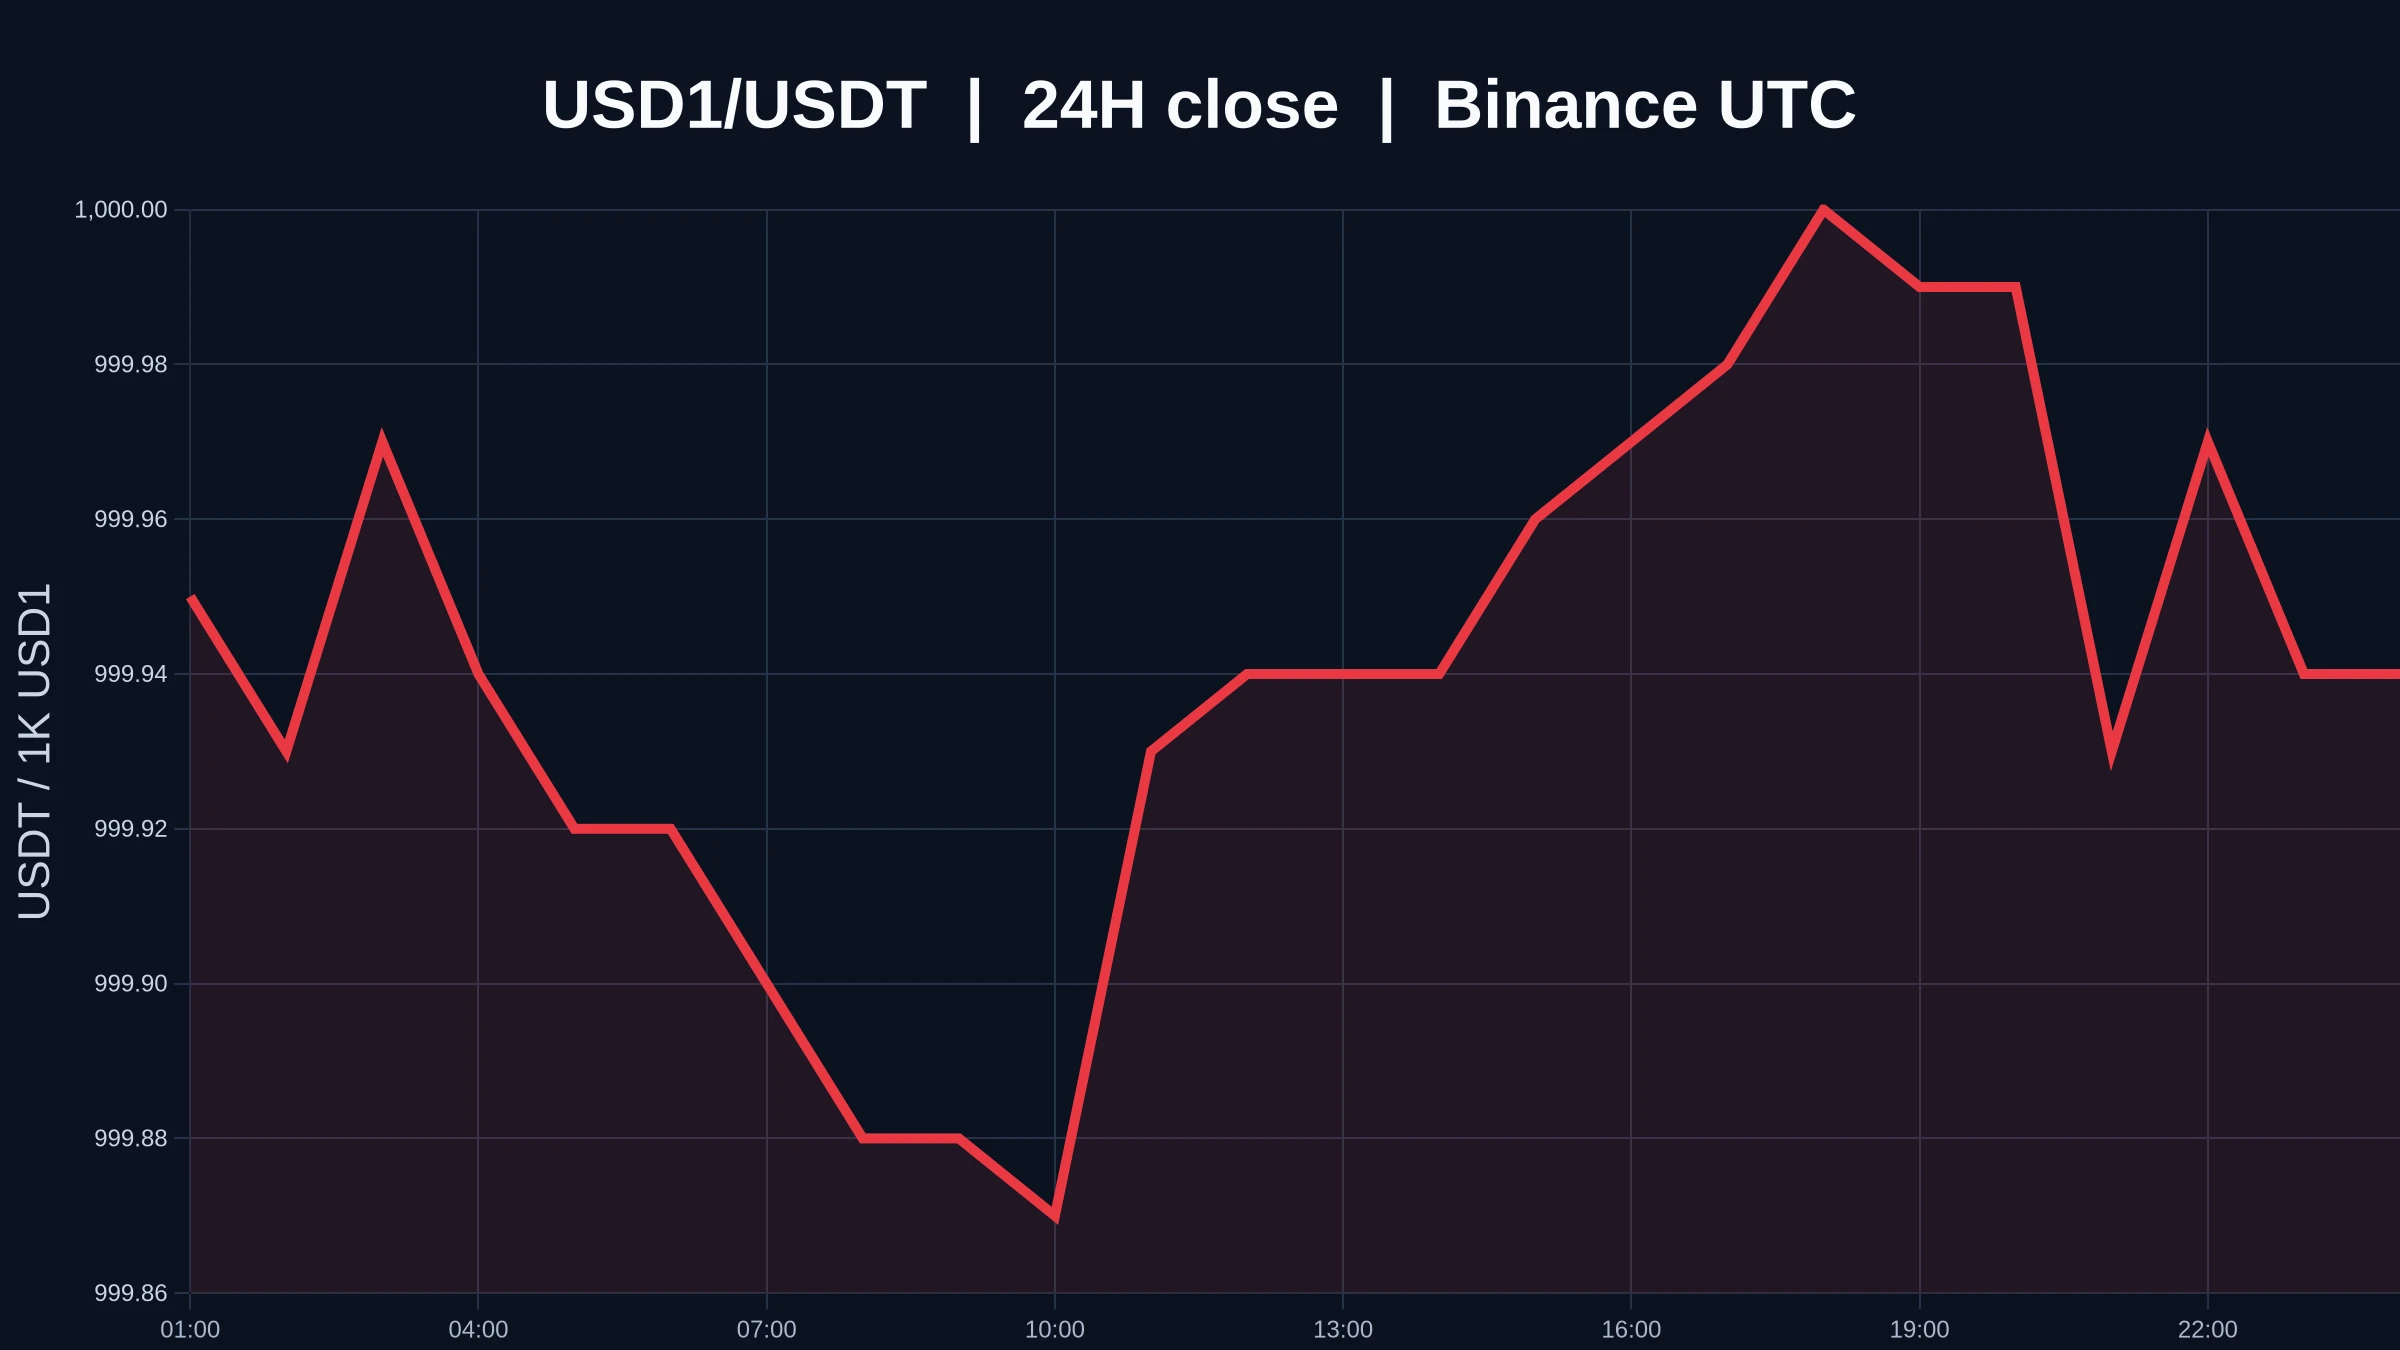
$USD1 's 24-hour result is +0.00%, but that is an outcome, not a cause or a prediction. What we can confirm now is 0.99995, volume at 0.07x, and a bullish bias on both the 1-hour and 4-hour timeframes.
The easiest mistake here is to focus only on candlestick colors and ignore participation, mistaking a test for a genuine breakout. You can tentatively trust the direction, but not assume it will continue; a move without follow-through can be reversed at any time.
Reading the chart can be simple: below 0.99987 is one outcome, above 1 is another, with wider boundaries at 0.99952 and 1.0001, respect
post-image
USD1+0.00%
The Strait of Hormuz is under threat every day, yet Middle Eastern oil exports are actually higher than before the war, with Saudi and UAE pipelines doing a pretty good job of bypassing it. But the cost is that freight rates and war-risk insurance have skyrocketed. Who ends up paying the bill? What about where you are?
post-image
Stable, the chain that uses USDT0 for gas, has more than 3 times as many stablecoin holders as Tempo, the payments chain incubated by Stripe.
Stable's USDT0 has 761,716 holders. Tempo has 227,478 across every stablecoin on it.
@Stable
STABLE-2.34%
$BTC The buy wall at 80k is unbelievably strong. Several times, the price just broke below it and was immediately pulled back up, like a spring. The more I watch this price action, the more suspicious I get—are they deliberately putting on a “80k iron floor” act to make retail traders feel secure and rush in to buy at this level? Anyway, yesterday I followed Ai’s signal and opened a short position. $ETH $SOL
Risk warning: The above is only my personal trading record and market observations, and does not constitute any investment advice. Contract trading carries extremely high risk, so please m
post-image
BTC-0.79%
ETH-1.04%
SOL-0.79%
Does a high funding rate mean the market is bound to fall? Don’t treat one indicator as a trading signal
In the cryptocurrency derivatives market, funding rates are often used to gauge sentiment among bulls and bears.
But there’s a common misconception: a positive funding rate means the market is bound to rise, while an excessively high funding rate means prices are about to fall.
Funding rates reflect the cost of holding positions in the derivatives market and the balance of demand between bulls and bears, not a direct prediction of price movements.
Understanding this requires looking at thre
post-image
  • 1
  • 1
The world is drowning in unlimited supply, endless printing, and disposable tokens.
True rarity begins with a limit.
21 million is more than a number. It's a philosophy of scarcity, discipline, and conviction.
21,000,000 bitcoin:native = 21,000,000 ethereum:0x42069026eac8eee0fd9b5f7adfa4f6e6d69a2b39
@MSTR2100 THE MEMECOIN OF BITCOIN
post-image
BTC-0.75%
ETH-1.04%
MEME-2.22%
Wall Street's $359 billion-a-day repo market finds use for blockchain
Billions of dollars move through Wall Street every morning just to cover the hours between payments, and blockchain is now making those temporary loans easier to arrange.
Quick Take
⚠️ Personal market analysis only. NFA — manage risk and DYOR.
Educational content, not investment advice or a recommendation to buy, sell, deposit, or withdraw any asset. No paid promotion or referral/affiliate links.
post-image
Can you all help me figure out if my cousin got scammed?
She said these earrings were a gift from her boyfriend. She’s been showing them off to me and seems really happy. She said her boyfriend told her they were worth several thousand euros.
They do look pretty delicate, but something about them just feels off, though I can’t put my finger on it.
Maybe I just don’t know much about jewelry. I’ve never seen earrings like these before.
post-image
$ENA 's strength and crowding are appearing at the same time; the key is the first pullback
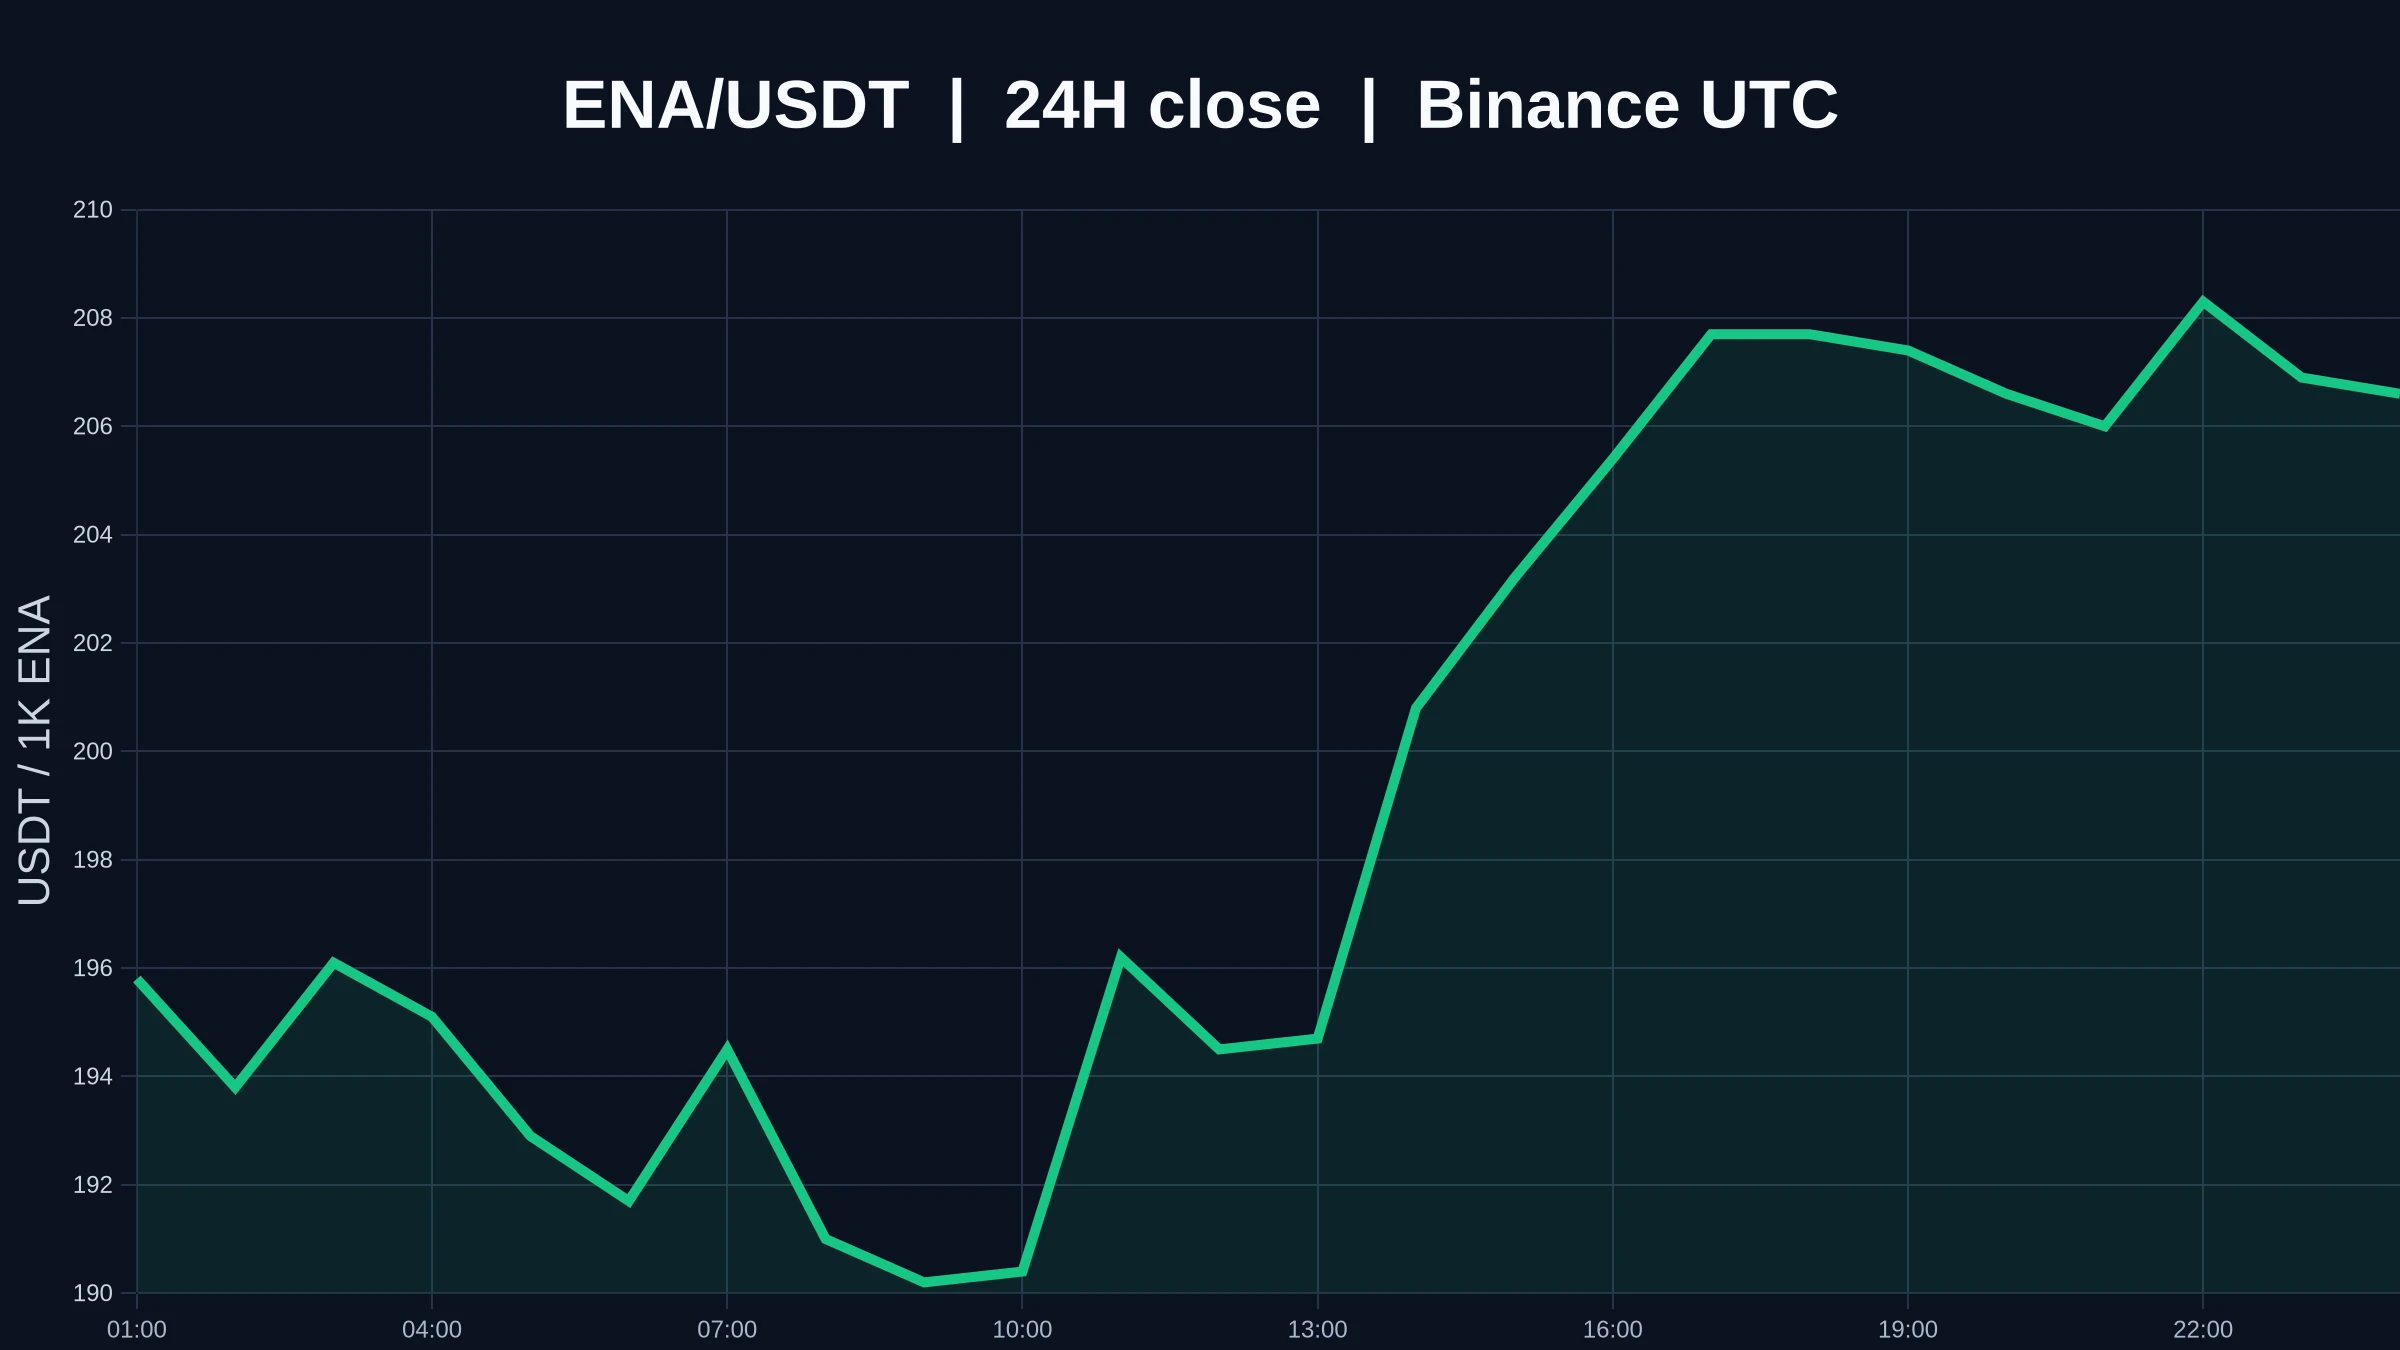
$ENA The specific facts in this snapshot are: the current price is 0.2061 USDT, up 5.69% over 24 hours, with a high of 0.2116 and a low of 0.1887. The 1-hour trend is bullish, the 4-hour trend is bullish, and trading participation is 0.30x. Strength remains, and crowding has not been definitively established, but there is no complete answer yet as to how much space crowding occupies. This level offers no final answer, only a short-term framework. This snapshot offers no final answer. The price is fluctua
post-image
ENA+5.77%
#SpotGoldFallsBelow$4000
#ShareWeekly
Gold Below $4,000: Is This a Deeper Correction or a Buying Opportunity?
The gold market has entered a critical phase after spot gold dropped below the psychologically important $4,000 per ounce level. Recent prices reached approximately $3,975–$3,986 before stabilizing near $3,990–$3,997. This breakdown has changed the short-term market structure, raised questions about investor confidence, and placed the next major support zones under the spotlight.
My view is that this decline should not automatically be interpreted as the end of gold’s long-term bulli
Load More

Join 40 M users in our growing community

⚡️ Join 40 M users in the crypto craze discussion

💬 Engage with your favorite top creators

👍 See what interests you

Trending Topics

USEarningsSeason

107.82k Views3.55k Discussing

The U.S. Q3 earnings season is in full swing, with major tech companies including Tesla and Meta reporting results. Market focus is shifting beyond revenue and profit toward AI spending, capital expenditure, margins and forward guidance. Which company’s earnings are you watching most closely?

GateWCTCS9GlobalTradingCompetition

747.56k Views8.13k Discussing

USConsumerSentimentNearRecordLow

13.77k Views313 Discussing

View More