Square
Following
Hot
News
Notifications
Profile
Share your thoughts
placeholder
Article
#GoldNears3500
Gold’s Safe-Haven Role in a Cross-Asset Selloff

Gold’s simultaneous drop alongside equities—falling roughly 9.4% on the week to touch $3,502.49 on November 20 (down more than 35% from its January 2026 record peak near $5,405)—does not mean its safe-haven status is permanently broken, though it does highlight which risks gold actually hedges.

Inflation & Rate-Hike Regimes vs. Growth Shocks: Gold is a hedge against currency debasement, systemic banking stress, and growth-driven recessions where central banks cut rates. When inflation surprises to the upside—fueled by sticky con
XAU+0.38%
What if $SOL post 5's stop is below post 4's entry?
73.13 vs 73.49. A 4.9% rally kills one and neutralizes the other.
Same move, opposite outcomes. 👇
$SOL ‌$EVAA ‌$IDOL ‌$NVDA ‌
SOL-0.74%
SOL-0.77%
EVAA-0.42%
IDOL-7.01%
NVDA-13.84%
  • 1
Trenches
PIEVERSE
P
bade
b
PIEVERSE
0x0e...25a9
Market Cap
$.
Change
.
24h Vol
$.
Holders
.
IDOL
I
bade
b
IDOL
0x3b...ab07
Market Cap
$.
Change
.
24h Vol
$.
Holders
.
JAGENT
J
bade
b
JAGENT
0x8e...ae15
Market Cap
$.
Change
.
24h Vol
$.
Holders
.
Singularity
S
bade
b
Singularity
7R4M...pump
Market Cap
$.
Change
.
24h Vol
$.
Holders
.
mihao
m
bade
b
mihao
4Cxj...pump
Market Cap
$.
Change
.
24h Vol
$.
Holders
.
#Gate直通IPO第三期ANT总配售92100股 When 152 million USDT in retail subscription demand collides with a hard supply quota of 92,100 ANT shares, the resulting 5.03% allocation ratio tells a far deeper financial story than headline oversubscription alone. Finalized on November 19, 2026, Gate Direct IPO Phase 3 priced Anthropic, PBC (NASDAQ: ANT) at its official global offering rate of $83.00 per share distributing 7,644,300 USDT in total equity value to participants' Gate Stock Accounts while refunding the unallocated 94.97% of committed capital back to Spot Accounts.
With ANT now trading near $88.95 on G
post-image
ANT-8.68%
NVDA-13.84%
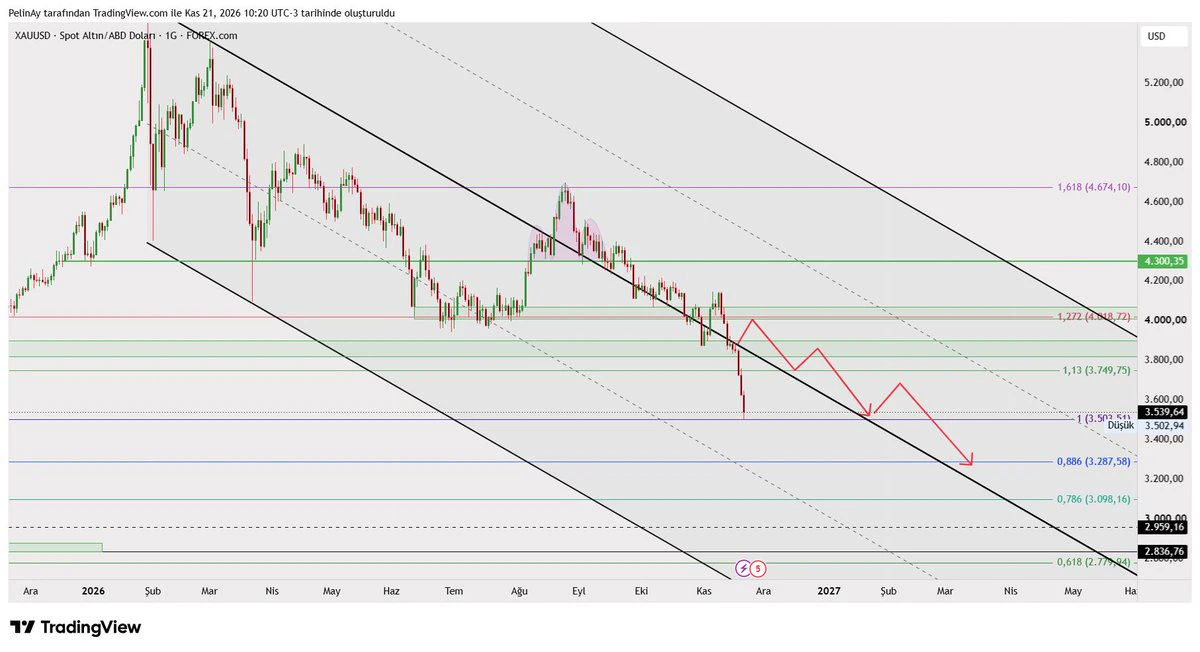
Gold per ounce has fallen to $3500. I expect a rebound from the $3200-$3500 range. Then it will drop to $2800 and begin rising. #XAUUSD #Altın
⚠️ This is not investment advice.
post-image
XAUUSD-2.40%
The current ETH/USDT market presents a complex picture when combining on-chain metrics with technical price action.

According to Coinglass data, the order books show a stark asymmetry. There is a large bid concentration near 1650 dollars acting as local support, but significant sell orders are stacked at 1700, 1800, and 1900 dollars. This creates a major barrier for upward movement. Liquidation maps indicate that a move above 1841 dollars could trigger short liquidations, while a drop below 1668 dollars threatens long positions. The funding rate is negative, pointing to bearish sentiment, yet
ETH-1.23%
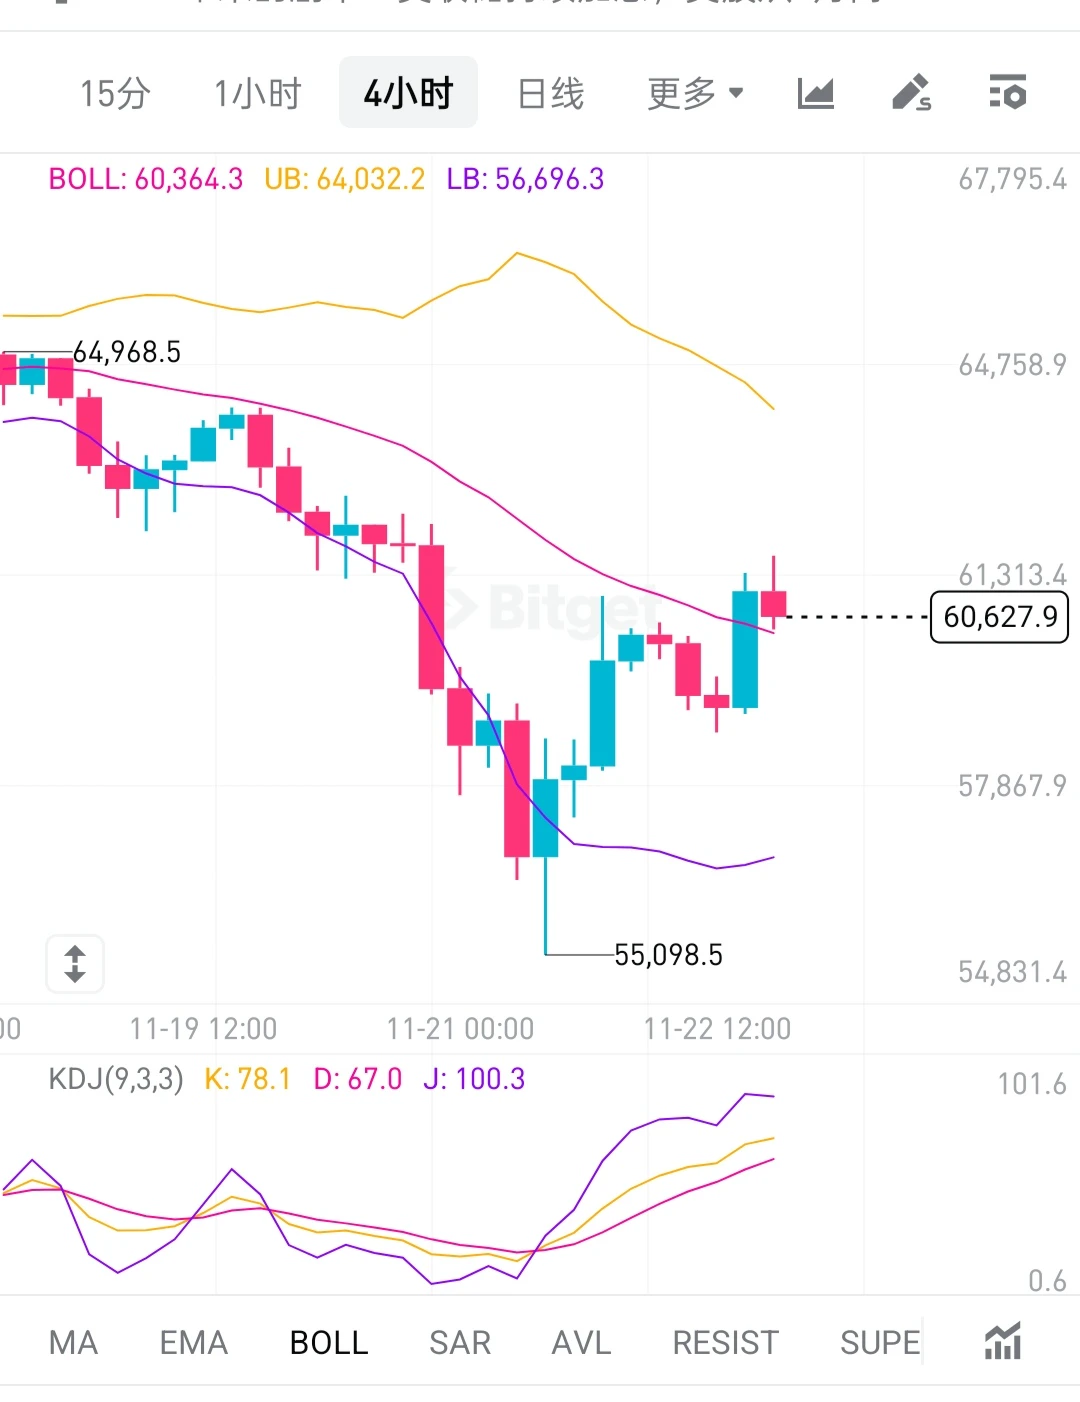
11/22 BTC:

On the 4-hour chart, the current price is near the middle band, with the low touching around 55100. This is a rebound recovery after a sharp drop. The upper band resistance is around 64000, and the lower band support is around 56700. The overall larger structure remains bearish, with the area near the middle band serving as the short-term bull-bear dividing line.
​
KDJ indicator: K is 78.1, D is 67.0, and J is 100.3. It is nearing overbought territory. Short-term rebound momentum is strong, but the price could face resistance and pull back, so chasing the rally is not recommended.
post-image
BTC-0.67%
$PI CT never forces anyone to remain confident or hold on...

As Dr. Nicolas once said, only the faithful will receive special privileges when the time comes.
post-image
PI-0.60%
#GoldNears3500
🥇 #GoldNears3500

Gold is getting closer to the important $3,500 level, and traders are watching this price zone very carefully.

The next move could be important for the gold market. If buyers maintain strong momentum, gold may move higher and test new resistance levels.

However, if sellers enter the market, we could see a pullback or a short-term correction.

Traders should also pay attention to US economic data, inflation reports, interest rate expectations, and dollar strength because these factors can influence gold prices.

Let's discuss!

1. Can gold break above $3,500
XAU+0.38%
$BTC Is this move really about to turn upward? I just saw that Aoying added another $580,000 BTC long position on an exchange, with an average entry price around 60650.

Including the $500,000 long position from noon today, this guy now has $1.08 million in BTC longs. The strangest part is that he’s usually been all-in on short positions, but today he switched things up and chased into a long after the rally. It looks like he probably expects a decent rebound this time around, so the right-side signal seems confirmed.
But let’s be clear: Aoying has been caught out before. Follow his trades if
post-image
BTC-0.65%
#美国11月初请失业金人数高于预期
At first glance, a softer U.S. employment reading should give beaten-down risk assets room to breathe. Yet when the U.S. Department of Labor reported that initial jobless claims rose to 203,000 for the week ending November 14 coming in above Wall Street’s 197,000–198,000 consensus forecast the Nasdaq Composite still dropped roughly 2.25%–2.3% that session (before plunging another 5.28% on Friday, November 20), while Bitcoin broke decisively below $60,000 to test the $55,123–$58,914 zone into November 22, 2026.
Understanding why mildly cooler labor data failed to spark a reli
post-image
BTC-0.67%
NVDA-13.84%
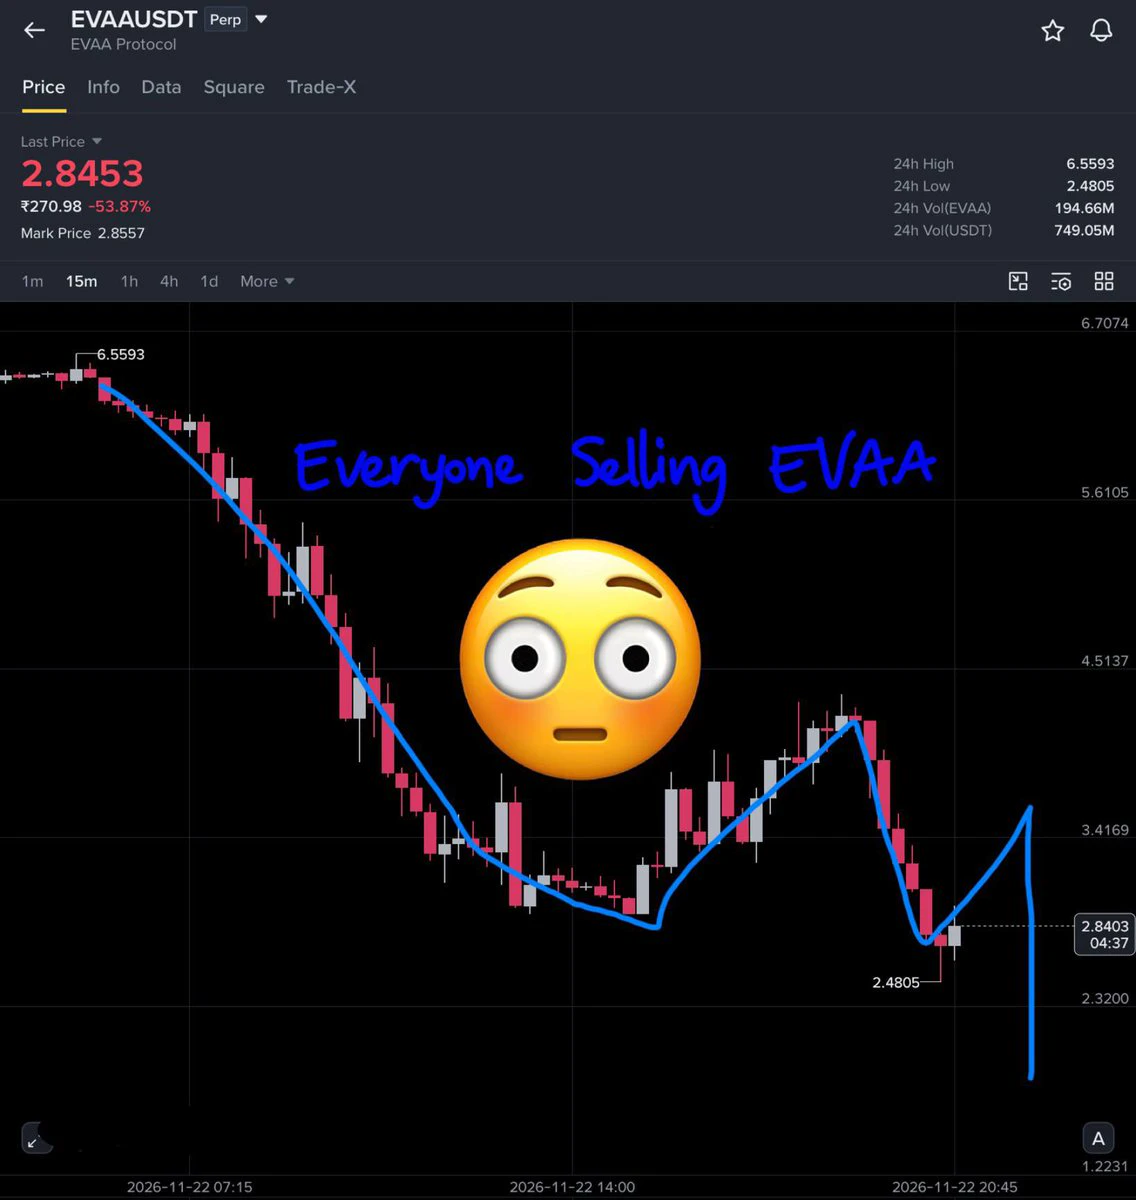
$EVAA SELL CONTINUES, DON’T FALL IN BULLISH TRAP 🙏
post-image
EVAA-0.49%
  • 2
  • 2
BWA asks Finance Ministry for crypto tax changes ahead of Budget 2027
The Bharat Web3 Association (BWA) sent its crypto industry recommendations to the Ministry of Finance during pre-budget consultations for Union Budget 2027. It announced this on X on November 21, 2026.
What BWA asked for:
🔸Tax relief: Reconsider the 1% TDS on crypto transfers, let investors set off and carry forward crypto losses, and review the 30% tax on crypto gains.
🔸Offshore platforms: Make clear that Indian TDS and reporting rules apply to offshore exchanges serving Indian users.
🔸Enforcement: Enforce registration a
post-image
  • 1
#BTCReboundFaces60KTest: What the Orderbook and Charts Are Telling Us

BTC bounced from the 55.1K low and is currently sitting around 59.2K. It briefly poked above 60K but couldn't hold it. Now the market is back to deciding what happens next.

Looking at the charts and the orderbook data, here is the current picture.

The path of least resistance isn't clearly upward right now. There are heavy sell walls stacked above the current price. According to CoinGlass, there is about 10,000 BTC in sell orders right at the 60,000 mark. If the price pushes through that, there is a much larger block arou
post-image
BTC-0.67%
$SNDK A rebound in U.S. stocks next week will lift the AI and crypto sectors! If SanDisk holds at 83, it will head to 85, then 88! Anyone without a position can go long now!
post-image
SNDK-0.18%
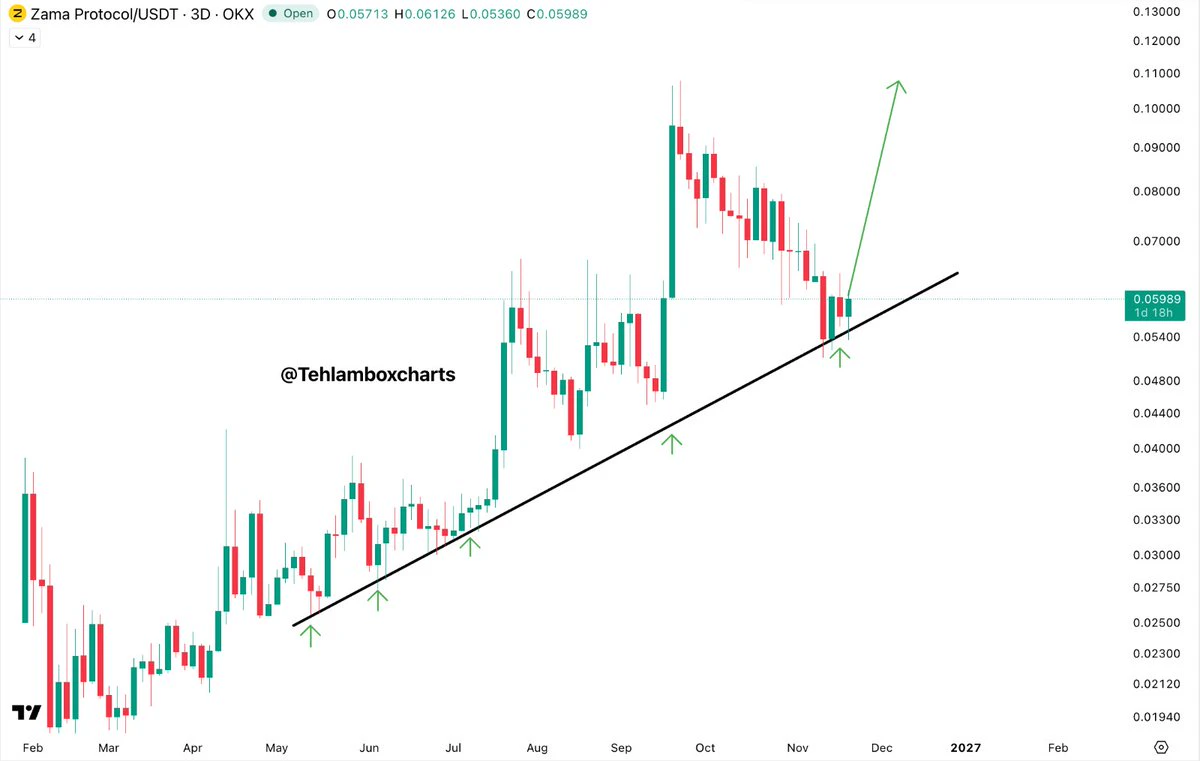
$ZAMA is approaching a pretty promising entry zone
Trendline support is holding for now, expect a mega bullish rally again
$0.11 going to be our next TP
post-image
ZAMA+2.26%
Crypto Fear and Greed Index drops to 11, market sentiment plunges to freezing point.
live-cover
LIVE1,438
BTC-0.67%
ETH-1.26%
SOL-0.77%
USDC+0.01%
XRP-1.15%
Whales Moves in Sync!
live-cover
LIVE1,812
BTC-0.67%
ETH-1.26%
ZEC+1.16%
SOL-0.77%
USDC+0.01%
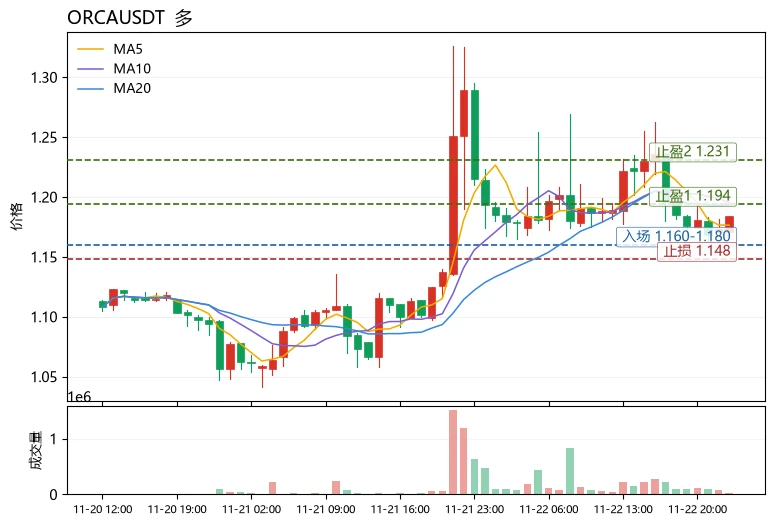
Does a moving-average death cross necessarily mean you should be bearish? Not necessarily—the key is the price’s position relative to the moving averages and whether momentum indicators are weakening in sync.
Take $ORCA as an example: the current price of 1.184 is above MA5 (1.1764) but remains below MA20 (1.1936), a typical “short-term recovery, medium-term not yet strengthened” structure. To assess whether the trend is healthy, use a three-step approach: first, check the moving-average alignment; MA5
post-image
ORCA-5.19%
INJ-1.67%
FET-1.52%
👀 WHAT IF BITCOIN $BTC IS ABOUT TO SURPRISE EVERYONE?
What if this dip is just the calm before the biggest rally? 🚀📈
What if the next move catches everyone off guard?
Never underestimate Bitcoin! 👀🔥
Are you still bullish on $BTC? 🫡
#Bitcoin #BTC #Crypto #BullRun
post-image
BTC-0.67%
  • 1
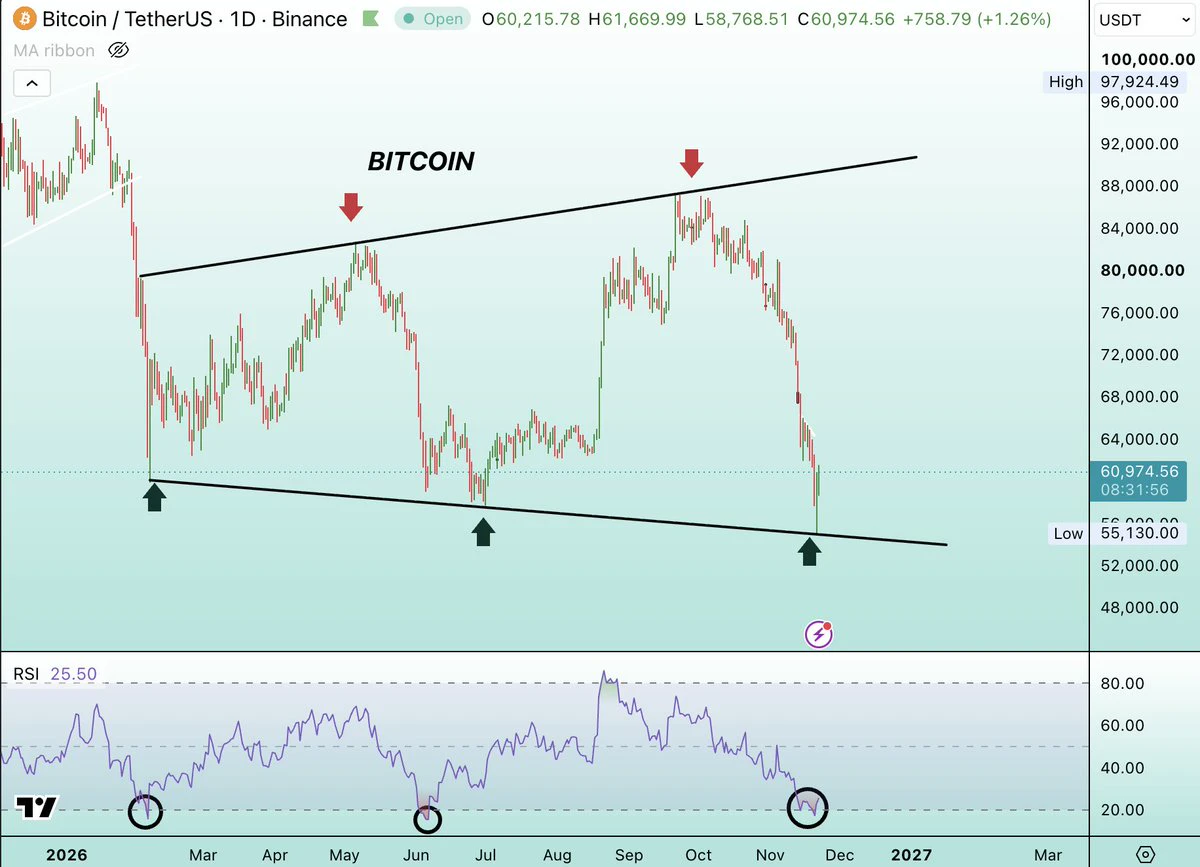
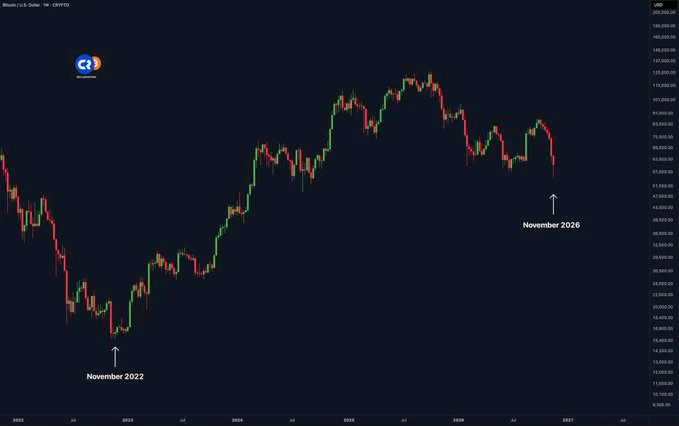
$BTC : Bitcoin surged 10% and back above $60,000 after making new cycle bottom at $55,130 on 21 Nov 2026.
Exact on same date BItcoin formed bottom in 2022.
Fear and Greed Index hit 6, means everyone in fear which give me another reason to buy this level,
Expecting $35,000 is same like Capo expect $10,000 in 2022. Here you will fine new capo too and truth no one predict any bottom in chart.
#DYOR comment your thought for healthy discussion.
post-image
BTC-0.67%
  • 2
Load More

Join 40 M users in our growing community

⚡️ Join 40 M users in the crypto craze discussion

💬 Engage with your favorite top creators

👍 See what interests you

Trending Topics

BTCReboundFaces60KTest

2.1M Views30.1K Discussing

BTC rebounded from around $55,300 on November 21, briefly reclaiming $60,000 before pulling back to around $59,300. The $60K level is back in focus as traders assess whether the recovery can last. Is this rebound a sign of stabilization or a short-lived recovery? Would reclaiming and holding $60K be enough, or do you need confirmation from trading volume and fund flows?

PCEAndGDPDataNextWeek

260K Views2.6K Discussing

GateDirectIPOPhase3ANTAllocates92100Shares

845.6K Views5.1K Discussing

View More