Share your thoughts
placeholder
Article
Everyone's staring at the 4h chart, but the 1D tape just whispered a secret about $LAB /USDT.

$LAB /USDT - SHORT

Trade Plan:
Entry: 0.07406 – 0.07462
SL: 0.07704
TP1: 0.07231
TP2: 0.07096
TP3: 0.06893

Why this setup?
Why now? The daily trend is bearish, and the 15m RSI sits at 42.95—weak, not oversold.
- Short entry zone locked: 0.07434 (ref) with a tight trigger band between 0.07406–0.07462.
- TP1 at 0.07231 is a 2.7% drop, but TP3 at 0.06893 is where the real vacuum lives.
- Invalidation sits at 0.07423—if we lose that, the bearish thesis cracks.
The 95 confidence score isn’t a
LAB+5.06%
$BULLA Signal】Long + 1H pullback rebound
$BULLA After pulling back to 0.0575 on the 1H, it quickly rebounded to 0.0604, while the 4H Bollinger upper band continues to expand. RSI is 65 on the 4H and 59 on the 1H; MACD histograms are contracting on both timeframes, and the bullish momentum remains intact.
🎯Direction: Long
⚡Entry/Pending order: 0.06025170 - 0.06043300
🛑Stop-loss: 0.05982867
🚀Target 1: 0.06133950
🚀Target 2: 0.06179274
🛡️Trade management:
- Reduce position by 50% upon reaching Target 1 and move the stop-loss to breakeven. - Exit if it falls back to the entry price.
Depth ana
post-image
BULLA+61.92%
BTC+0.28%
ETH0.00%
SOL+0.92%
JUST IN: CENTCOM says the U.S. sank three IRGC crude oil tankers after Iranian attacks on two U.S. Navy ships. If confirmed, this could escalate regional risk and affect oil flows in Gulf waters. $IRGC? (no ticker implied)
post-image
How to Trade After Nonfarm Payrolls? My Real Trading Plan and Three Painful Lessons
After this “black swan” nonfarm payrolls report, I reviewed my trades and summarized three painful lessons and my trading plan going forward.
Lesson 1: Don’t open new positions before major data releases. I saw BTC break above 82000 during the day and impulsively chased a long position, only to go straight into floating losses when the nonfarm payrolls data came out. From now on, I absolutely will not open new positions in the 48 hours before major events such as nonfarm payrolls, CPI, and FOMC meetings—I will
MU+5.89%
aster-2:native has pumped again!
Fam, take a guess—is this a breakout or yet another, yet another fakeout?
post-image
ASTER+12.40%
Damn, can you still sleep when you're already at a floating loss like this?
post-image
#MU
MU Market Analysis — Can Micron Push Beyond $1,000 Again?
Micron Technology (MU) has delivered a powerful recovery and is once again trading around the psychologically important $1,000 level. Your reference price is $1,011, while the latest market data shows MU closing around $1,016.59 after a strong 6.03% daily move. The stock reached an intraday high near $1,018.06 after opening around $973.80, showing that buyers were willing to aggressively defend the lower levels and chase momentum higher.
The most important point right now is that MU has reclaimed the $1,000 psychological zone. Frid
post-image
Market Updates
live-cover
LIVE2,178
U.S job report market impact
live-cover
LIVE1,727
🚀 Dash surges 33.6% to $66.55 while Bitcoin dips to $79,716! With a $2.7T market cap, are we seeing a shift in dominance? 💰 What’s driving this sudden spike? $DASH #CryptoTrends
DASH+37.08%
BTC+0.28%
Everyone’s staring at Bitcoin—but ZEC just flashed a 95% long signal that nobody sees coming.

$ZEC /USDT - LONG

Trade Plan:
Entry: 1010.20 – 1018.74
SL: 973.52
TP1: 1045.18
TP2: 1065.65
TP3: 1096.36

Why this setup?
- 4H structure is *Armed* at 1014.47 with 1D trend still bullish.
- RSI (15m: 53.21) is coiled, not overheated—room to run.
- ATR (1h: 17.06) says volatility is expanding *in your favor* right now.
- Why now? Price is holding above entry_low (1010.20) while TP1 (1045) is only 3% away—momentum is loading, not fading.

Debate:
If this breaks 1018, do you trust TP2 at 1065
ZEC+2.41%
Big 5 League Trading Festival ⚽
September 6 brings action from the Premier League, Bundesliga, Ligue 1, La Liga and Serie A.
Trade Big 5 League events on Gate to earn Scratch Cards, Prediction Points and other rewards, with 20,000 USDT in Points Boost rewards also live.
Don’t miss today’s fixtures and trading opportunities.
#Gate60MUsers
post-image
  • 8
  • 1
🚨 $FLOCK /USDT VOLATILITY BOUNCE & CONTINUATION
📊 TRADE SETUP OVERVIEW
Pair: $FLOCK /USDT
Direction: LONG / BUY
Leverage (Futures): 3x – 5x
🎯 KEY LEVELS & SIGNAL PARAMS
Entry Zone: $0.05200 – $0.05480
Take-Profit Targets:
🎯 TP1: $0.05900
🎯 TP2: $0.06540
🎯 TP3: $0.06850
Stop-Loss (SL): $0.04850
$FLOCK ‌#Gate60MillionUsers
post-image
FLOCK+46.35%
  • 8
With this move, I don’t even need to think—the account is dancing on its own.
The last thing I saw before bed a few days ago, $ASTER was still moving sideways at the bottom, with buying pressure gradually strengthening. It was clearly building momentum. I figured the risk was limited at that level, so I placed my position there, set a stop-loss, and went straight to sleep.
Then I woke up this morning and—wow—the current price had shot straight to 0.8463. From 0.6658 to here, the unrealized gain was +1923.92%.
It feels amazing, but don’t get greedy for the last bite. I’ve taken profit on 80% f
post-image
ASTER+12.64%
SNDK+7.12%
XRP-0.01%
$69eleven
0xbc191b1d09e51cbe10c15c9191086931b5876b83
Possible bottom
Nfa
post-image
#SNDK
SanDisk (SNDK) has just delivered a powerful breakout, closing the latest U.S. session at 1,739.88, up approximately 11.9% in a single day. That means the stock added nearly 185 points from the previous close of 1,555. The session range was 1,582–1,740, and price finished almost exactly at the high, while trading volume was around twice the normal level. This combination of price expansion, volume and a close near the high makes the breakout technically significant.
The bigger picture is even more interesting. SNDK had fallen from its June all-time high near 2,354 and eventually found a
post-image
SNDK+11.88%
MU+5.89%
A few days ago, I was still calculating whether I had enough money for instant noodles this month. This morning, I was already wondering whether to add sausage. All I can say is, $PENDLE really knows how to treat people. A few days ago, I took a look before bed. It had been moving sideways at the bottom for so long, with volume continuously shrinking and going nowhere. Based on experience, a setup like this is building strength; only a breakdown counts as admitting defeat, and staying flat without moving before a breakdown is the best move. And what happened? It really got back up on its own.
post-image
PENDLE+1.10%
ZEC+2.41%
ETH+0.15%
No trades, no analysis, just sheer luck—this result is embarrassing to talk about. When 🤦 was showing green across the screen, I suddenly remembered I still had a short position open. I checked it, and would you look at that: +164.55% secured.
It wasn't sheer luck, really—I just got fortunate and happened to enter a short at 104.51. At the time, the resistance above $SOL was obvious. Every time it pushed toward a key level, it pulled back, and volume couldn't keep up. The move looked too much like a bull trap, so I decided to set up a short. Now that 102.67 has broken down directly, the prof
post-image
SOL+1.18%
BTC+0.44%
LAB+5.06%
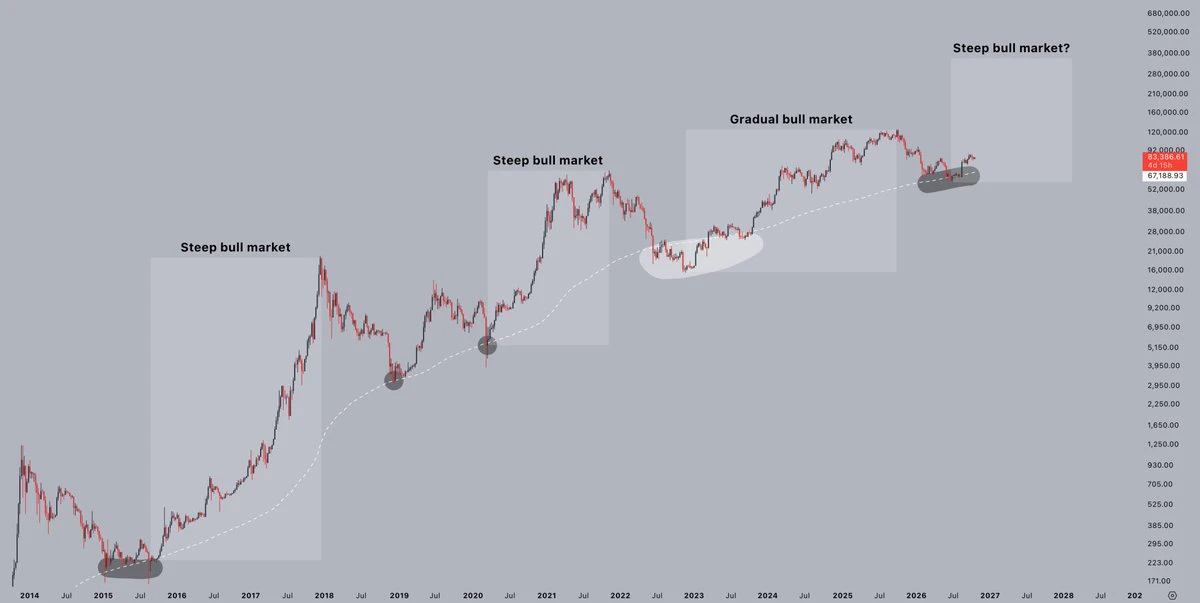
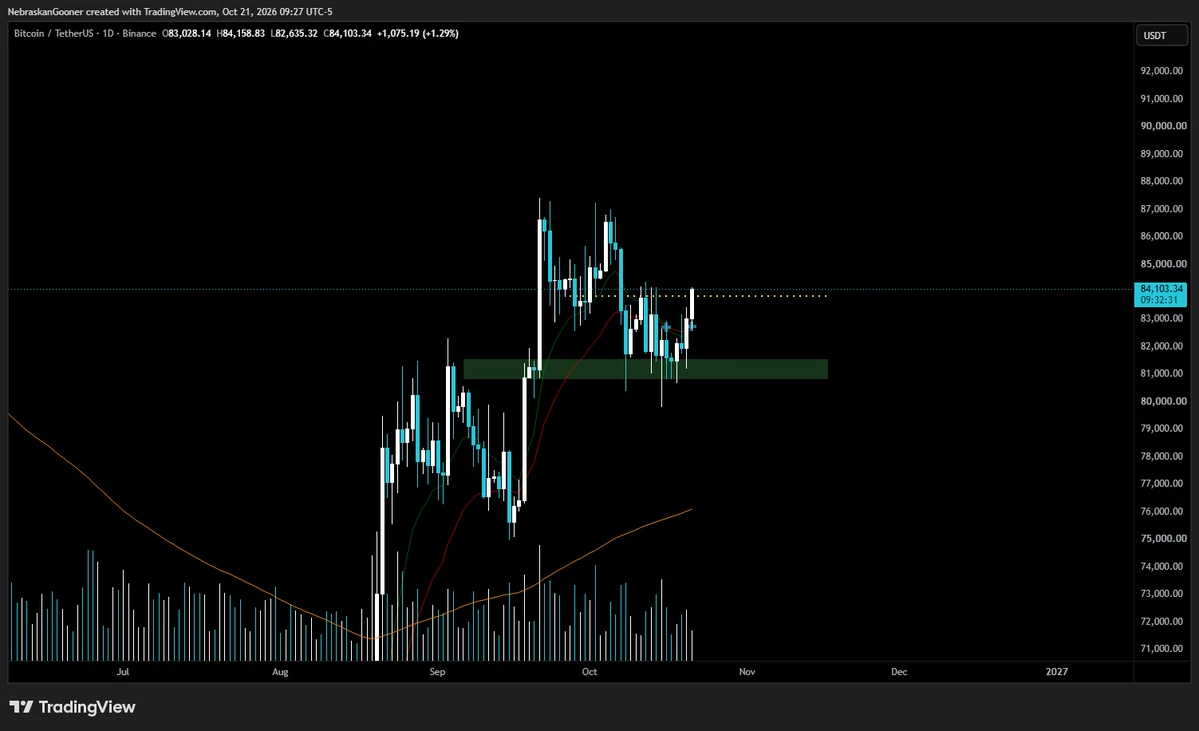
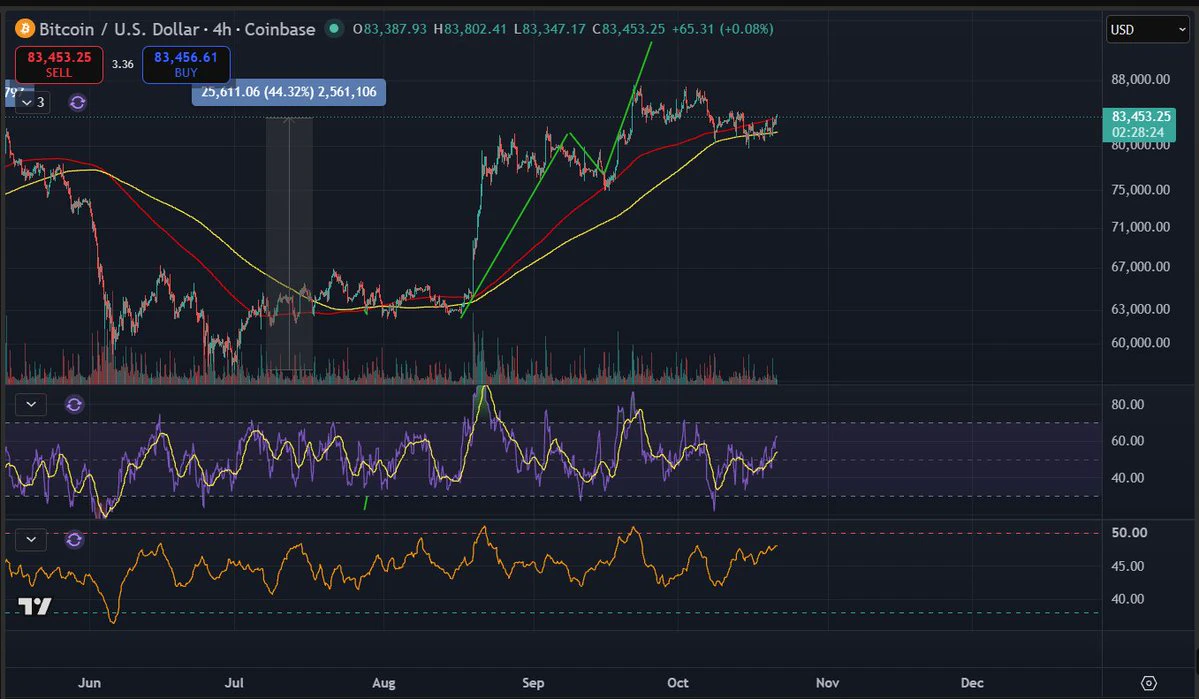
BITCOIN: LIQUIDITY SWEEP OR BREAKOUT?
BTC is testing the $82K area, and this is where things get interesting.
The push above the previous highs could be a classic liquidity sweep.
Bitcoin takes the highs → late buyers enter → liquidity builds → price potentially reverses.
I’m not trying to catch the exact top or bottom. I’m already heavily positioned and have taken significant profits from this move.
Now I’m watching the reaction.
📉 IF BTC PULLS BACK
First level: $76K
Deeper demand: $70K–$73K
A correction into these zones would still be compatible with the larger bullish trend.
The market cou
post-image
BTC+0.28%
Load More

Join 40 M users in our growing community

⚡️ Join 40 M users in the crypto craze discussion

💬 Engage with your favorite top creators

👍 See what interests you

View More