Share your thoughts
placeholder
Article
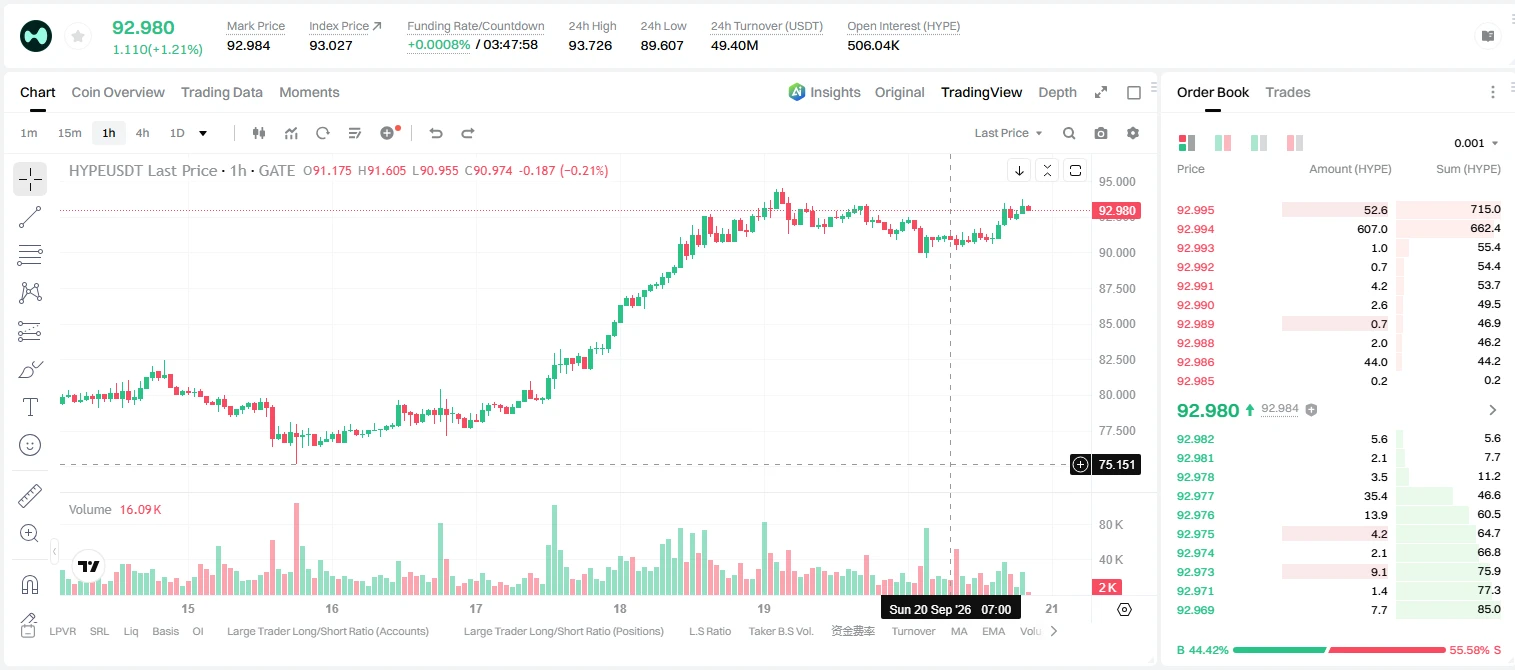
Insiders are watching $HYPE /USDT like a hawk right now.

$HYPE /USDT - LONG

Trade Plan:
Entry: 80.069 – 80.673
SL: 76.600
TP1: 83.199
TP2: 85.085
TP3: 87.914

Why this setup?
Why now? The daily trend is bullish, giving the 1h price of 80.371 a clear upward backdrop. The 15m RSI sits at 37.31, showing the asset is not overbought and has room to run before exhaustion. The 1h ATR of 1.208753 tells us volatility is active enough to push toward the first target of 83.199 and the second target of 85.085. The entry zone between 80.069 and 80.673 offers a defined risk window, and the invalidation
HYPE-3.92%
Yea this is bad
Really bad
post-image
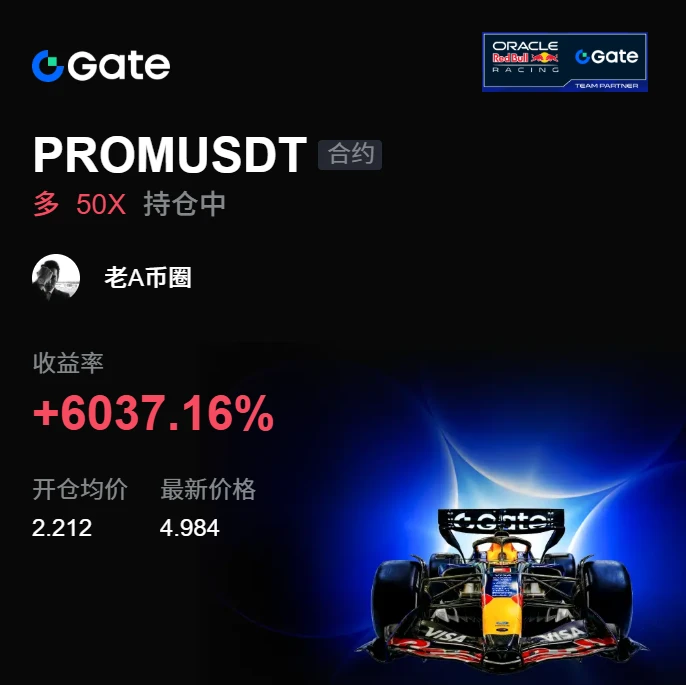
I had just switched the software to the background when it suddenly plunged—are you playing hide-and-seek with me? The last time I checked a few days ago, $CYS was at 0.4520, facing heavy resistance above, with clearly insufficient buying support.

My message at the time was simple: bullish, but the rebound was weak—don't become exit liquidity. Those who listened should understand.

Now at 0.1399, with +1358.25% secured, getting the timing right is really that simple. Time to enjoy a good meal.

Take 70% off the table first, and move the protective stop on the remaining 30% to the entry pri
post-image
CYS-1.83%
XRP-2.78%
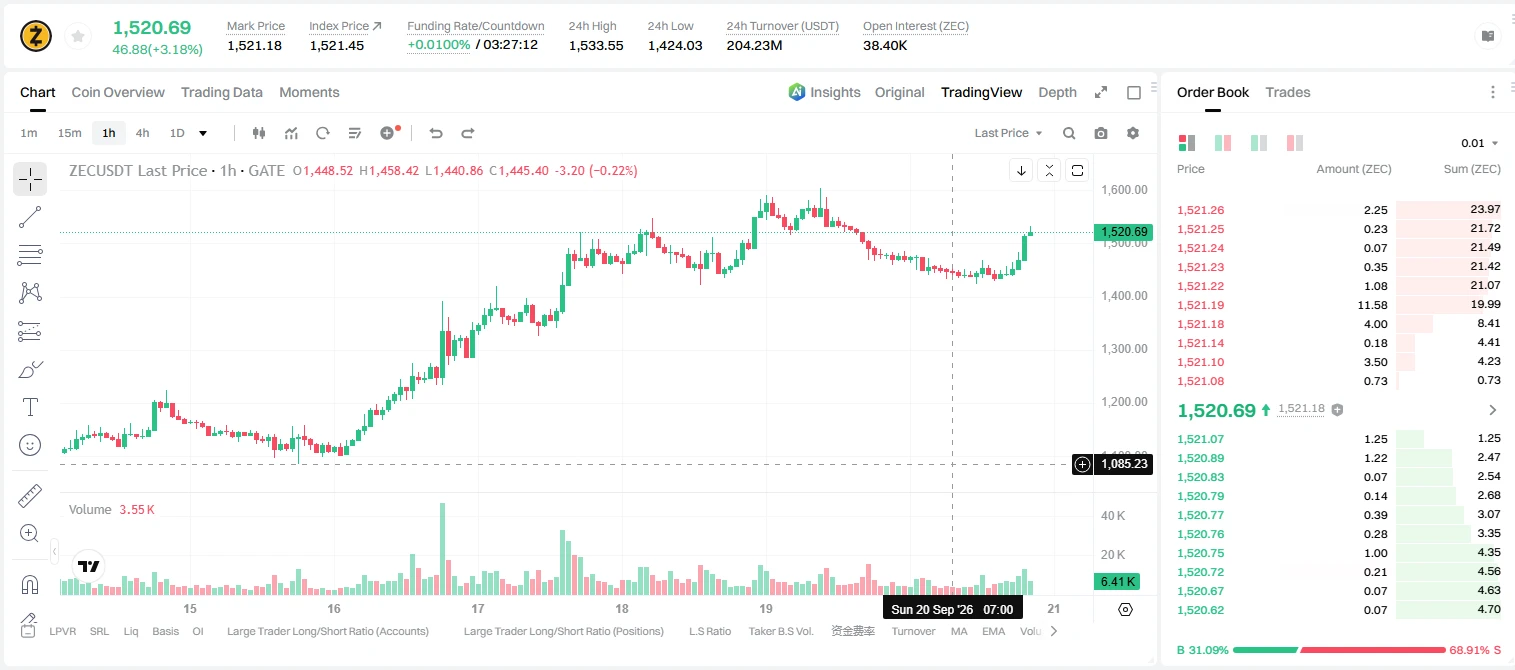
ZEC-10.57%
Gate Enters the CEX Top 4! How Much Weight Does Its 60 Million Users Carry?
If an exchange surpasses 60 million users and enters the mainstream CEX Top 4, how would you view it?
I believe this at least shows that Gate has gradually grown from a simple trading platform into an important asset and trading gateway for crypto users worldwide.
For CEXs, user scale is extremely important. The more users there are, the richer the trading demand, and the easier it is for product iteration to create a positive feedback loop. Of course, user numbers are not the only metric, but they can reflect a platfo
MEME-1.92%
RWA-1.86%
  • 39
- CPI comes in soft
- Rate hike chances drop
- Small relief rally on $BTC
- Bulls get cocky (again)
- bulltrap.exe
- FOMC, 25bps rate hike
- Back to channel lows
This is the best hopium I can offer at this time
Please enjoy responsibly
post-image
BTC-1.37%
Smart money is already short SYMBOL and you are still waiting for a top.

$LTC /USDT - SHORT

Trade Plan:
Entry: 52.15 – 52.43
SL: 53.68
TP1: 51.25
TP2: 50.56
TP3: 49.52

Why this setup?
Why now? The daily trend is range bound, which often ends with a decisive break, and the 1h ATR of 0.577723 shows enough volatility to fuel a sharp move. The 15m RSI at 47.8 is still neutral, meaning SYMBOL has not yet exhausted bearish momentum. The entry zone between 52.15 and 52.43 aligns with the 1h price of 52.29, giving a precise level to initiate the short. TP1 at 51.25 and TP2 at 50.56 define the fi
LTC-0.81%
JUST IN: US Treasury buyback size undershot expectations, but Bessent downplays market angst, calling the Treasury market “in very good shape.” Yield moves keep energy-price correlations in focus. $USDT, $BTC (if relevant)
post-image
BTC-1.37%
#美国8月PPI录得5.4%高于预期
The Producer Price Index (PPI), showing a 5.4% year-over-year increase, is certainly higher than market expectations. This reinforces the notion that inflationary pressures are persistent, particularly at a time when employment remains strong. The key tension now lies in whether the Consumer Price Index (CPI) will confirm this trend or show signs of cooling.
Here is my view on the risk ranking across asset classes:
US Equities usually react first, as investors immediately price in Fed policy expectations.
A higher CPI could reignite fears of interest rate hikes and put pre
NAS100-0.12%
BTC-1.37%
XAUUSD+0.03%
XAUAUD-0.01%
I wasn’t watching the market or using my brain—it was jumping on its own, as if working overtime for me.
A few days ago before bed, I took a look at $AKE . The rebound was weak, every push upward fell just short, and volume didn’t follow. This structure clearly showed that no one was taking it higher, so I judged it to be a short-term bullish opportunity.
I placed the order at 0.0101698, and it’s now at 0.0152328, +1215.74%. Those who got on board should be waking up laughing.
The profit is slim, but it grew on its own—I didn’t touch it at all.
A reminder on position management: close 70% first
post-image
AKE-1.72%
ADA-1.71%
SOL-1.60%
Yesterday’s trend forecast played out perfectly, so how will the market move today? Yesterday’s trend first tested the daily Bollinger middle band, then came under pressure and continued downward. After a rapid overnight decline, it entered a slow consolidation, in line with expectations. Shorts taken in the early hours and in the morning captured 680 and 1700 points, respectively, followed by a 600-point long after the decline reached the daily Bollinger lower band. That totaled 2980 points. We are currently on a 22-win streak. More excitement to come……
From the chart, after narrowing, the da
post-image
ETH-0.21%
BTC-1.37%
Nobody is talking about this quiet setup for SYMBOL yet.

$PONS /USDT - SHORT

Trade Plan:
Entry: N/A – N/A
SL: N/A
TP1: N/A
TP2: N/A
TP3: N/A

Why this setup?
Why now? The daily trend is a range, but the 15m RSI at 38.25 shows the short-term momentum is finally leaning bearish enough to justify a short position. The 1h ATR is not available, so the trade relies on the 4h trend and the precise entry reference of 0.5748 to define the exact price where the position activates. The setup is armed at this level because the 4h bias confirms the direction, but the entry at 0.5748 is the only concre
PONS-9.84%
I was just about to go to the forum and cuss people out, but then I saw my balance and thought, never mind—the market is always right.

With the whole screen glowing green, $XRP clearly lacked enough support at the highs, and every rebound was a bull trap. At the time, I was practically ready to paste the words “resistance above” right in everyone’s face. Friends who followed me into a short at 1.3836 should all be laughing in their sleep by now.

The current quote is 1.3493, with +230.44% already secured. Take 80% off the table first, move the stop-loss on the remaining 20% to around the e
post-image
XRP-2.78%
ADA-1.71%
SOL-1.60%
$1000 to $100,000 Crypto Trade Challenge Today
live-cover
LIVE473
This was purely the market fat-fingering it, picking the wrong direction and conveniently handing me a hot meal.
While everyone else was running, $PIPPIN was still stubbornly forcing its way upward. Being able to pull it up despite such heavy sell pressure looked obviously fake. The bull-trap vibes were too strong, so I went short at 0.01950 and waited for the show to end. Looking at it now, the price has been pressed down to 0.01773, with 176.7% secured. Staying up for this was worth it.
I’ve taken 80% off the table and set protection for the remaining 20%, letting it decide how much farther
post-image
PIPPIN-4.08%
ZEC-10.57%
DOGE-2.28%
I minimized the app to reply to a message, and when I came back, it had already finished the job. During the repeated intraday swings, I watched for a long time and found that there were no buyers on the rebounds—the selling pressure was strong, and the funds had no intention of pushing it upward at all. When I checked the chart right after lunch, I came up with a short idea: entered at 1.3889, and it has now dropped to 0.1394, +1771.22%—that says it all. Feels great, brothers. This is exactly how you should hold a short position. In terms of execution, take 70% off first, set a protective lev
post-image
LAB-5.03%
ZEC-10.57%
solana:HcRLc9VDgjLeK154xDawfb1dmVJ98DoSqcwTHGqiDeJR really nice bullish wedge forming here
post-image
SOL-1.66%
SNDK Current Market Analysis: After a rally on the daily timeframe, the price has entered a correction phase and remains firmly above the middle Bollinger Band, so the broader bullish structure has not been completely broken. However, short-term upward momentum has weakened, and the market has entered a high-level correction phase.

Switching to the 4-hour timeframe, the price surged before pulling back, broke below the middle Bollinger Band, and continued moving lower. The Bollinger Bands are opening downward, highs are continuously moving lower, bearish momentum continues to be released, an
post-image
SNDK-4.22%
Don’t Panic Just Yet
U.S. PPI rose 5.4% year-on-year in August, marking a clear acceleration and exceeding expectations of 5.3%. The market’s first reaction was naturally: Inflation is picking up again—will the Federal Reserve continue to turn more “hawkish”?
But a calm breakdown of the data shows that the story is not so simple. Prices of final-demand goods rose 1.1% in August, with energy prices a major contributor, including a 24.1% surge in diesel prices; service prices rose just 0.1%.
In other words, a considerable portion of this PPI acceleration came from an energy shock, rather than an
  • 26
🚨 CRUDE OIL (WTI) BREAKS $100 Sharp Vertical Breakout 🛢️🚀
📊 $CL /USDT
📈 Direction: LONG
⚡ Leverage: 5x
🎯 Entry Zone: 97.50 – 99.50
🎯 Take Profit Targets:
TP1: 100.93 +18%
TP2: 103.00 +44%
TP3: 106.00 +76%
🛑 Stop Loss: 94.50
$CL ‌#GateTop4MainstreamCEX
post-image
CL+5.70%
  • 12
  • 2
Load More

Join 40 M users in our growing community

⚡️ Join 40 M users in the crypto craze discussion

💬 Engage with your favorite top creators

👍 See what interests you