Square
Following
Hot
News
Notifications
Profile
Share your thoughts
placeholder
Article
This month was all for nothing! A big rally is imminent—go all in!
post-image
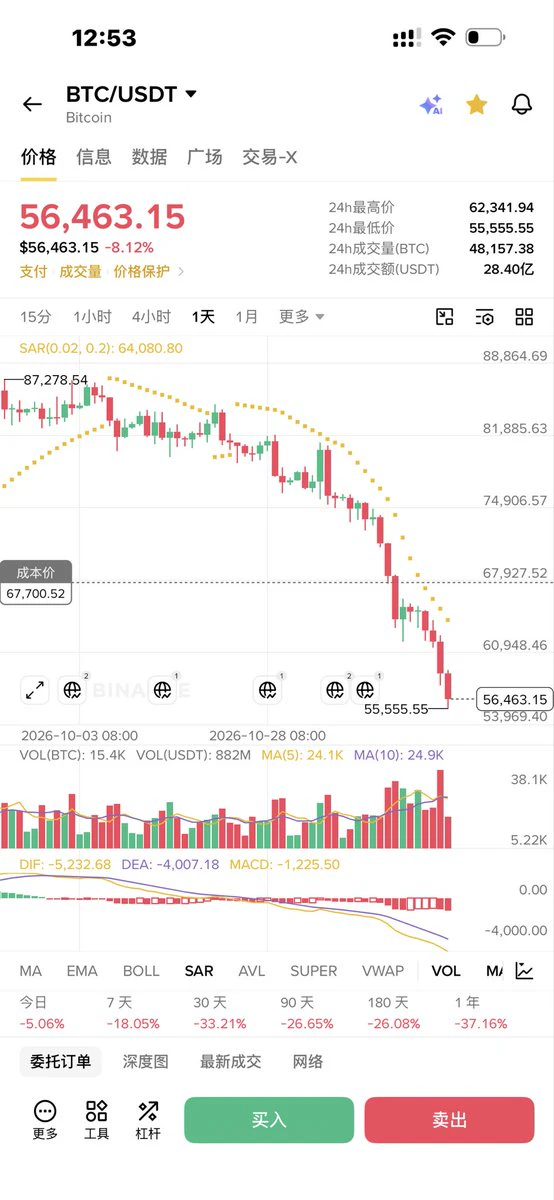
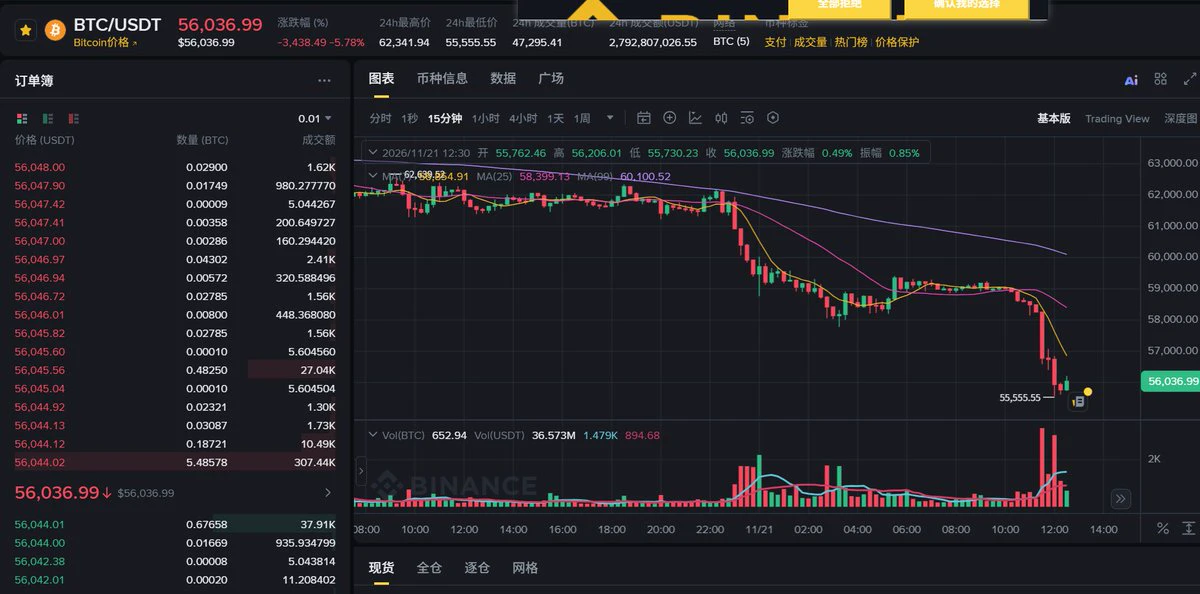
55555.55
Is this some kind of sick joke?
This manipulated market
post-image
Trenches
FIONA
F
bade
b
FIONA
B34n...pump
Market Cap
$.
Change
.
24h Vol
$.
Holders
.
PIEVERSE
P
bade
b
PIEVERSE
0x0e...25a9
Market Cap
$.
Change
.
24h Vol
$.
Holders
.
mihao
m
bade
b
mihao
4Cxj...pump
Market Cap
$.
Change
.
24h Vol
$.
Holders
.
PROS
P
bade
b
PROS
0x8b...9832
Market Cap
$.
Change
.
24h Vol
$.
Holders
.
CLAUDIA
C
bade
b
CLAUDIA
2j5S...W2ZM
Market Cap
$.
Change
.
24h Vol
$.
Holders
.
[New Streamer] Market Prediction
live-cover
LIVE1,961
BTC-0.67%
Elon knows how to name his rock-its
post-image
#GateLeadsRWAPerpExpansion Gate Leads RWA Perpetual Expansion: Bringing Traditional Assets Closer to Crypto Trading 🌍🚀

The financial landscape is evolving rapidly, and Real-World Assets (RWA) are becoming one of the most important developments in the digital asset industry. Gate is strengthening its position in this growing sector by expanding RWA perpetual trading opportunities and connecting traditional financial markets with the crypto ecosystem.

🔹 What Is RWA Perpetual Trading?

Real-World Assets (RWA) refer to financial and physical assets that are represented digitally or linked to
post-image
RWA-0.39%
XAU+0.38%
XAUUSD-2.40%
BTC-0.67%
ETH-1.26%
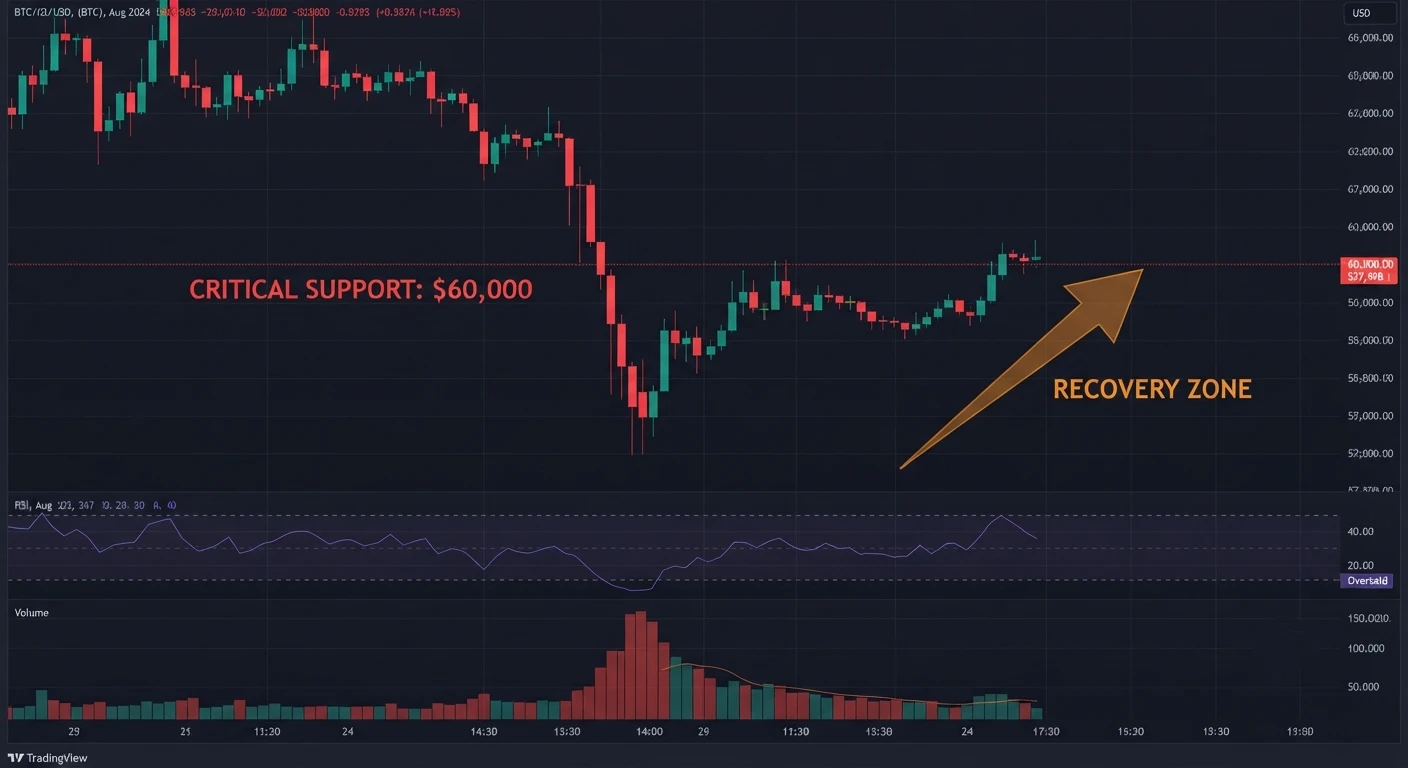
Yes, Bitcoin can recover, though whether this leads to an immediate bounce or a prolonged consolidation depends on several technical and macroeconomic factors currently driving the sell-off.

Following $BTC drop to around $57,950–$58,500 (its lowest level since mid-year), the market is caught between deeply oversold technical indicators and heavy macro headwinds.

Factors Supporting a Recovery
- Deeply Oversold Conditions: On the daily chart, Bitcoin's Relative Strength Index (RSI) has dropped to around 20. Historically, an RSI this low signals extreme selling exhaustion and frequently precede
post-image
BTC-0.67%
  • 1
btc market updates
live-cover
LIVE2,372
SOL-0.77%
BTC-0.67%
ETH-1.26%
USDC+0.01%
XRP-1.15%
Pin this! Let’s look back in 10 years! I believe in myself!
I just checked the price from when I first got into crypto as a college freshman 😂—after five years of ups and downs, it's back where it started.
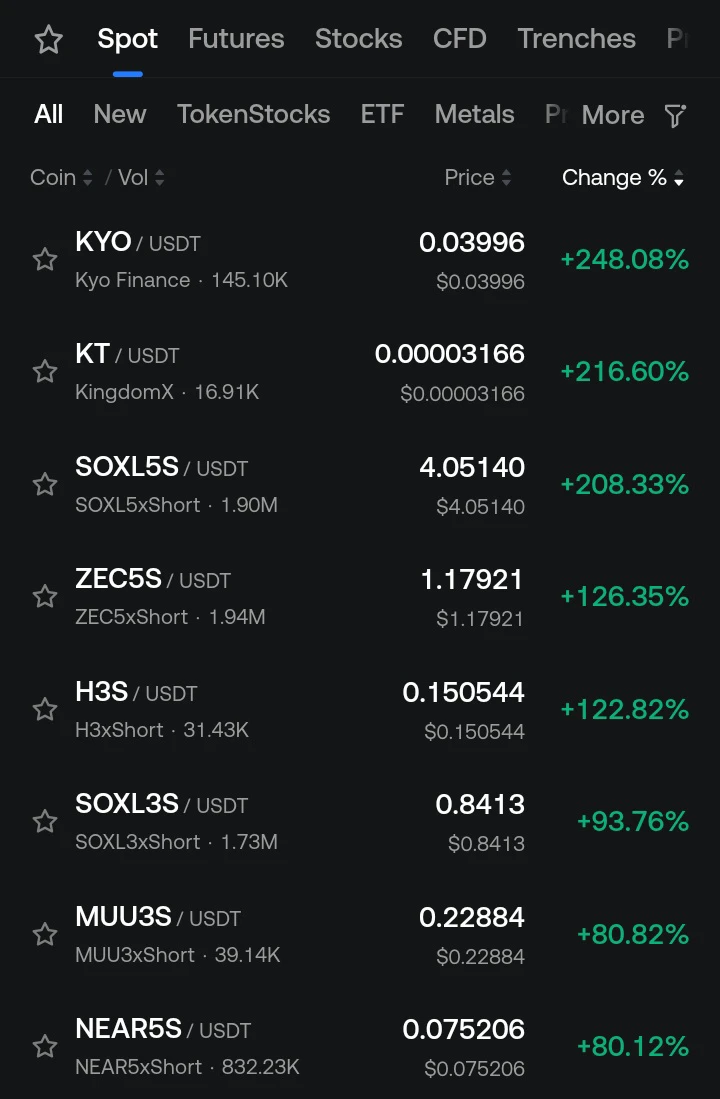
🚀 Spot Market Explodes! Massive Green Moves Across the Board!

The market is showing some serious action today! Several assets are posting triple-digit gains, and $KYO is leading the leaderboard with an incredible move. 👀🔥

📈 Top Spot Gainers:

🥇 $KYO — $0.03996 (+248.08%)
🥈 $KT — $0.00003166 (+216.60%)
🥉 $SOXL — $4.05140 (+208.33%)
🔥 $ZEC — $1.17921 (+126.35%)
⚡ $H3S — $0.150544 (+122.82%)
📊 $SOXL3S — $0.8413 (+93.76%)
💎 $MUU3S — $0.22884 (+80.82%)
🚀 $NEAR5S — $0.075206 (+80.12%)

My take: These are huge percentage moves, but I wouldn't chase every green candle. After such sharp ra
post-image
KYO+0.06%
KT+0.00%
SOXL-1.16%
ZEC+1.16%
H3S+10.36%
  • 1
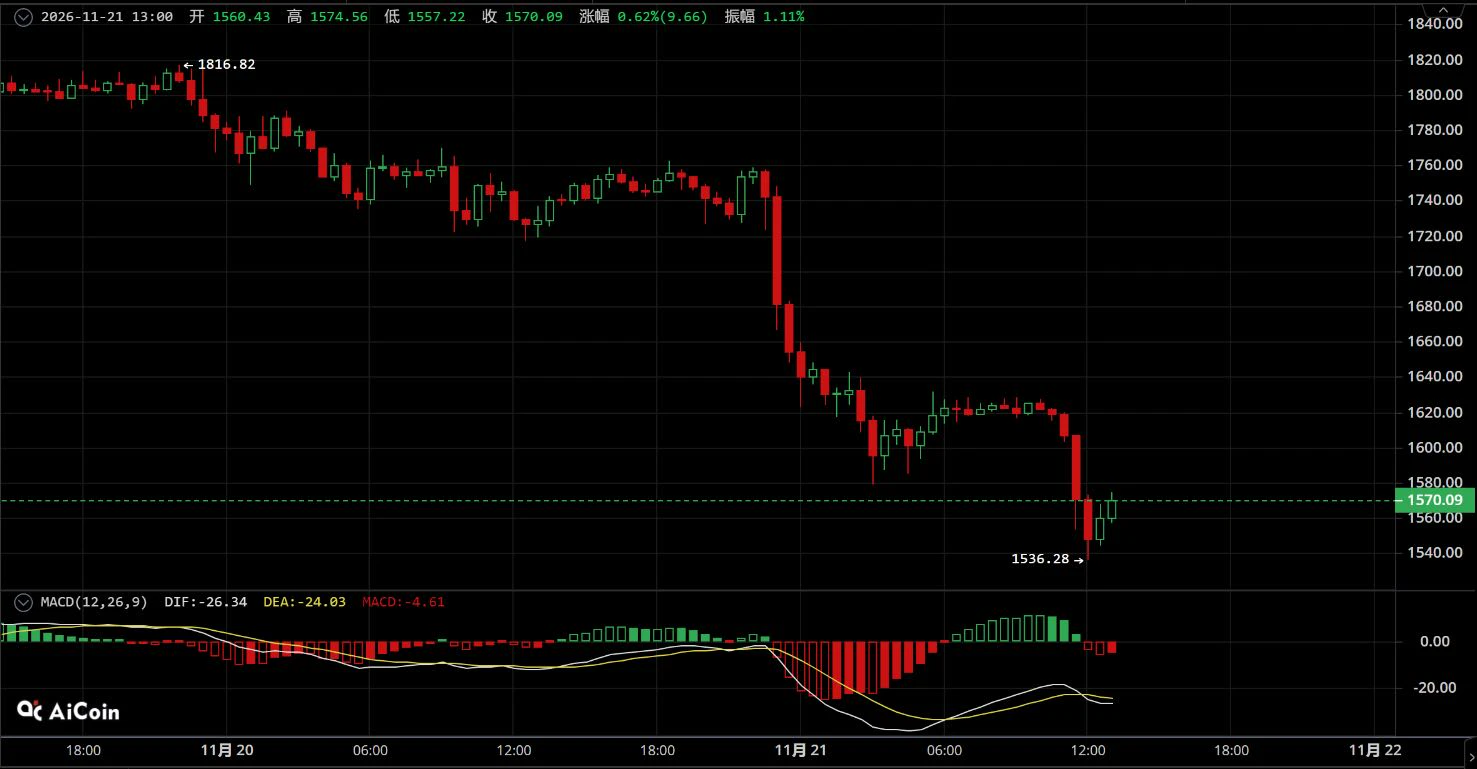
A-Longbit | Nov 21 $ETH Broke down in tandem with the market, hitting a new short-term low; weak rebound, short on rallies

【Trading Plan】
Short entry range: Set up positions on a rebound to 1605-1630
Stop loss: Above 1655
Take-profit targets: First target 1550-1535, second target 1515-1495

【Core Rationale】
On the 30-minute timeframe, ETH broke down and plunged in sync with the broader market, breaking through multiple support levels in succession and hitting a new short-term low. As a major altcoin following the decline, ETH has greater downside volatility than BTC, making the bearish trend
post-image
ETH-1.26%
BTC-0.67%
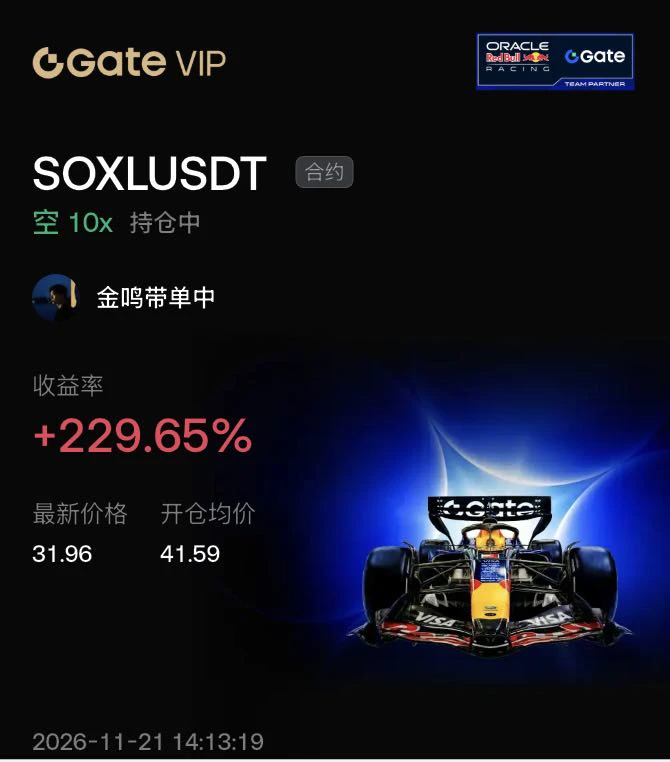
The most unusual thing: over the past month, the fund saw net inflows of about $6 billion, more than 30% of its assets, yet its price fell 26.5%.

On November 5, it fell 39% in one day$SOXL . Buyers stepped in the next day, with net inflows of $920 million; on November 6, another $2.6 billion came in, and the price bounced from 40.87 to 45.97.

In other words, every time it falls, a new wave of buyers rushes in. The more buyers step in, the harder it surges on the rebound.

It hit an intraday low of 29.82 last night and had already recovered to above 33 after hours. This shows dip buyers are b
post-image
SOXL-1.16%
ETH-1.23%
BTC-0.65%
  • 1
What is this supposed to do?
Is this a suicide mission?
Hurry up and go to the Western Heaven to fetch Old Huang!
post-image
Bottom Signal Checklist
Comprehensive Overview of Crypto Market Bottom Signals (November 21)
Signals are appearing in clusters—confirmation has yet to arrive
I. Five Types of Bottom Signals Already Seen (Early Indicators)

1. Sentiment at rock bottom: The Fear and Greed Index has fallen to 9–12, its lowest level since the Terra collapse in mid-2022. Extreme fear itself is a contrarian indicator.

2. Accelerated deleveraging: In the past 24 hours, $1.89B in positions were liquidated across the market, affecting approximately 292k traders; long positions accounted for as much as 91%. Open intere
LUNA-2.88%
BTC-0.67%
IBIT-5.97%
NAS100-0.07%
  • 1
Heard everyone's out of money?
The apps below will pay you just for opening your mouth and shaking your head! Go on, no need to thank me 😂
post-image
Took a beating today gonna sleep this one off 😴
post-image
It is never a bad idea to grab $ZEN at 3$ zones
post-image
ZEN+0.00%
Some people say a 20% drop isn’t the same as another 20% drop; it depends on how it happens.
$GWEI fell from 0.0138 to 0.0110, down 19.41% in 24 hours, with 5.8M in trading volume. Compare that with another common pattern. In terms of price action, $GWEI is being pushed steadily lower, while the other type moves sideways after a spike; one is like easing off the gas on a downhill slope, the other like braking on a flat road. As for volume, 5.8M isn’t small, which means people are changing hands—it’s not a slow decline with no interest. The question is whether that’s panic-driven turnover or b
GWEI+0.81%
  • 1
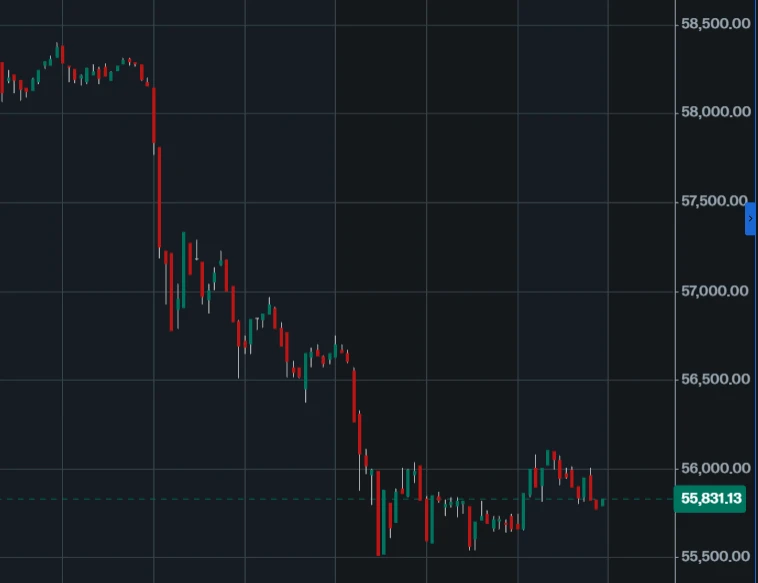
🚨 Bitcoin's price crashes below $56,000 📉 In 30 days, it has fallen by more than 30%.
Bitcoin had not fallen this low since September 2024.
post-image
BTC-0.67%
Many people rush to buy the dip as soon as RSI falls below 20, but overlook that the moving average structure has yet to flatten out—oversold is a necessary condition, not an entry signal.

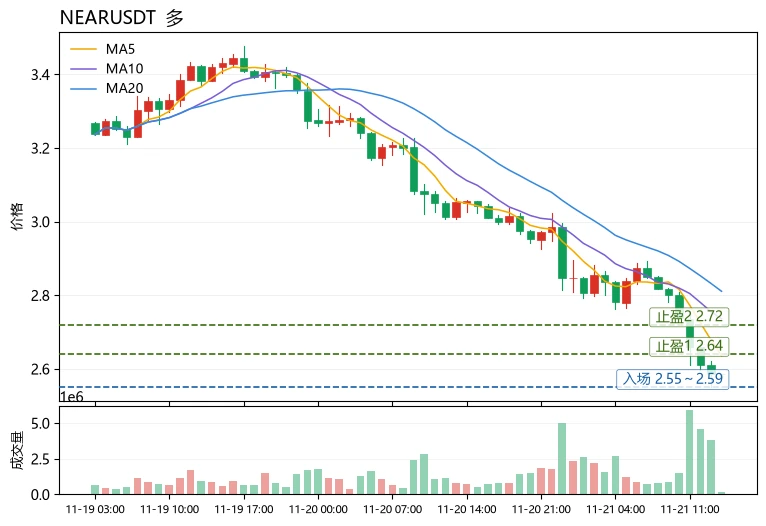
$NEAR The current price is at just such a level: the price is 2.586, down 14.96% over 24h; MA5=2.6358 remains below MA20=2.81095, with the short- and medium-term moving averages still in a bearish alignment; the MACD histogram at -0.01597 remains negative, and bearish momentum has yet to ease; RSI=20.6 has entered deeply oversold territory, with the Bollinger lower band at 2.57201 close at hand and the pric
post-image
ADA-1.48%
Load More

Join 40 M users in our growing community

⚡️ Join 40 M users in the crypto craze discussion

💬 Engage with your favorite top creators

👍 See what interests you

Trending Topics

BTCBreaksBelow60K

2.1M Views29K Discussing

BTC fell below $60,000 on November 20 for the first time since July, alongside a tech stock selloff and broader pressure on risk assets. Will $60K become resistance, or can BTC quickly reclaim it? What price or volume signals would convince you that selling pressure is easing?

GateDirectIPOPhase3ANTAllocates92100Shares

735.3K Views4.8K Discussing

NvidiaDropsNearly14Percent

308.8K Views7.5K Discussing

View More