Square
Following
Hot
News
Notifications
Profile
Share your thoughts
placeholder
Article
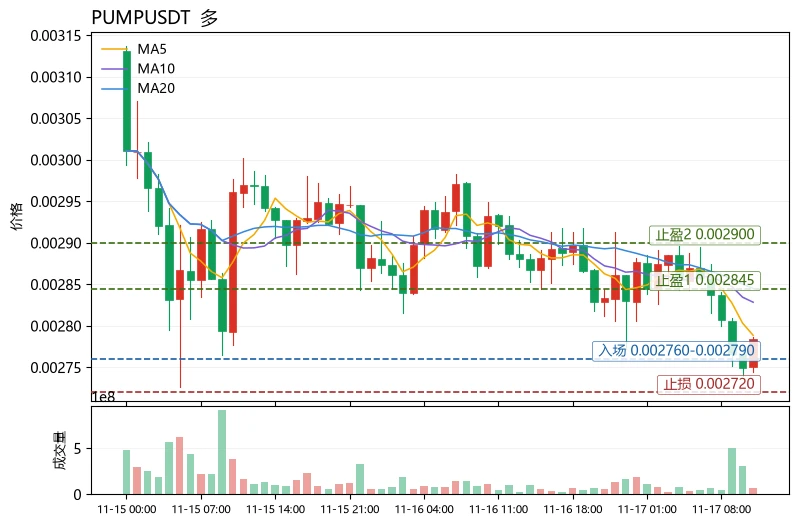
$PUMP Is this drop the bears pressing their advantage, or the bulls quietly preparing a defense? The answer leans toward the latter—extreme fear combined with a positive funding rate has pushed short positioning to a dangerous level, creating the conditions for a short-squeeze rebound in the near term.
$PUMP The current price is 0.002784, while MA5 at 0.0027886 remains below MA20 at 0.00284525, with the mid-term moving average resistance still intact; RSI at 39.7 is approaching oversold territory, and the MACD histogram at -7.119e-06 indicates bearish momentum, but it is already converging. P
post-image
PUMP-1.06%
BNB-0.76%
WLFI-0.16%
3847 → 3870, 8700 secured!
Nailed the entry near the lows, timed the morning move perfectly, and steadily hit the targets~$XAU ‌
XAU+0.38%
Trenches
BP
B
bade
b
BP
BPxx...jPCy
Market Cap
$.
Change
.
24h Vol
$.
Holders
.
BAWSAQ
B
bade
b
BAWSAQ
4La9...pump
Market Cap
$.
Change
.
24h Vol
$.
Holders
.
mihao
m
bade
b
mihao
4Cxj...pump
Market Cap
$.
Change
.
24h Vol
$.
Holders
.
Marvin
M
bade
b
Marvin
HkRQ...pump
Market Cap
$.
Change
.
24h Vol
$.
Holders
.
GTA6
G
bade
b
GTA6
4kjr...zDnz
Market Cap
$.
Change
.
24h Vol
$.
Holders
.
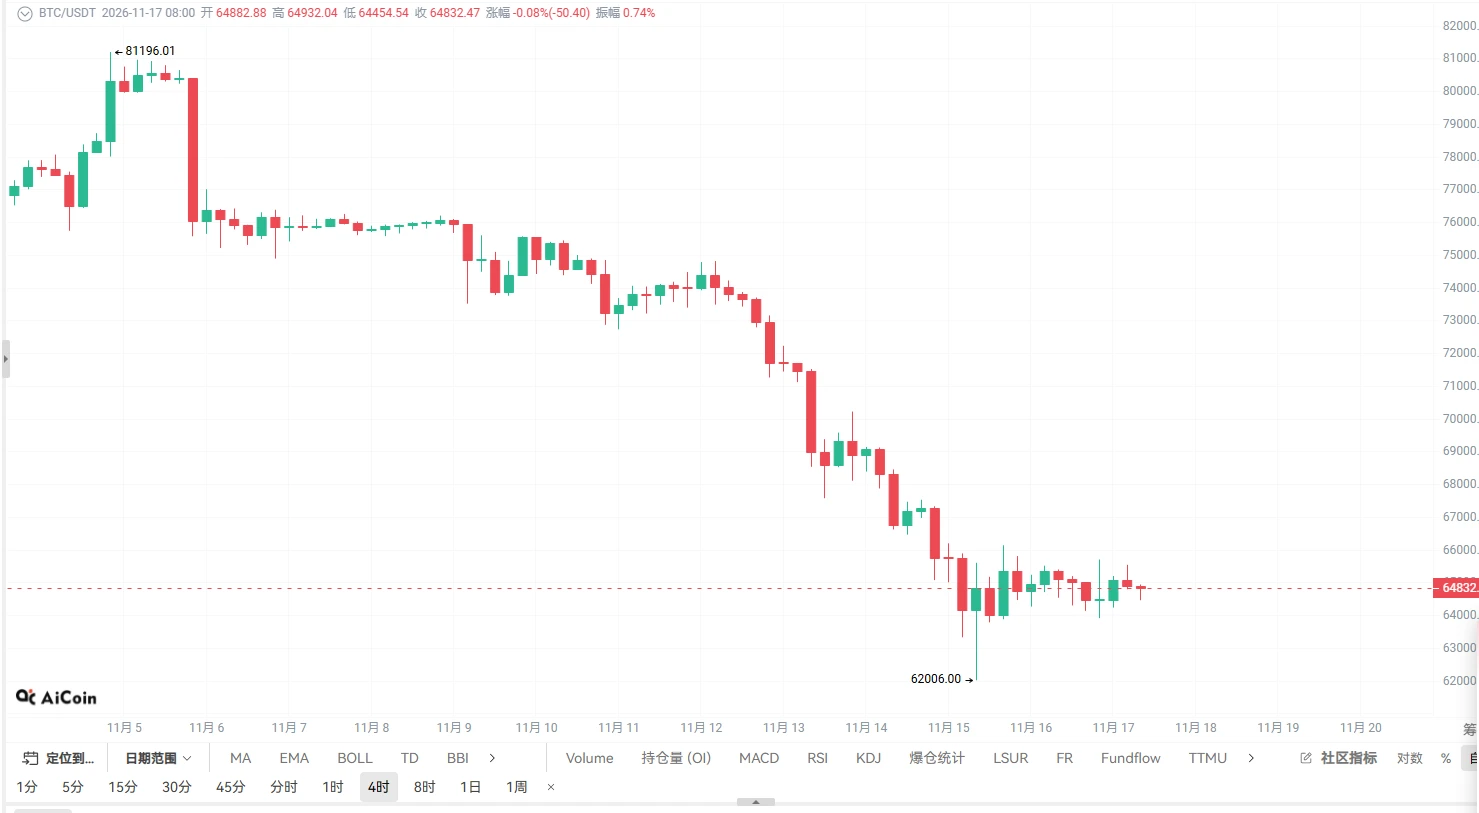
BTC consolidates and recovers at lows on November 17; rebound meets resistance, favor shorting with the trend
Today's strategy
Entry: Price rebounds to the 65,300–65,600 range
Stop-loss: 66,050
First target: 64,300–64,000
Second target: 63,500–63,200.
Key takeaway
According to reports from CLS and Reuters, Federal Reserve voting members have recently continued to signal a hawkish stance. The CME FedWatch tool shows that the probability of a December rate hike remains high, while the 10-year U.S. Treasury yield has held above 5%, with expectations of tighter liquidity continuing to weigh on ris
post-image
BTC-0.67%
  • 1
Has BTC breaks below support..is a bottom signal
live-cover
LIVE1,686
$NVDA The Q3 earnings report won’t be released until around 5:20 a.m. on the 18th, with a meeting at 6:00. Quite a few people will probably trade this today, betting on whether the stock will go up or down. We’ll know by tomorrow morning.
post-image
NVDA-4.11%
I'm a fan of Brandon Carlson and really enjoy watching him play. I hope the Trail Blazers play him more.
post-image
#NvidiaEarningsInFocus

Looking at the Monthly and Weekly charts, the structure is a clear macro distribution phase followed by a sharp structural breakdown. The all-time high sits at 243.37, and the price has sliced through major historical support zones (like the 200 and 209 levels) with heavy red candles. Dropping down to the Daily, we see a relentless downtrend from the 200+ region, culminating in a massive capitulation candle that found temporary footing at 148.80. Zooming into the 1-Hour chart, the micro-structure is currently in a tight, low-volatility consolidation box, hugging the bo
NVDA-4.11%
  • 3
  • 1
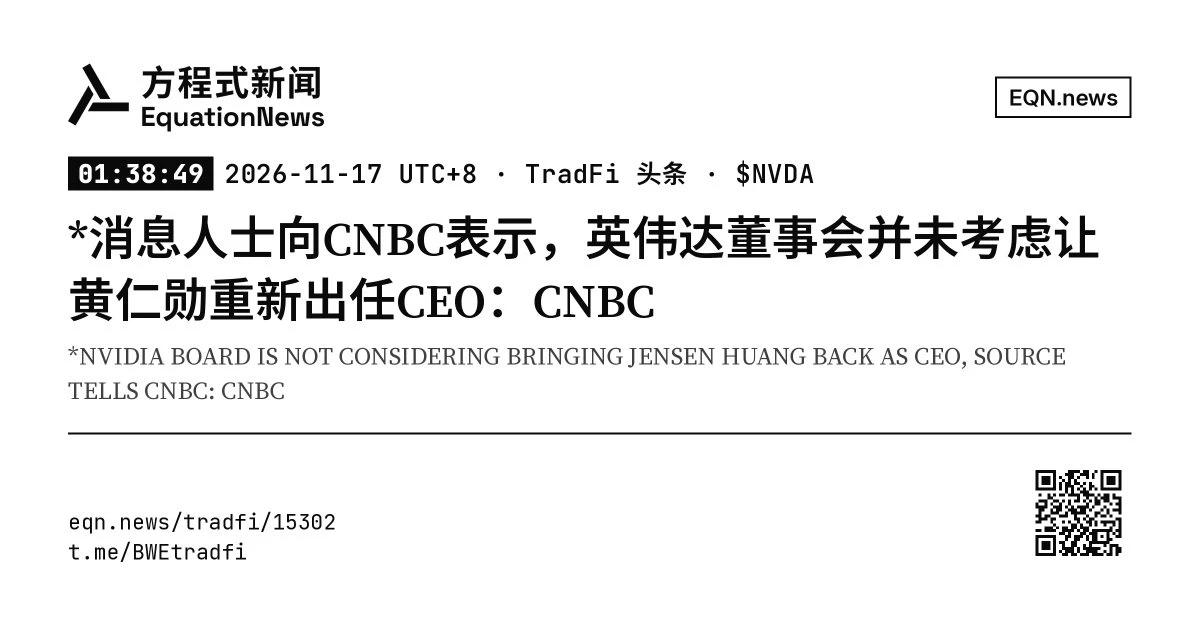
Elon Musk and Donald Trump both said they think Jensen Huang should return as CEO, but Nvidia’s board made clear it wouldn’t consider bringing him back. The two heavyweights were completely in agreement, but the board flat-out rejected the idea—and even added a smiley face.
post-image
NVDA-4.11%
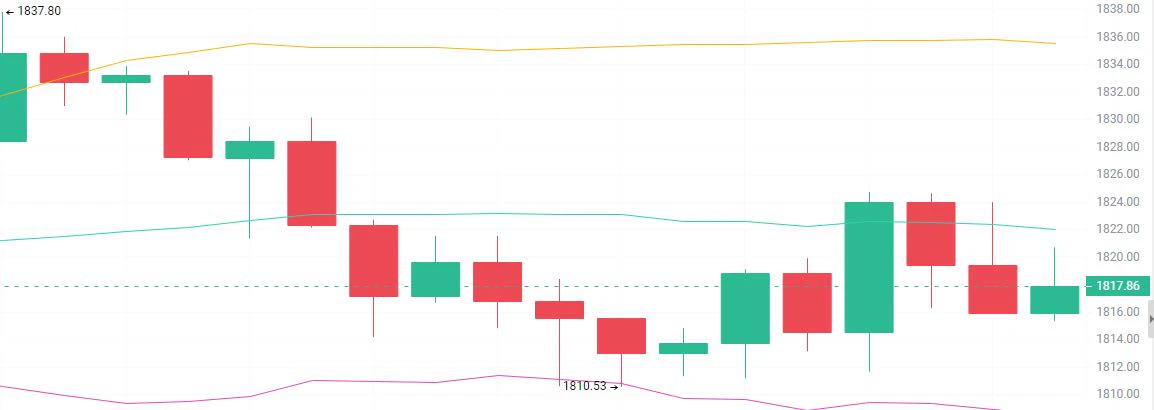
Today’s Morning ETH Outlook

Trade setup:
Short around 1820-1840
First target: 1800-1780
Second target: 1760-1740
Be sure to set a stop-loss

ETH is extremely weak, with no decent rebound and highs continuing to move lower. It is currently drifting down just below the middle band. The MACD has just formed a death cross below the zero line, and bearish momentum is slowly building. ETH tends to follow declines rather than rallies, making it prone to a catch-up drop if the broader market weakens. Strategy: Don’t wait for a deep rebound. If a slight bounce toward the middle band stalls and closes
post-image
BTC-0.65%
ETH-1.23%
BTC ETH market
live-cover
LIVE2,052
11.17 SOL Analysis

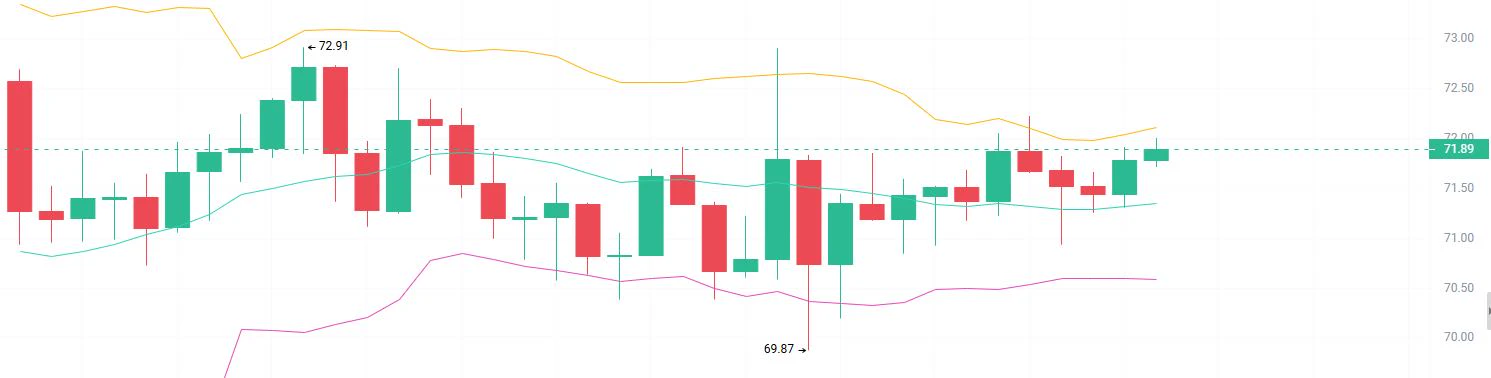
Analysis: Short on a rebound near 72.5-73.2, with a stop at 73.8, first target 71.0, and second target 70.0

On the 1H chart, the current price is 71.95. In terms of market structure, the rebound began at the low of 69.87, climbed to a swing high of 72.91, then pulled back. Price subsequently fluctuated repeatedly within the 71-72.5 range. Recent candles have alternated between bullish and bearish, with large bullish and bearish candles appearing frequently, indicating intense competition between buyers and sellers and an unclear short-term direction. Short-term bearish mom
post-image
SOL-0.77%
Dip-buyers, stay cautious! The U.S. Dollar Index has climbed to 103.486, a 19-month high!!!

The dollar is strengthening, and global risk appetite may contract further. Given today's declines in South Korea's KOSPI, SK hynix, and Samsung Electronics, what worries me more is that tech stocks and cryptocurrencies may face funding pressure at the same time.

For BTC, staging a sustained rebound in this environment will indeed be difficult.

So I still hold the same view: don't rush to buy the dip in spot markets, and don't rush to take a direction in futures just because of a single rebound candl
post-image
SOL-0.74%
SK Hynix+1.69%
BTC-0.67%
Solana morning outlook

Short
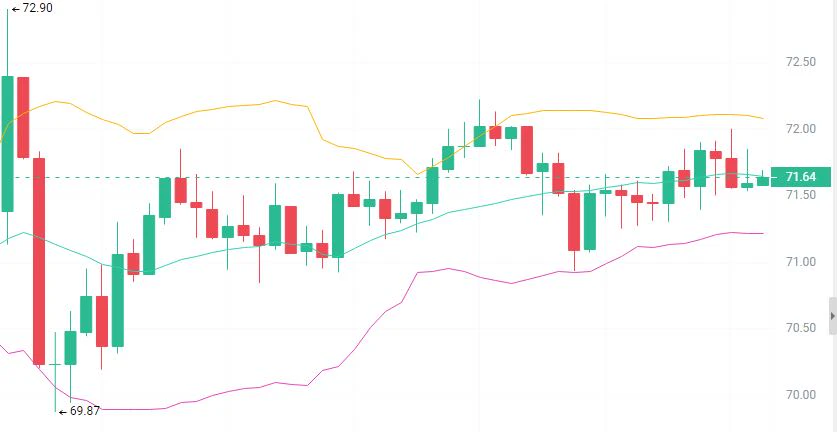
Entry range: 72.20 - 72.50 (Price rebounds to the Bollinger upper band and previous high resistance zone; enter after momentum stalls and a bearish candle forms)
Stop-loss: Above 72.90
Targets: 71.60 (middle band) → 71.20 (lower band)

Long
Entry range: 71.00 - 71.20 (Price retests the Bollinger lower band support zone; consider entering only after a clear signal that the decline has stopped and price has stabilized)
Stop-loss: Below 70.50 (A break below the previous low invalidates the long position)
Targets: 71.70 (middle band) → 72.20 (upper band)

Solana is cu
post-image
SOL-0.74%
$ICP vs $XRP 👀

XRP spent nearly four years inside a symmetrical wedge before its historic 2017 breakout, rallying from $0.0053 to $3.30.

Now ICP is showing an interesting long-term setup.

After almost five years in a falling wedge, ICP broke out in September 2026. Meanwhile, its monthly MACD has been printing green bars since March.

I'm not saying ICP will repeat XRP's performance, but could we see $100 $ICP in 2027?

That's roughly a $55.9B market cap.
ICP-1.14%
XRP-1.15%
#英伟达财报周来袭 #美股财报季 Wednesday’s Nvidia Earnings Focus: Without Jensen Huang, Who Can Tell the AI Story?

Nvidia will release its quarterly earnings after the market closes Tuesday local time (early Wednesday Beijing time), but this time, the numbers themselves have taken a back seat. Huang’s sudden departure has turned what was supposed to be a routine earnings call into one of Wall Street’s most closely watched moments in decades—the market really wants to know whether Nvidia can continue its grand AI narrative without him.
Nvidia’s third-quarter revenue is expected to reach $109 billion, with e
post-image
NVDA-4.11%
  • 1
An 81-point intraday gain and a 30-point pullback, all within just a few hours. Some say volume coming in like this means the big players are building positions, so just follow along—the story sounds convincing, but it doesn’t hold up to scrutiny.
24-hour trading volume was 537.9M. The price climbed from 0.0091 to 0.0197, then fell back to 0.0167. If this were one-way accumulation, they wouldn’t give nearly half the move back to the market. This looks more like players swapping hands at a poker table: some are buying, others are selling. The activity is real; the direction isn’t.
I’d rather th
  • 2
11.17 ETH Trading Setup Ideas
Market Analysis
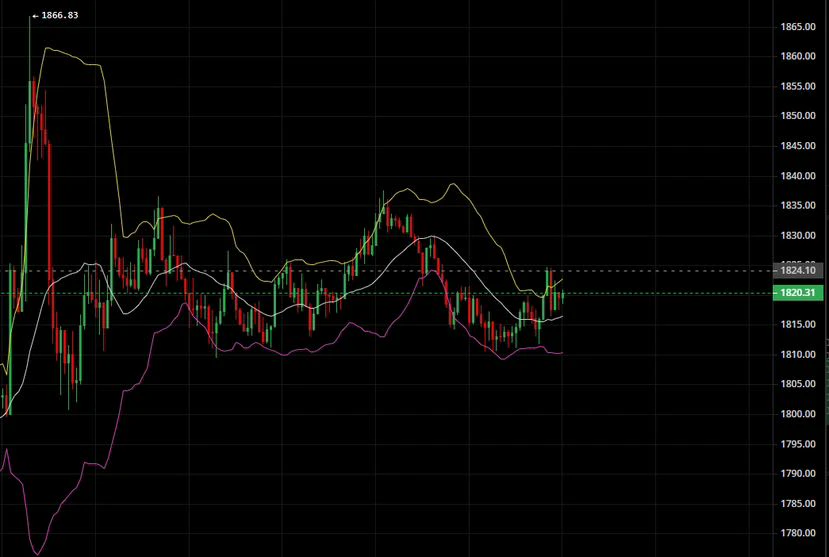
After surging to 1866.83, the price pulled back and found support around 1810, stabilizing there. The current price is 1820.31. The white line has flattened, while the purple line has stopped falling at a low level. After a short-term bottoming attempt, the market has entered a weak recovery bounce structure. Support near 1810 is holding for now. The key is whether it can hold on a retest before challenging resistance above 1830.
Entry (Buy the Pullback)
• Entry range: 1812–1817 support zone on a pullback
• Strategy: Buy only after the pullback sta
post-image
ETH-1.23%
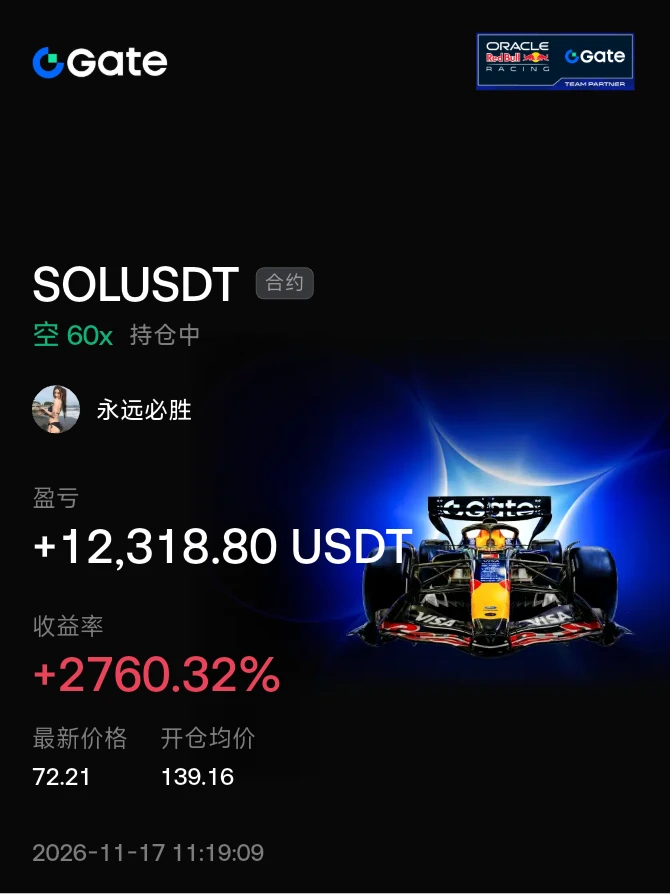
Bitcoin scored three straight wins across long and short trades in a single day, racking up nearly 3,000 points! Captured the full move by shorting near the highs during the day, then chased longs in the evening for another satisfying win!

Yesterday in review:
Shared a shorting strategy in the early session, then followed the trend to take profits on two short trades during the day (+306%, +194%).
As the market started to pick up in the evening, I decisively chased longs and scored a massive 318% gain!

Stay flexible in trading and follow the trend—that’s the way to go.$BTC $ETH #Gate直通IPO第三期
BTC-0.65%
ETH-1.23%
Yesterday I told everyone: if 64276 broke, watch 62003 first. Overnight, buyers stepped in at 63908; even with the Nasdaq down 2.49%, BTC didn't retest the weekend low, but still couldn't get past 66127. Today, keep trading the range with a bearish bias.

Let's review yesterday's call. Yesterday morning I said the short-term outlook remained weak: don't chase shorts at 64800 or buy this rebound; wait to short if a rebound stalls at 66127, or if it tests 68000 again and fails. Below, watch 64276 first, and if it breaks, prioritize 62003. I still stand by the bearish bias. As for the levels, 642
BTC-0.65%
ETH-1.23%
SOL-0.74%
Load More

Join 40 M users in our growing community

⚡️ Join 40 M users in the crypto craze discussion

💬 Engage with your favorite top creators

👍 See what interests you

Trending Topics

GateIPOAccessAnthropic

434.4K Views3.1K Discussing

Gate IPO Access Phase 3 features Anthropic (ANT), with USDT subscription interest starting from 100 USDT. Successful allocations will be delivered as real shares to Gate Stock Accounts. Indicative price: $70–$78/share Subscription: Nov 12–17 (UTC+8) Allocation is not guaranteed. Please manage risk accordingly.

Dr.HanOxfordUnionSpeech

328.3K Views1.7K Discussing

ANTPreMarketFuturesNowLive

358.5K Views3.6K Discussing

View More