Square
Following
Hot
News
Notifications
Profile
Share your thoughts
placeholder
Article
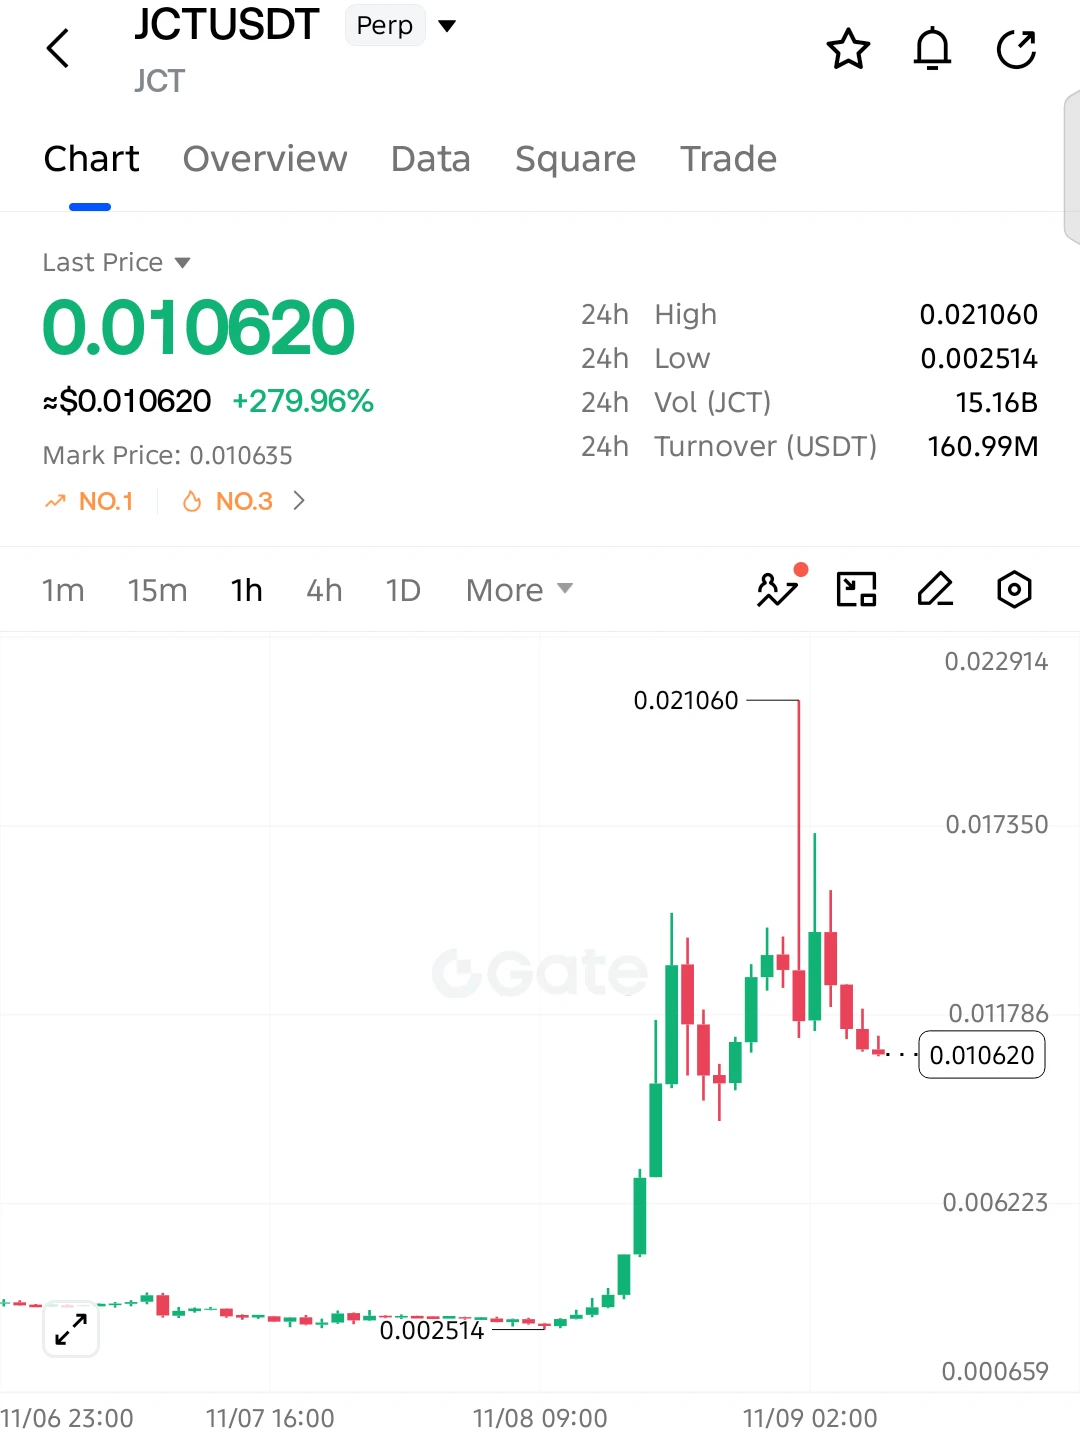
$JCT SHORT SETUP — 280% PUMP, NOW A MASSIVE REJECTION!

$JCT exploded nearly 280% in 24 hours, but the rally is losing momentum after a sharp rejection from 0.021060. Sellers are pushing price lower, raising the possibility of a deeper correction!

Entry: 0.010620
SL: 0.012200

TP1: 0.009000
TP2: 0.007800
TP3: 0.006223
Final Target: 0.005000

The massive rejection from 0.021060 has triggered aggressive profit-taking. Price is now forming lower highs, with buyers struggling to regain control. If selling pressure continues below 0.011786, $JCT could slide toward 0.009000 and potentially lower.

post-image
JCT-3.26%
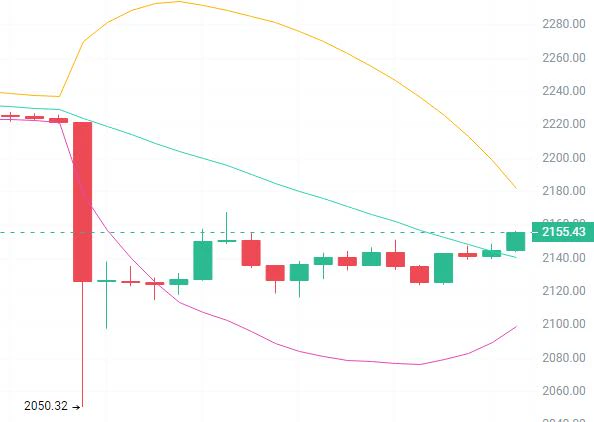
This morning’s ETH outlook

Trade:
Short around 2160-2180
First target: 2140-2120
Second target: 2100-2080
Keep your stop-loss in place

After its sharp drop, ETH is making a weak recovery, facing resistance at the middle band with heavy overhead supply from trapped holders. Although MACD has formed a weak golden cross, this is only an oversold rebound. Strategy-wise, do not chase the drop under any circumstances. Wait for a rebound to the upper band or near the previous high, then try a small short position if it stalls and closes lower. Targets are the lower band and previous low; set a firm
post-image
ETH-1.23%
Trenches
ZIG
Z
bade
b
ZIG
0x8c...1145
Market Cap
$.
Change
.
24h Vol
$.
Holders
.
BTC
B
bade
b
BTC
C5xp...pump
Market Cap
$.
Change
.
24h Vol
$.
Holders
.
STONK
S
bade
b
STONK
6GmA...UNgx
Market Cap
$.
Change
.
24h Vol
$.
Holders
.
ANSEM
A
bade
b
ANSEM
9cRC...pump
Market Cap
$.
Change
.
24h Vol
$.
Holders
.
MAGGIE
M
bade
b
MAGGIE
8rHo...PmZV
Market Cap
$.
Change
.
24h Vol
$.
Holders
.
Why do many trading strategies perform consistently in backtests, then suddenly fail when market conditions change?

A trading strategy may generate consistent profits over several months.

It may perform well in a trending market, with a beautiful backtest curve. But when the market enters a ranging phase or liquidity suddenly declines, signals that once worked may start failing frequently.

At that point, many people’s first reaction is: Are the parameters poorly tuned?

But the problem may not be the parameters at all. It may be that the market conditions the strategy relies on to make mone
post-image
Why do some traders review their trades every day and continue trading for a long time, yet never improve their performance?

They record every trade, study every loss, and even keep adjusting their strategy parameters.

But months later, the same problems remain: losses keep recurring, trading rules are repeatedly changed, historical backtests look increasingly impressive, yet live trading shows no clear improvement.

The problem may not be a lack of effort in reviewing trades, but a flawed review process.

1. Remembering winning trades while overlooking the details of failures

People easily
post-image
$2.5 trillion evaporated overnight! AI stocks cool off—will BTC be the next victim?

What does $2.5 trillion mean? If it were a sum of money, it would be enough to make countless investors rethink what risk management means. The Nasdaq plunged 5.5% in a single day, and AI stocks sank across the board. The market has finally started taking a serious look at one question: The future of artificial intelligence is bright, but are prices too high right now?
Previously, investors were willing to pay high valuations for the AI growth story. As long as data center expansion, chip demand, and capital s
NVDA+2.80%
Woke up to Jensen Huang admitting to cheating!
The whole internet is in an uproar… Nvidia launches an investigation
Who could have imagined that the man in a leather jacket, joking and chatting onstage, revered as the “godfather of AI,” would land on the global trending lists this way?
Here are a few possible scenarios:
1) The affair isn’t the big issue; the investigation is really focused on whether he violated export bans.
2) On the small end, it’s a private matter, and several hundred billion in wealth gets split up. On the big end, it’s collusion with the enemy, and AI supply could be affe
post-image
NVDA+2.80%
🔹Democrats Sweep Congress: Is a Major Shift Coming for Crypto? Tighter SEC Oversight and Prediction
live-cover
LIVE2,195
  • 1
$SOL The liquidation map for the past 7 days shows:
If Sol rises to $88.7, cumulative short liquidation intensity across major exchanges is $118 million;
If it rises to $91.9, cumulative short liquidations reach $356 million.
If Sol falls to $87.3, cumulative long liquidation intensity across major exchanges is $54.34 million;
If it falls to $85.5, cumulative long liquidations reach $97.93 million.

Trading strategy: place buy orders at $87.3 and $85.5; take profit at $88.5 and $91.9.
SOL-0.74%
Sex and appetite are human nature; the big shots are no different. Gates, Bezos, Jensen Huang, and the ultimate stud Musk, the crypto world's richest man... even billionaires can't resist temptation.
From the perspective of Chinese physiognomy, am I the only one who thinks those two look like a married couple?
post-image
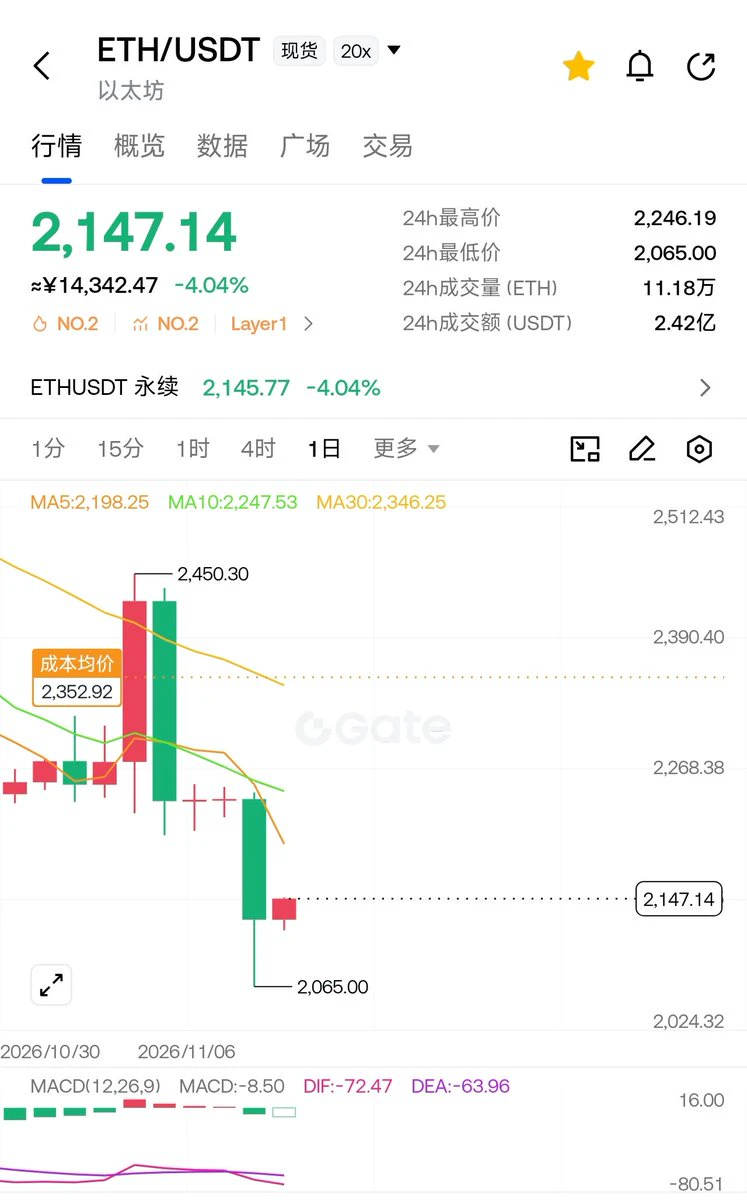
Old Huang cheats,
what’s that got to do with my Ethereum?
I’m getting caught in the crossfire just lying here.
If I cheat tomorrow,
does that mean U.S. stocks have to wobble too?
post-image
ETH-1.26%
No way???
Jensen Huang’s affair, and we’re the ones who have to pay for it??
What happened to the promised golden age of humanity? $NVDA
post-image
NVDA+2.80%
$XBRUSD ‌$CL ‌$BZ ‌
What happened to oil—from $118 down to the $90s?

The sharp decline in oil prices has been confirmed. Brent crude, which peaked above $118 on October 30, has retreated by approximately 18%, falling below the $100 mark for the first time since October 7 and closing the week with a loss of over 12%. It has been verified that WTI is trading around $90, and the prices displayed for both Brent and WTI are consistent with live market data. The catalyst for this drop—expectations of negotiations between the U.S. and Iran—has been confirmed by various sources, pointing to discus
XBRUSD-0.46%
CL-1.83%
BZ-1.18%
  • 3
🪙 Black swan clouds have yet to clear; BTC is consolidating in a narrow range, looking for a breakout! Precise short-term strategy incoming
Against the backdrop of macro sentiment affected by heightened geopolitical tensions, coupled with market concerns over compliance and security incidents, global risk assets are highly volatile. After BTC saw a cascade of long liquidations in the early morning and wicked down to touch strong support at 73,420, it quickly staged an oversold rebound and is now in an extremely tight triangle consolidation phase within the 74,500 - 75,500 range.
Looking at th
BTC-0.65%
#pi That Sao Long was right again. I really should follow his lead and keep some ammo ready for around 0.05. I withdrew 20,000 to my wallet, and sold another 20,000 last night at 0.072. I couldn’t do anything because I’d set a trading limit, and could only watch you all scoop up coins below 0.07. I figure I’ll be able to buy 1,000 more after midnight tonight. Should I buy now or wait until around 0.05? Pi friends, what do you think
PI-0.60%
  • 1
SHIB’s decline is not over yet, with $0.00000410 becoming a key line of defense

Shiba Inu (SHIB) faced further selling on November 9, weakening further after falling below the important psychological level of $0.00000500 and hitting a low near $0.00000447. As market buying gradually weakened, investors began turning their attention to lower support zones, especially the key price level of $0.00000410.
From the daily technical structure, SHIB is currently well below the 200-day moving average near $0.00000545. This indicates that the price remains in a relatively weak trend environment, and sh
SPCX+8.74%
  • 1
How can you tell whether a trading strategy has a genuine statistical edge rather than making money by luck?

One of the easiest mistakes to make in trading is to treat making money as proof that a strategy works.

A string of profitable trades could mean the strategy has an edge, or it could simply mean it happened to encounter market conditions that suited it.

So how can you tell the difference?

The key is not to look at how much a few trades made, but to determine whether, under sufficiently reasonable testing conditions, the strategy has a repeatable positive expectancy that remains afte
post-image
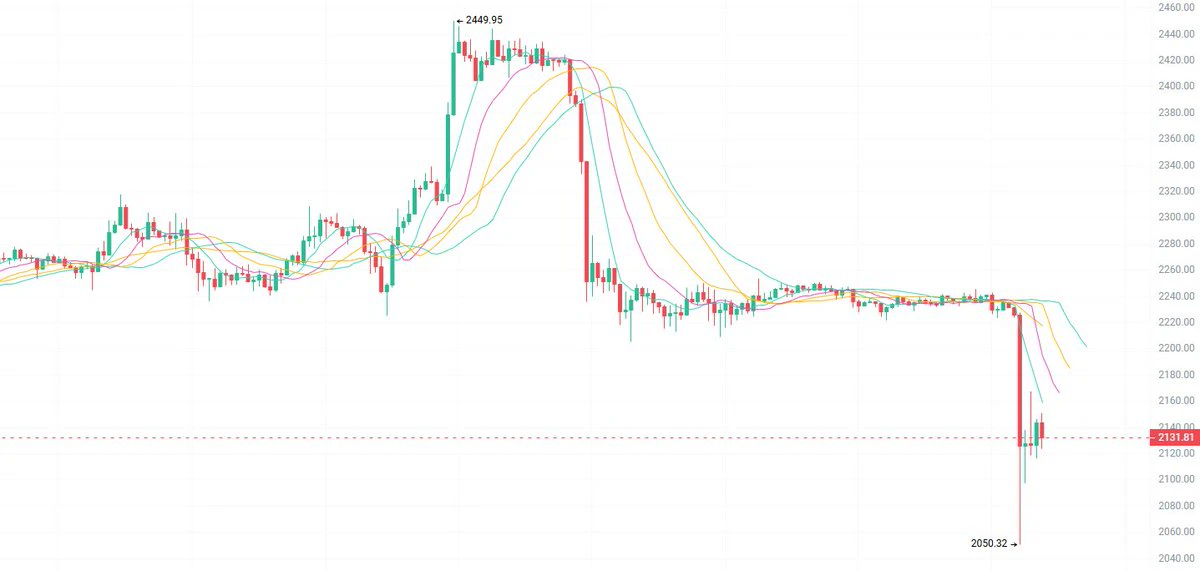
11.9 ETH: The rebound near 2150 is meeting resistance; consider a light short, targeting 2080/2050.
For those looking to go long, wait for support to hold near 2050 before entering. Stop at 2010; targets are 2120/2160.
On the 1H chart, price has plunged from the high of 2449, with a wick down to 2050. It briefly rebounded to around 2130, but the moving averages are fully aligned bearishly and diverging. The 2100 support level is being contested repeatedly, while 2160/2200 are resistance overhead. Bears still have the upper hand for now $ETH #ETH
post-image
ETH-1.26%
If drunk driving is illegal, why do cars come with bottle openers?
post-image
Load More

Join 40 M users in our growing community

⚡️ Join 40 M users in the crypto craze discussion

💬 Engage with your favorite top creators

👍 See what interests you

Trending Topics

USCPIDataIncoming

21.09k Views1.72k Discussing

The U.S. October CPI report will be released on November 10 at 8:30 a.m. ET. September CPI came in at 3.7% year over year, and markets will be watching closely for signs that inflation is cooling, especially in core CPI. A softer-than-expected reading could strengthen rate-cut expectations, while hotter inflation may pressure risk assets through higher Treasury yields and a stronger dollar. How do you think this CPI print will move $BTC, U.S. stocks and gold?

BTCFlashCrash

11.44k Views65.99k Discussing

USAIStocksHitHard

31.15k Views3.75k Discussing

View More