Share your thoughts
placeholder
Article
SanDisk’s 12% Surge: Is the Market Pricing in “Oversupply Three Years From Now,” or Is AI Rewriting the Cycle?
On September 4, SanDisk closed at $1,740, surging 11.9%.
Just the day before, it had risen only 0.1%. The difference between the two days was enormous.
That day, U.S. stocks were “scared off” by the nonfarm payrolls data, with the Dow and S&P falling across the board. But the Philadelphia Semiconductor Index rose 3.4% against the trend, and SanDisk became the S&P 500’s biggest gainer.
The broader market fears rate hikes; chips do not.
The market is expressing a judgment with real mone
post-image
BTC-1.36%
SNDK+12.40%
SKHY+6.92%
This is literally me screaming God Morning so that neighbours will hear well.
Gm Everyone
post-image
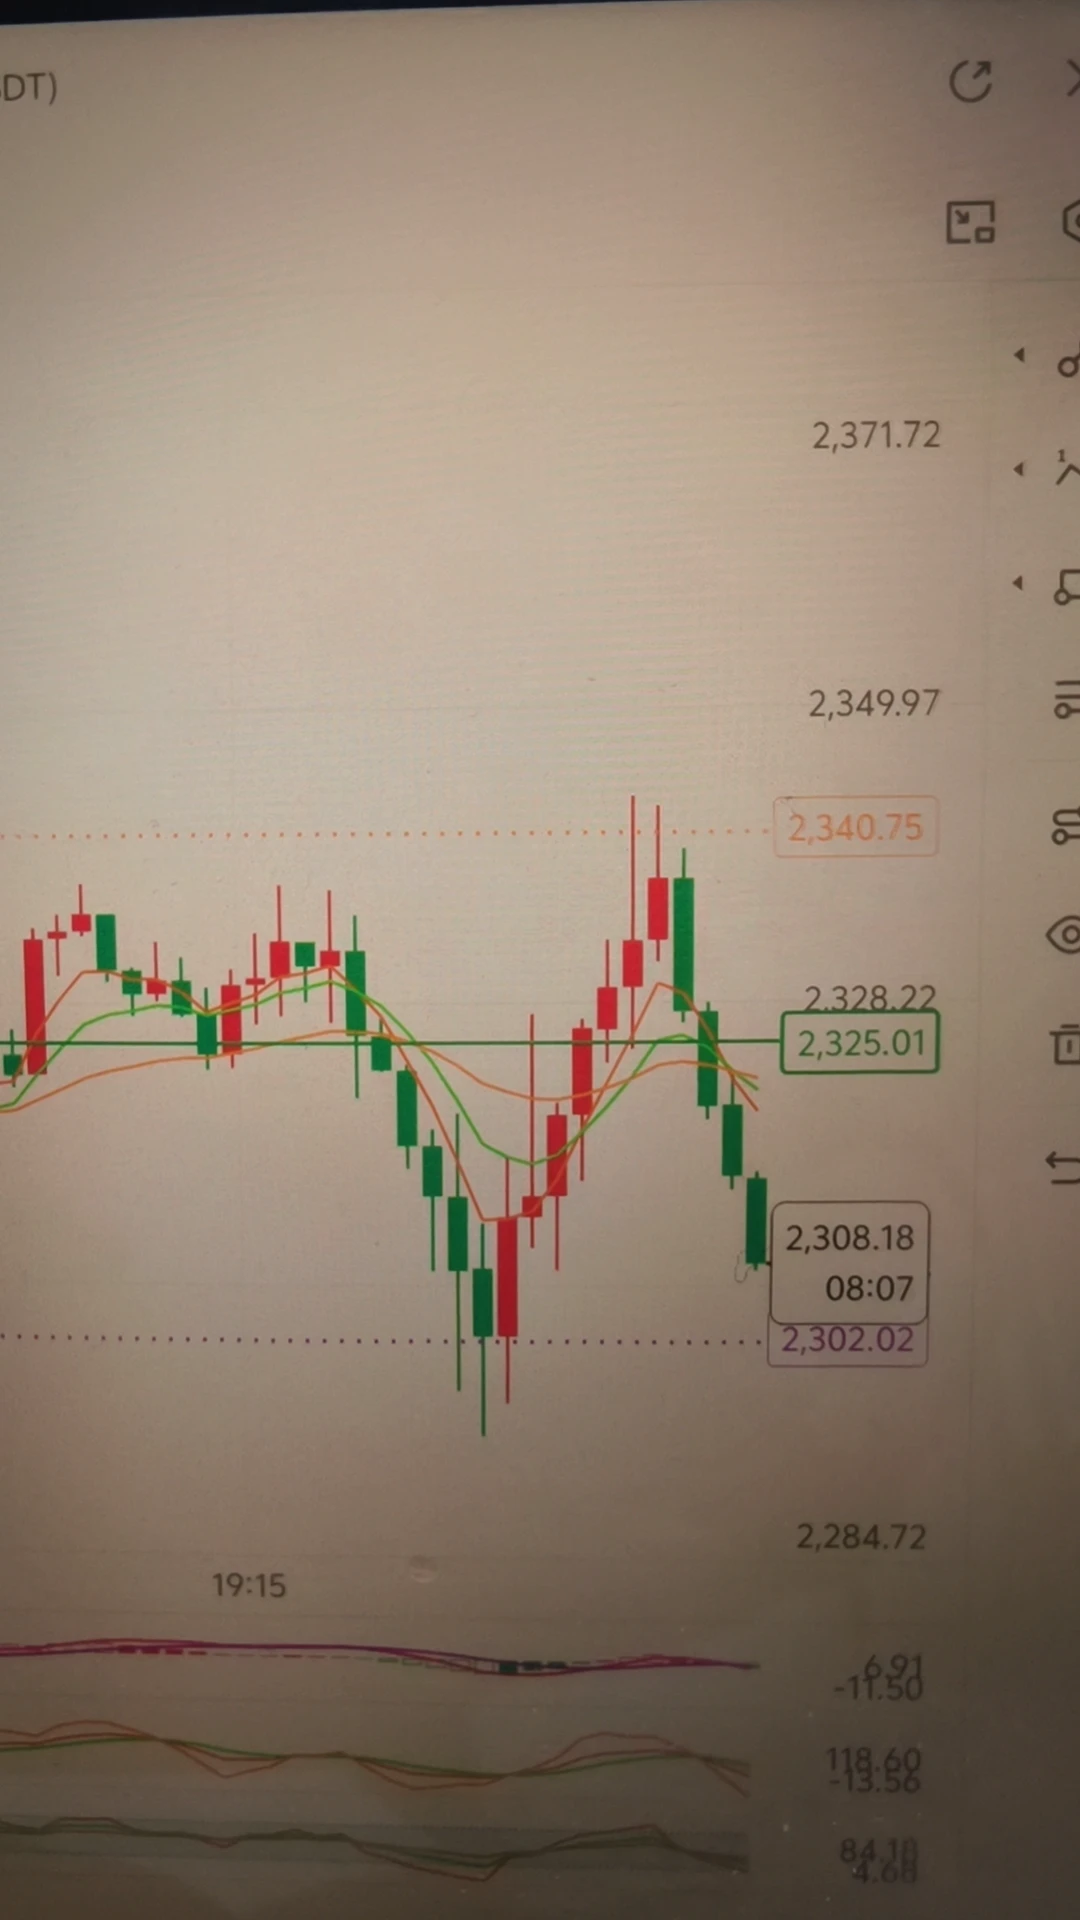
The market moved more cleanly than expected. After this wave of $ZEC pulled back and stabilized, I added to my long position as planned, entering around 828.40. At the time, the only basis was a clear bottoming signal in the structure: the low-volume retracement did not break the previous low.

The process was not entirely smooth. There was a false downward wick that swept the lows, but it quickly recovered, showing that support at lower levels was still there. I did not chase the move by adding to my position, nor was I shaken out by that wick. I patiently waited for the first target to be r
post-image
ZEC+6.11%
BNB+0.80%
SOL-1.36%
Oil and Geopolitical Risk Stay Elevated! Can BTC & ETH Avoid Another Risk-Driven Pullback?
live-cover
LIVE1,129
$AXS help me help you GATEIO!!!! 😡😡😡🙏🏼🔥💵💵
#axs5l
post-image
AXS+1.65%
This could be Solana's very own narrative with @elonmusk
@cz_ replied a few years ago to Elon about Marscoin and now they have their own coin backed by RWA (real world assets) in the millions.
-
Elon once said he will buy $urcoin , and @toly acknowledged.
Now you get $URCOIN and receive $SPCX
CGMVxtvLpjMarSRRq6adrx7px4ducKqSp1yhf94ZA847
post-image
SOL-1.37%
MARSCOIN+42.98%
RWA-1.72%
SPCX-1.29%
Everyone’s staring at LTC’s 15m RSI at 73—but the 4h tape is already whispering a trap.

$LTC /USDT - SHORT

Trade Plan:
Entry: 52.7 – 52.9
SL: 53.9
TP1: 52.0
TP2: 51.4
TP3: 50.6

Why this setup?
- The 1D trend is *range*, not breakout—so this 52.8 pop is just mean-reversion fuel.
- 15m RSI 73.64 is overheated; shorts are waiting at 52.8–52.9 with TP1 at 52.0.
- ATR 1h at 0.46 means volatility is tight—when it snaps, it snaps down.
- Why now? The “waiting” status means the setup hasn’t fired yet—you’re early, not late.

Debate:
Is 52.8 the perfect short entry, or are we about to get
LTC+5.32%
Longed $29m of $BTC
Free Signals:
post-image
BTC-1.38%
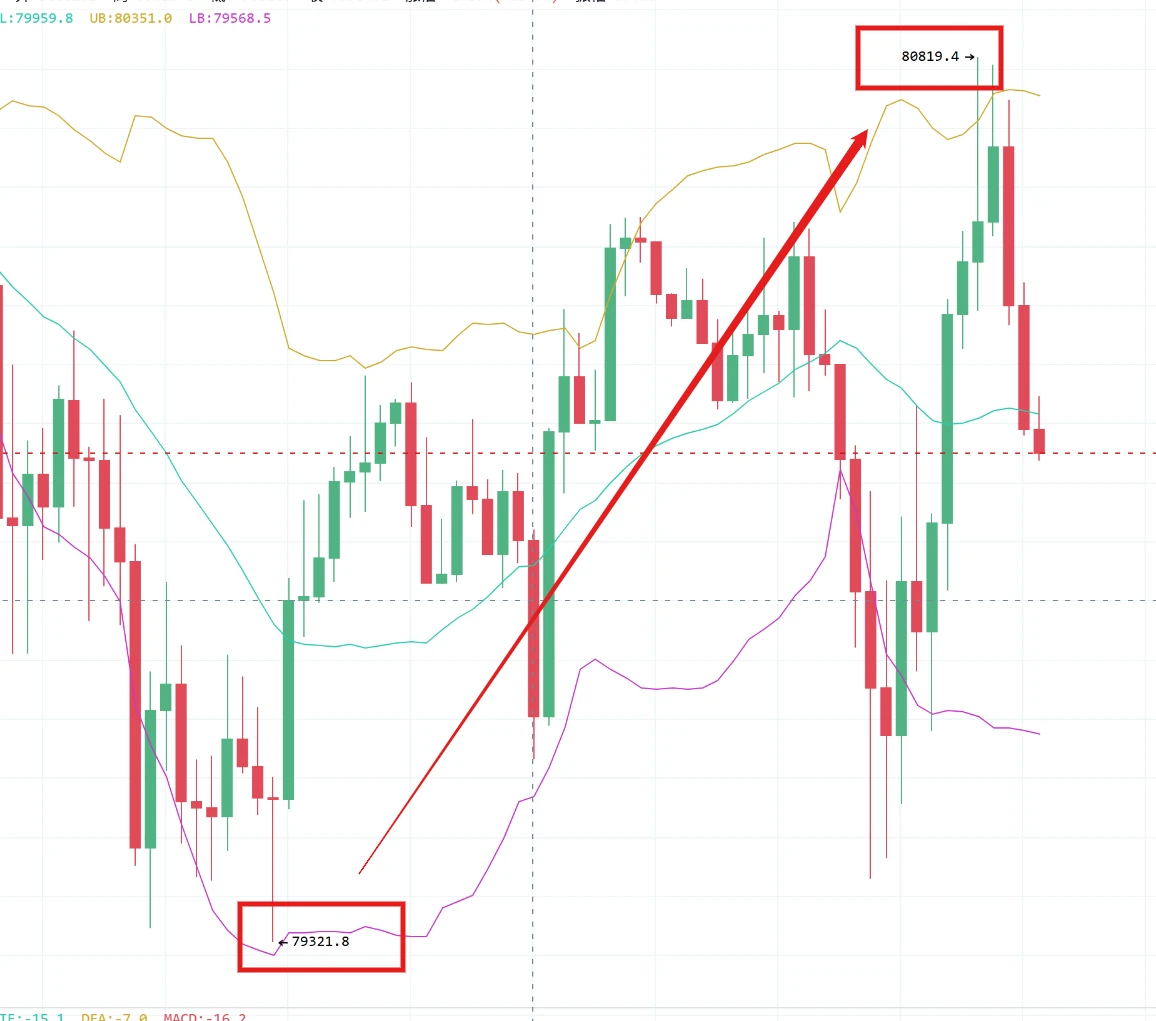
Everyone’s staring at $BTC /USDT’s range—but this quiet 4h setup is the loudest signal we’ve had all week.

$BTC /USDT - SHORT

Trade Plan:
Entry: 79449.24 – 79630.28
SL: 80408.78
TP1: 78887.99
TP2: 78453.48
TP3: 77801.71

Why this setup?
- 1D is trapped in a range, yet the 4h bias flips SHORT with 55.4 conviction.
- Price is hugging the 4h EMA at 79,539.76, but RSI (15m: 43.89) shows momentum is fading—not crashing, just leaking.
- ATR (1h: 362) is tight, meaning the breakout, when it comes, will be violent.
- Why now? We’re armed at the exact midpoint of the range—not chasing, but p
BTC-1.38%
People literally apeping 🦍 into this at $42 million lol
$shroom
0xab093def657f15df31b33922a95e047add645b29
post-image
In the early period, the long and short scenarios alternately took the lead, reflecting intense tug-of-war; after September 4, the expectation of a rise to 2600 briefly led by a wide margin before quickly retreating; currently, the probabilities of 2600 and 2300 are very close, while the upside expectation for 2700 is relatively weak.
post-image
#Web3SecurityGuide
In Web3, your wallet is your responsibility. There is usually no customer-support button that can reverse a bad signature or recover a compromised private key. The safest approach is simple: treat every connection, approval and transaction as a security decision. A few seconds of verification can protect assets that may otherwise be impossible to recover.
Never share your seed phrase or private key with anyone. Not with a friend, support agent, developer, moderator or anyone claiming to represent a wallet or platform. Legitimate services do not need your seed phrase to “ver
post-image
#GateTops7DayNetInflowsGlobally
GATE CROSSES $300M IN 7-DAY NET INFLOWS
Gate has recorded approximately $300.43 million in net capital inflows over the past seven days, placing it among the top three globally according to the latest DeFiLlama-based data. The figure is significant because it shows that capital movement toward Gate has remained strong even while the broader crypto market is dealing with elevated volatility and changing macro expectations.
WHAT DOES $300M+ NET INFLOW ACTUALLY MEAN?
Net inflow is not simply the amount of money entering an exchange. It represents the difference b
post-image
Falcon_Official
#GateTops7DayNetInflowsGlobally
Gate is making a strong statement through capital flows. According to DeFiLlama data, Gate recorded approximately $273.72 million in net capital inflows over the past 7 days, placing it among the top three centralized exchanges globally. For an exchange, this is more than just a large number on a dashboard—it shows that a significant amount of capital has moved onto the platform after accounting for outflows.
The important word here is “net.” If users deposit $500 million but withdraw $226 million during the same period, the net inflow is roughly $274 million. That means the headline figure is measuring the difference between money coming in and money leaving, rather than simply counting deposits. This makes a sustained positive seven-day figure a useful indicator for understanding where exchange liquidity is building.
A seven-day window is particularly interesting because it filters out some of the noise that can appear in a single day. One large transfer can make a 24-hour ranking look impressive, but maintaining strong net inflows across an entire week suggests broader activity. Capital may be arriving for spot trading, derivatives, portfolio repositioning, new listings, hedging or simply to keep funds ready for opportunities.
There is another reason this number deserves attention. Exchange inflows should never be interpreted as an automatic bullish signal for the entire crypto market. Coins moving onto an exchange can eventually be used for buying, but they can also be deposited for selling or hedging. The stronger interpretation comes when capital inflows are combined with trading volume, price action, stablecoin liquidity and user activity. In other words, inflow tells us where capital is moving; market behavior tells us what that capital is actually doing.
Gate's broader flow picture also adds context. DeFiLlama data cited by Gate showed approximately $520.45 million of net inflows over the past month, ranking Gate third among centralized exchanges globally. The seven-day figure therefore fits into a larger story of meaningful capital movement rather than appearing as an isolated one-day event.
For traders, this is the part I find most interesting. If strong net inflows continue while trading activity expands, liquidity becomes an increasingly important part of the Gate ecosystem. More available capital can support deeper market participation and provide traders with greater flexibility when volatility creates opportunities. But if inflows rise while prices weaken sharply, the interpretation becomes more complicated because those funds could be positioned for selling or defensive strategies.
The recent data also shows how quickly rankings can change. Another September 3 snapshot from DeFiLlama placed Gate's seven-day net inflow at $78.19 million and ranked it first among global centralized exchanges, highlighting that exchange-flow figures can move rapidly as deposits and withdrawals change. The key takeaway is therefore not to treat one snapshot as permanent, but to watch whether positive capital-flow momentum continues over multiple periods.
For Gate, the $273.72 million seven-day net inflow is still a notable milestone. It puts the exchange firmly on the global capital-flow radar and gives the community another metric to watch beyond simple trading volume. If the next weekly readings remain positive and are accompanied by stronger activity, that would make the trend considerably more meaningful.
Capital follows opportunity, but the smartest signal is not simply seeing money arrive. The real signal is seeing whether that capital stays, participates and contributes to sustained market activity.
@Gate_Square
repost-content-media
BTC-1.36%
  • 5
$XAUT Thursday Shipan Summary
A total of 9 trades were set up intraday, with 7 wins and 2 losses, yielding 51 points of gains
Long-term, stable compounding is the core of trading. Traders who can consistently achieve steady returns all adhere to their own trading systems, restrain greed, put risk management first, stay in step with the market rhythm, and move forward steadily!
post-image
XAUT-0.60%
Yunxiang Research Institute Quantitative Data 2026.1/2026.8
Average return of 90%, supports leading platforms
Starting at $10,000, quarterly profit sharing.
Welcome to partner with us.
post-image
Good Morning Frens!🌤☕️ Have a good weekend!
post-image
Making money is so hard—who on earth is actually making money?
post-image
It’s weekend proper
Gonna be touching some grass today while still trying to print from prediction market
We go again as usual
post-image
market update eth
live-cover
LIVE1,124
Load More

Join 40 M users in our growing community

⚡️ Join 40 M users in the crypto craze discussion

💬 Engage with your favorite top creators

👍 See what interests you

View More