Share your thoughts
placeholder
Article
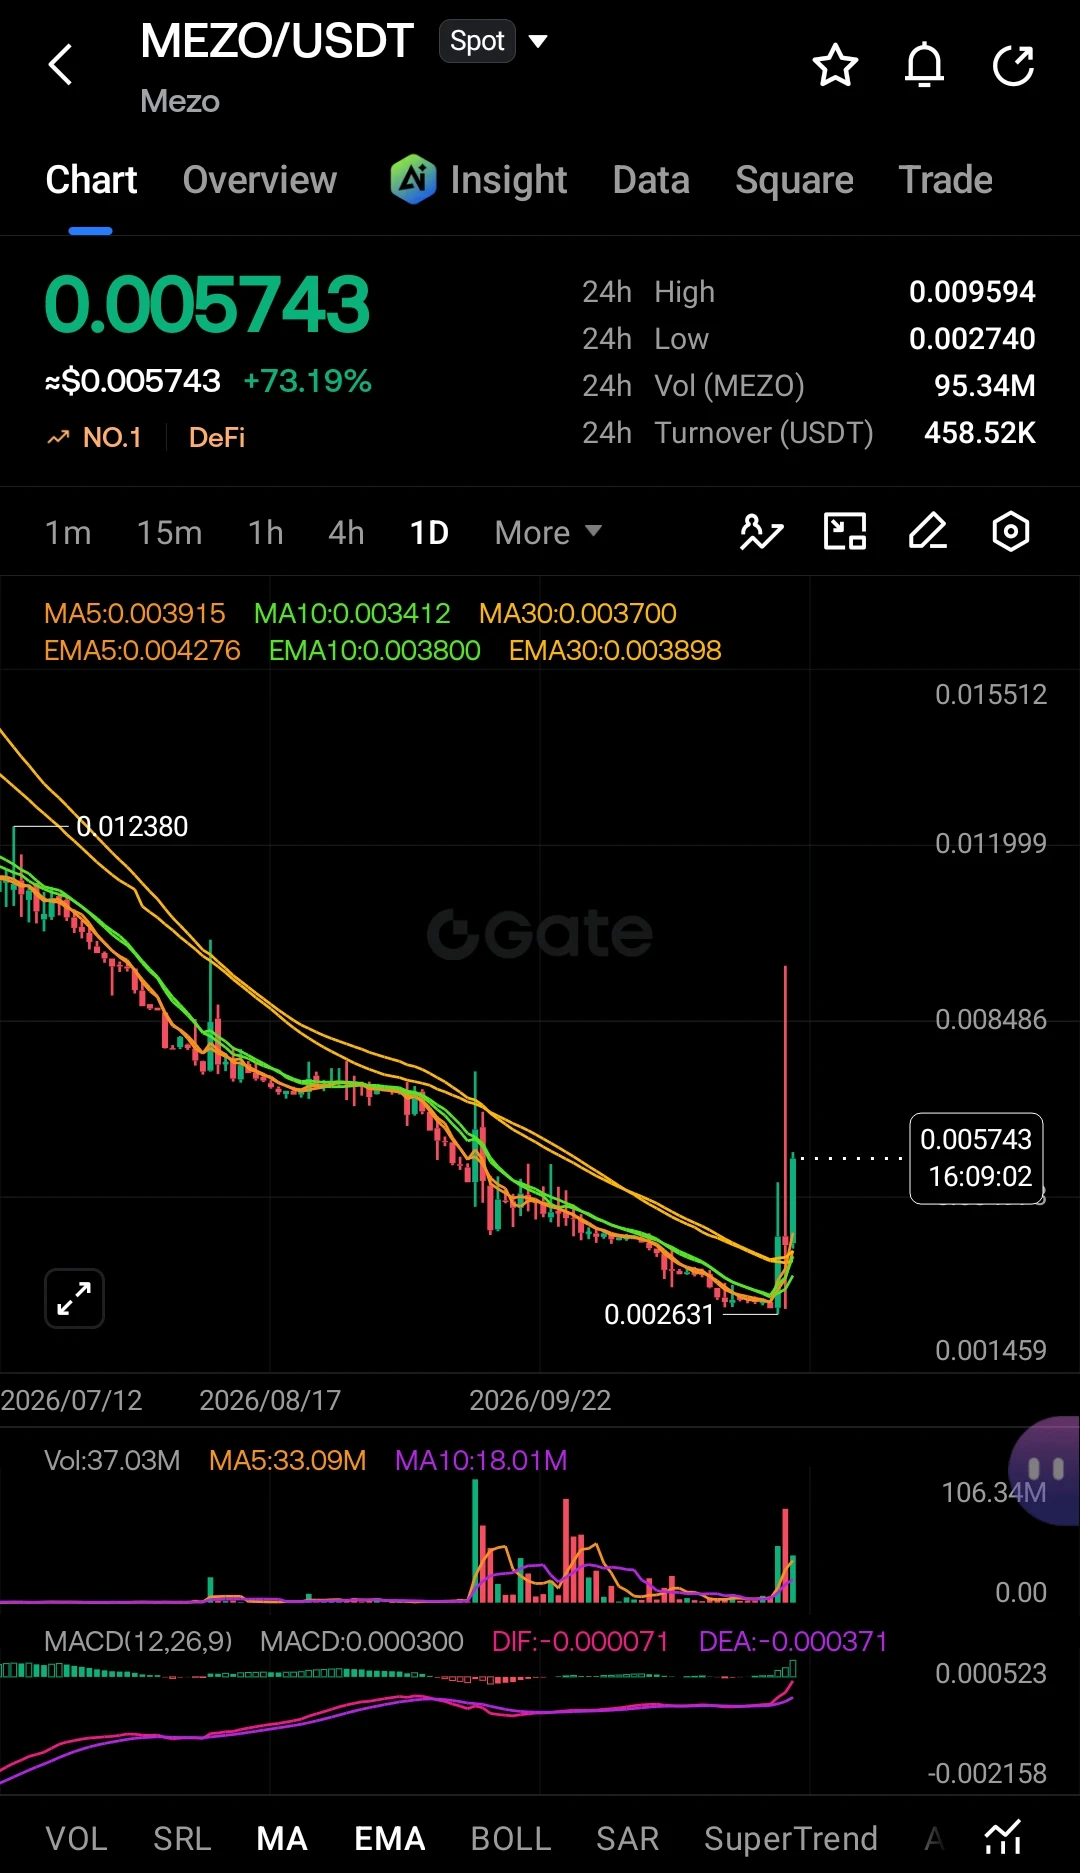
Lobster is a BSC Chinese Meme token, tied to the OpenClaw “raising lobsters” AI Agent meme narrative. Its market cap has returned to around $60 million, but spot trading volume is only a few million dollars—the market cap is up, but turnover has not kept pace. The September 4 high was around $0.094, and the 10th low was around $0.037; today it has rebounded from the bottom. This is not a new exchange listing, but weekend capital flowing back into the Chinese market.
$Lobster
post-image
龙虾+68.21%
80,000 #BTC The city gate is in sight! BTC TP2 secured, all three limit orders hit
BTC’s rally continues: entered at 76,200 after catching the wick, target 1 at 77,144 secured, target 2 at 78,444 also hit tonight, with a high of 79,855—just $145 short of the 80,000 mark.
Battle report: BTC secured both targets; ETH broke through three levels with a single 10.9% bullish candle; gold caught the wick at 4,295 and reached 4,354. Three limit orders, three assets, all hit.
Now for two legendary home-guard trades: BTC 150x, from 58,276 to 79,670, +5,464%; ETH 150x, from 1,513 to 2,648, +11,172%. Sho
post-image
NVDA+0.74%
🎉 Win Up to 100 USDT Weekly! Gate Square #WeeklyShare Is Live!
📌 How to Join
① Sign up 👉 https://www.gate.com/campaigns/6244
② Post with #ShareWeekly and #AugustCPIDataIsOut
③ Share your market view to win rewards!
💬 This Week’s Hot Topic
U.S. August CPI rose 0.4% MoM, the highest since June, while annual inflation held steady at 3.4%, both in line with expectations. How will this shape Fed policy expectations and market opportunities?
💡 Discussion Ideas
1️⃣ Will the CPI data change expectations for the Fed’s rate-cut path?
2️⃣ How could crypto and stocks react in the short term?
3️⃣ Whic
Ride the Storage Wave: Win up to 888 USDT in DRAMG on Each Track https://www.gate.com/campaigns/6183?ref=VLARBF1YAG&ref_type=132
post-image
DRAMG+1.12%
I was just about to curse it out, but then I looked at my account. Never mind—it can pump however it wants; I’ll shut up.
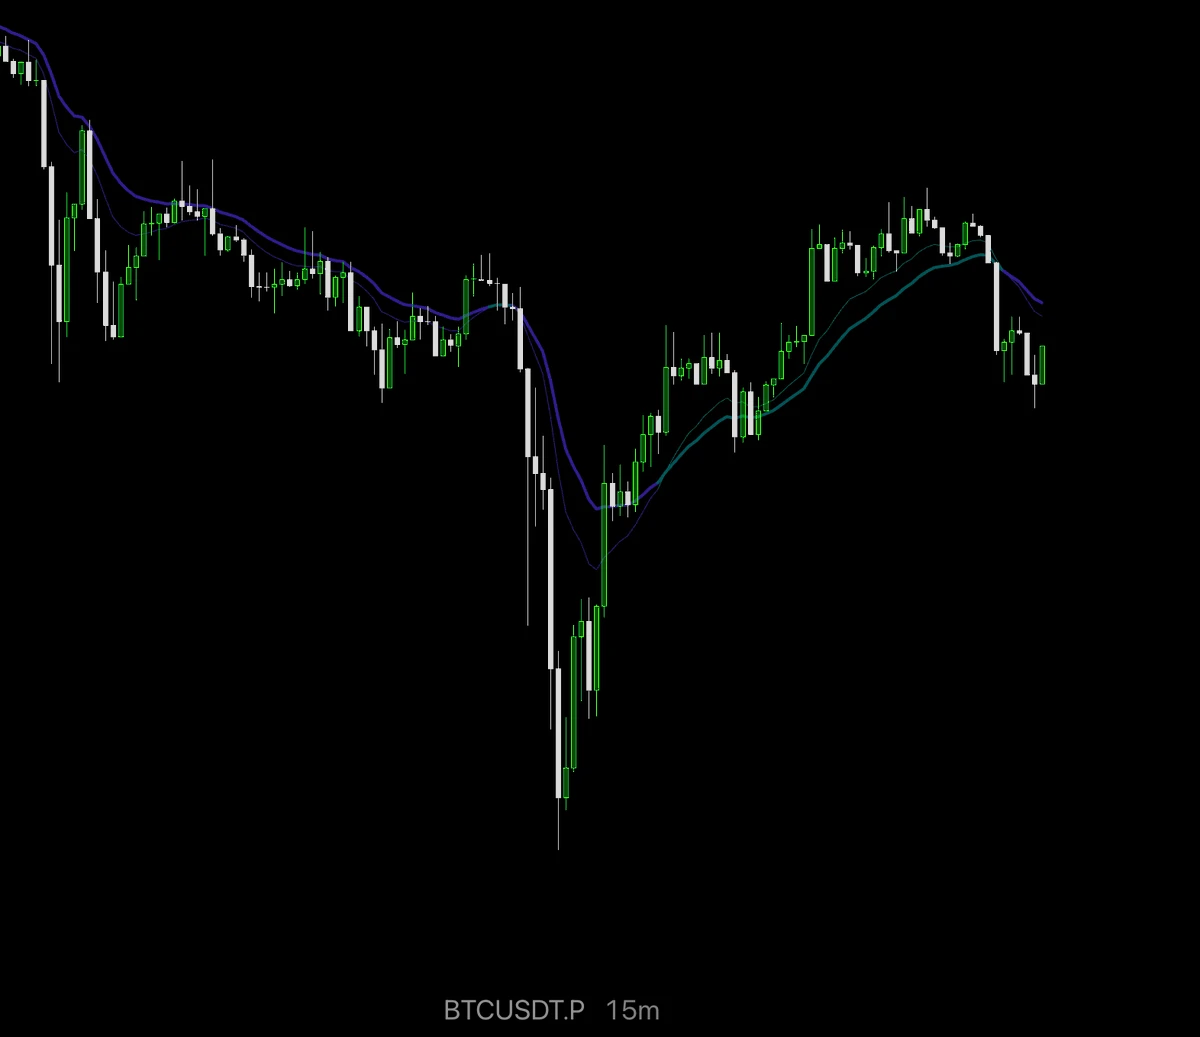
I opened the chart this morning to check $BTC . Funds were quietly entering, and after consolidating at the bottom, it started to rise. I warned not to get off too soon—pullbacks are still opportunities.
63014.1 to 77066.8, +3876.67%—a huge gain. The wait wasn’t in vain; this profit feels great. Those still on board should be waking up laughing.
Being out of a position isn’t a sin; opening positions recklessly is the mistake. No matter how much unrealized profit there is, it
post-image
BTC-0.05%
SOL+1.85%
ETH+3.32%
#OracleQ1EarningsBeatStockUpOver5%
🚀 Oracle Q1 Earnings Beat — AI & Cloud Demand Take Center Stage
Oracle has delivered a powerful start to fiscal 2027, with its latest quarterly results beating Wall Street expectations and sending investor confidence higher. The company’s strong performance once again highlights how rapidly artificial intelligence, cloud infrastructure, and enterprise technology are reshaping the global market.
Oracle reported Q1 FY2027 revenue of approximately $19.3 billion, up 30% year over year. Non-GAAP earnings per share came in at $1.92, above analyst expectations of
ORCL-1.26%
  • 3
RIVER is a high-volatility old token; there is no new independent catalyst today.
$RIVER
post-image
RIVER+20.77%
$BTC Signal】Long | 1H upper-band breakout + 4H MACD golden cross
$BTC The 1H upper band at 78735 has been broken above, while the current price of 79141 is hugging the upper boundary of the recommended range, with RSI_1H at 74.62.
The 4H MACD golden-cross histogram is 54.96, and the 1H MACD histogram is expanding at 290.89; the order-book buy/sell ratio is 2.02, with 33.75% depth imbalance; the funding rate is 0.0067%, and OI is stable. Longs are taking the initiative, with buying pressure continuously pushing up the price.
🎯Direction: Long
⚡Entry/Limit order: 78903.58 - 79141.00
🛑Stop-loss
post-image
BTC-0.05%
A few days ago, I shakily removed the stop-loss. Looking at it today, it feels like I narrowly escaped.
During the intraday bottoming process, $SOL just sat there unmoving. The bottom grew increasingly stable; it bottomed around 75.33 without breaking down. I said at the time: if it doesn't break, hold it and go long.
Panic comes from having no plan; losses come from overthinking.
Don't get inflated by profits, and don't despair over drawdowns.
Now at 102, with +3290.94% firmly in hand—enduring it wasn't in vain. Take 80% off the table first, and move the stop-loss for the remaining 20% to th
post-image
SOL+1.85%
XRP+0.39%
DOGE+0.63%
Win up to 100 USDT every week! Gate Square #WeeklyShare Is Live!
📌 How to Join
① Register 👉 https://www.gate.com/campaigns/6244
② Post with #ShareWeekly and #AugustCPIDataIsOut
③ Share your market insights to win rewards!
💬 This Week’s Hot Topic
U.S. CPI rose 0.4% MoM in August, the highest since June, while annual inflation remained at 3.4%, with both figures in line with expectations. How will this shape expectations for Fed policy and market opportunities?
💡 Discussion Ideas
1️⃣ Will the CPI data change expectations for the Fed’s rate-cutting path?
2️⃣ How will crypto and stocks react
post-image
  • 1
Chef Misty 👩‍🍳
post-image
Another perfectly timed stop-loss sweep—then it pumps right after. 100%
post-image
BTC ETH and Altcoins
live-cover
LIVE1,399
August CPI: Calm Headline, Mixed Signal for Markets
August CPI came in close to expectations, but the details matter more than the headline.
Headline CPI rose 0.4% MoM, up from July’s 0.1%, while annual inflation remained at 3.4%. Core CPI increased 0.3% MoM and eased to 2.4% YoY.
So, the picture is mixed.
Core inflation is moving in the right direction, but the stronger monthly headline reading shows that price pressures haven’t completely disappeared.
For the Fed, this keeps the next decision complicated. For traders, it means the market may react more to yields, rate expectations and the de
post-image
BTC-0.02%
  • 4
  • 2
#晒出带单成就 #速来!跟我赚钱##稳健带单长线收益#The first copy-trading customer grew their funds from 100u to 101.47u in one day.
CPI Surprise Could Reprice September Rate Bets, Can BTC and ETH Absorb The Shift?
live-cover
LIVE1,093
$ZEC
Ripping from 1054.57, now pressing 1295.28. Price above the 10 and 30 but below the 5—pullback after a strong move. Break above 1218.10 triggers recovery; rejection retests 1155.78. Momentum cooling but structure intact.
Entry Zone: 1173 – 1175
TP1: 1218
TP2: 1250
TP3: 1295
Stop-Loss: 1100
#ZEC #ShareWeekly #CoinDeskRevealsGateRWAPerpetualsTop3Globally #AugustCoreCPIBeatsExpectations #GateMeme
post-image
ZEC+4.30%
  • 4
  • 2
The oil market is presenting an unusual picture these days. To understand the direction of prices, one must first look at the charts and then at the news flow behind them.
What Do the Charts Say?
In the first chart, Brent crude is trading at $105.43, having dipped as low as $104.54 during the day. This indicates a sharp sell-off and suggests the market is searching for direction. The second chart shows Brent at $100.48, with a 24-hour trading volume hovering around 643,000 barrels. These figures point to a highly volatile market where investors can rapidly shift their positions.
Factors Drivin
User_any
Smoke Detected Along Saudi Arabia's East-West Pipeline: Attack Allegation Unconfirmed
Satellite imagery has detected heavy smoke along the route of Saudi Arabia's strategic East-West Crude Oil Pipeline. The images indicate a large plume of smoke in the section of the pipeline southeast of Medina, towards Mahd adh-Dhahab. NASA's FIRMS fire detection system also recorded thermal anomalies clustered in the same area.
Verification Status
There is currently no independent confirmation that the pipeline has been struck or that the detected fire is related to oil infrastructure. NASA stated that while the FIRMS system can detect active fires and thermal anomalies, the data alone cannot determine what is burning or the cause of the heat source.
Strategic Importance of the Pipeline
The East-West Pipeline, spanning approximately 1,200 kilometers, transports crude oil from production and processing facilities in the Abqaiq region of eastern Saudi Arabia to Yanbu on the Red Sea coast. The pipeline's primary function is to enable the transport of Saudi crude oil to the Red Sea without passing through the Strait of Hormuz. This feature enhances the pipeline's importance given current conditions where maritime traffic in the Strait of Hormuz is restricted.
Regional Tensions and Background
This development coincides with a period of escalating tension between the Houthis and Saudi Arabia. On September 8, the Houthis launched missile and drone attacks on the Saudi regions of Jazan, Abha, Najran, and Khamis Mushait. Saudi Arabia also carried out retaliatory strikes in Yemen. The Houthis also seized the strategic Red Sea port city of Mokha and advanced toward the Bab el-Mandeb Strait. According to data cited by the Associated Press, maritime traffic passing through the Bab el-Mandeb has dropped by approximately 60 percent due to earlier Houthi attacks.
Impact on the Oil Market
Amid rising regional tensions, Brent crude surpassed the $108 mark this week, reaching its highest level in recent months. On Friday, however, the price retreated slightly, with Brent crude trading in the $104 range. On a weekly basis, Brent crude has gained more than 8 percent in value.
Key factors driving oil price movements include restrictions in the Strait of Hormuz and the perceived risk regarding the Red Sea shipping route. If the alleged attack on the pipeline is confirmed, it would imply that the land-based infrastructure Saudi Arabia uses to bypass the Strait of Hormuz has also become a target.
It remains unclear whether the situation involving the pipeline has caused any disruption to oil flows. Official statements and independent verifications regarding the matter will be crucial in assessing the development's potential impact on energy markets.
$XBRUSD $CL
DYOR 🔎 NFA ✔️
repost-content-media
BZ-2.72%
XBRUSD-3.70%
  • 1
#AugustCoreCPIBeatsExpectations
U.S. CPI Data Released
The U.S. Bureau of Labor Statistics reported that August CPI increased 3.4 percent year over year. This was in line with market expectations.
Monthly CPI growth also came in at 0.4 percent, matching forecasts.
Core CPI Comes in Higher
Core CPI, which excludes food and energy prices, increased 0.3 percent month over month.
The market expected a 0.2 percent increase. The higher than expected core reading surprised investors.
Impact on Interest Rate Expectations
Although the headline CPI data matched expectations, the stronger core CPI readi
post-image
BTC-0.02%
Load More

Join 40 M users in our growing community

⚡️ Join 40 M users in the crypto craze discussion

💬 Engage with your favorite top creators

👍 See what interests you

View More